


Report Overview
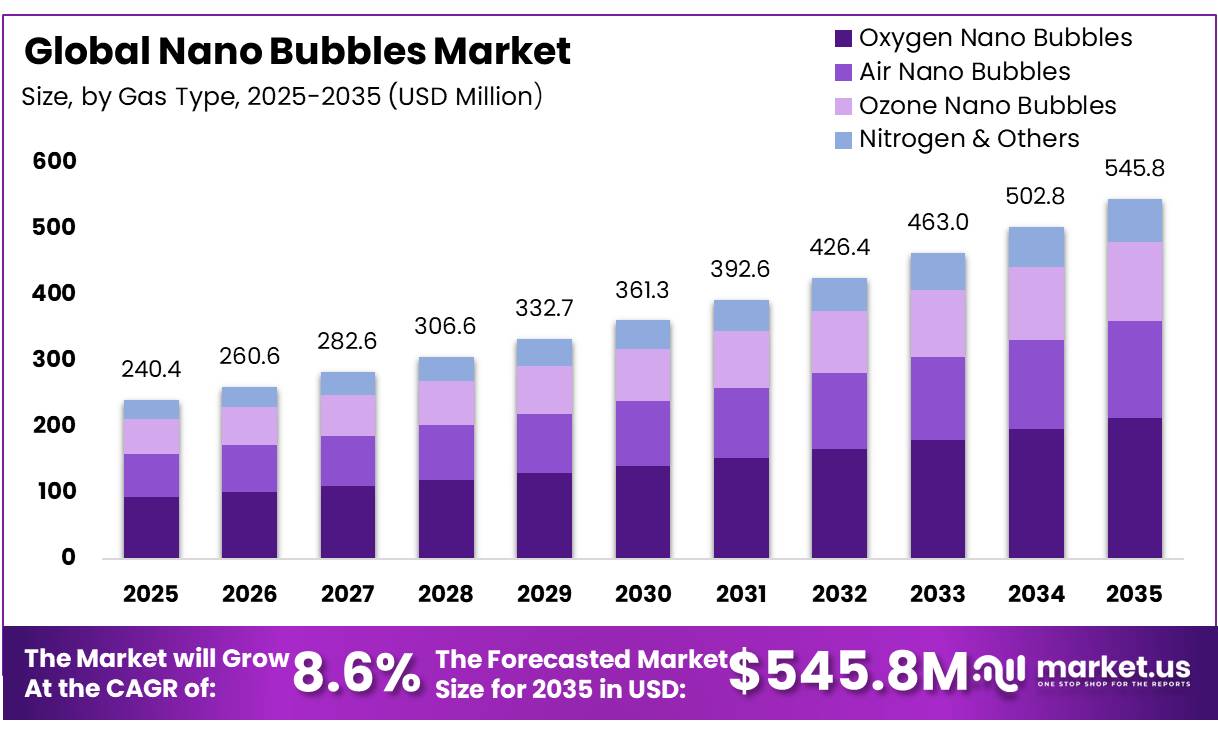
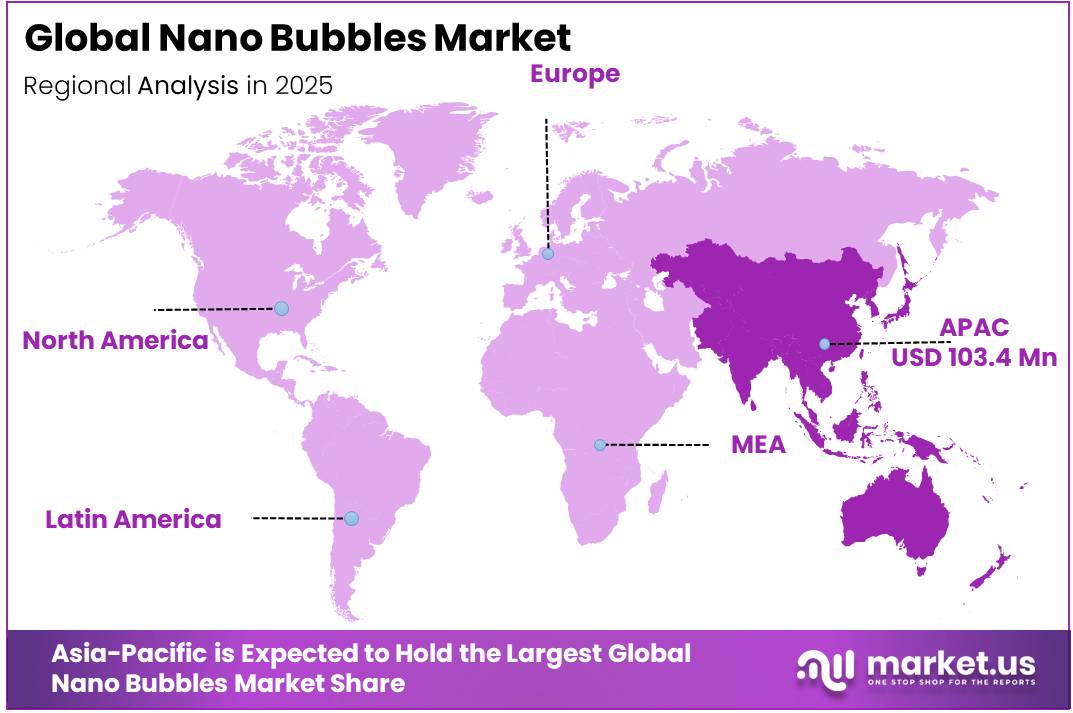
In 2025, the Global Nano Bubbles Market was valued at USD 240.4 million, and between 2026 and 2035, this market is estimated to register a CAGR of 8.6%, reaching about USD 545.8 million by 2035. Asia Pacific held a dominant market position, capturing more than a 43% share, holding USD 103.4 million in revenue.
The nano bubbles industry develops generators that disperse air, oxygen, ozone, nitrogen, or other gases into liquids for water treatment, agriculture, aquaculture, healthcare, food processing, and industrial cleaning. The United States Department of Agriculture describes nanobubbles as gas-filled cavities with diameters below 1 micrometre. Their long residence time and efficient gas transfer support demand for hydrodynamic cavitation, pressurized dissolution, electrolysis, and ultrasonic systems across municipal and industrial operations to improve process control and consistency.
- In 2024, the United States Department of Energy awarded USD 2.5 million to a University of Tennessee project using oxygen nanobubbles in water resource recovery facilities. The pilot targets 200 litres per day for 6 weeks, with estimated reductions of 70% in aeration energy and 30% in mixing energy, while seeking at least 50% overall energy and cost savings under realistic wastewater treatment operating conditions.
Key Takeaways
- The global Nano Bubbles market was valued at USD 240.4 million in 2025.
- The global market is projected to grow at a CAGR of 8.6% and is estimated to reach USD 545.8 million by 2035.
- On the basis of gas type, oxygen nano bubbles dominated the market, constituting 39% of the total market share.
- Based on technology type, hydrodynamic cavitation dominated the nano bubbles market, with a substantial market share of around 34%.
- Based on application, water treatment led the market, comprising 36% of the total market share.
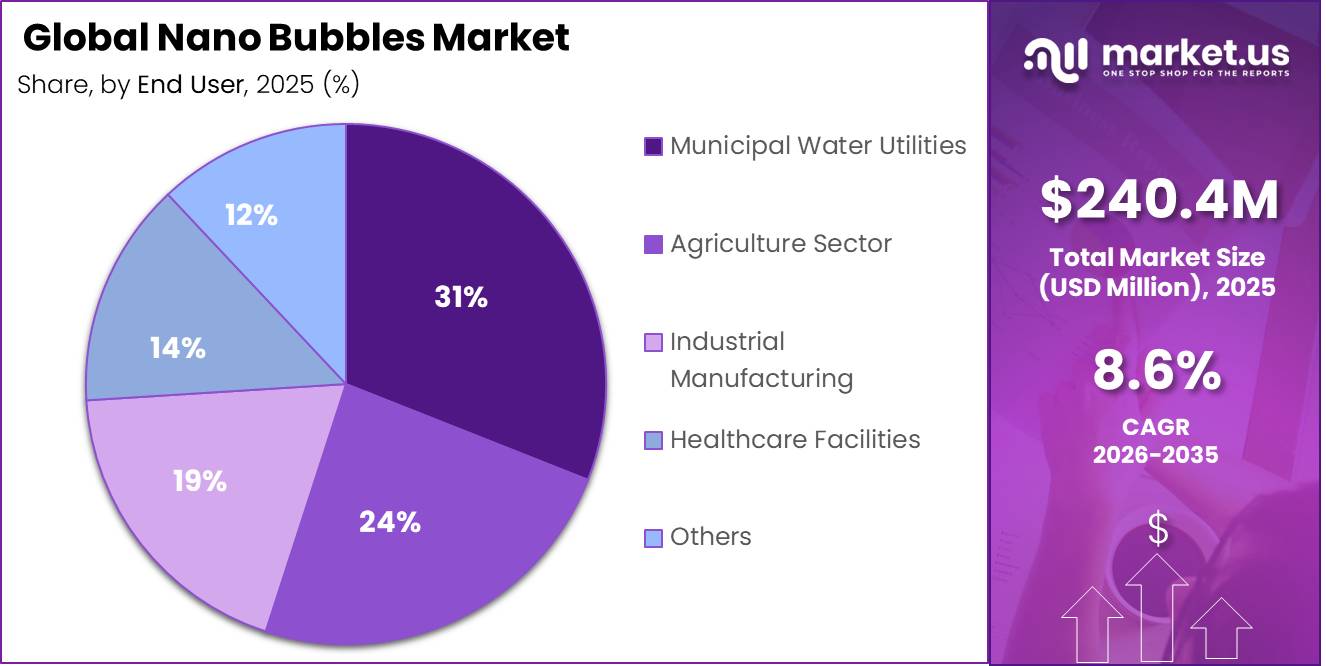
- Among end users, municipal water utilities held a major share in the nano bubbles market, accounting for 31% of the market share.
- Among bubble size types, below 100 nm represented the dominant segment, accounting for around 58% of the revenue share.
- Based on distribution channel, direct/B2B sales dominated the market, capturing approximately 76% of the total market share.
- In 2025, Asia-Pacific was the most dominant region in the nano bubbles market, accounting for 43% of the global market share.
Aquaculture provides another strong industrial pathway. In June 2024, the Food and Agriculture Organization reported record global aquaculture production of 130.9 million tonnes in 2022, including 94.4 million tonnes of aquatic animals, equal to 51% of aquatic animal production. In December 2024, the United States Department of Agriculture reported USD 1.9 billion in aquaculture sales across 3,453 farms during 2023, with farm numbers increasing 18% from 2018, supporting efficient oxygenation equipment demand worldwide.
Government investment and technical standards are widening future opportunities. In October 2024, the United States Environmental Protection Agency announced USD 6.2 billion in fiscal 2025 water-infrastructure investment for drinking water and wastewater upgrades. The International Organization for Standardization also maintains ISO 20480-1:2017 for fine-bubble terminology, with an amendment issued in 2024. These measures support equipment validation, municipal procurement, manufacturing scale-up, and applications in oxygenation, disinfection, chemical reduction, crop irrigation, and process cleaning across diverse operating environments worldwide.
Gas Type Analysis
Oxygen Nano Bubbles dominate with 39.00% due to dependable oxygen delivery across treatment operations.
In 2025, Oxygen Nano Bubbles held a dominant market position, capturing more than a 39.00% share. Their leadership was supported by use in municipal water treatment, aquaculture, irrigation, and industrial process systems. These bubbles improve gas transfer, remain suspended for longer periods, and help facilities maintain stable dissolved oxygen conditions. Their compatibility with existing circulation equipment also supports adoption across treatment plants and sites. Demand remained strong because users could improve biological activity and water quality without major infrastructure changes.
- For instance, in August 2025, a New Jersey Institute of Technology team delivered an industrial-grade ozone nanobubble system to a New Jersey farm for field testing, highlighting interest in advanced nanobubble treatment technologies.
Ozone Nano Bubbles are expected to be the fastest-growing segment. Their expansion is supported by rising demand for oxidation, disinfection, odour reduction, and algae control across food processing, healthcare, wastewater treatment, and industrial cleaning. Their ability to deliver ozone efficiently into water strengthens their value in applications requiring sanitation and reduced chemical use.
Technology Type Analysis
Hydrodynamic Cavitation dominates with 34.00% because it supports continuous, scalable nanobubble production.
In 2025, Hydrodynamic Cavitation held a dominant market position, capturing more than a 34.00% share. Its leadership was supported by practical integration into pumps, venturi devices, and recirculation systems used across water treatment, aquaculture, agriculture, and industrial processing. The technology creates nanobubbles through controlled pressure changes and fluid movement, allowing continuous operation without relying on complex electrical components inside the treatment stream. It is well suited to high-volume facilities that require steady output, flexible installation, and reliable performance under changing flow conditions.
- For instance, in October 2025, a review published in the Journal of Water Process Engineering identified hydrodynamic cavitation as the most common method for large-scale nanobubble generation because of its simple equipment, continuous operation, and lower energy use.
Ultrasonic Generation is expected to be the fastest-growing segment. Its growth is supported by precise bubble formation, compact system design, and expanding use in laboratory, medical, cleaning, and specialized water applications. Suppliers are improving transducer control and operating stability to support wider commercial adoption across demanding operating environments.
Application Type Analysis
Water Treatment dominates with 36.00% as utilities seek efficient aeration and contaminant control.
In 2025, Water Treatment held a dominant market position, capturing more than a 36.00% share. Its leadership reflected growing use in municipal wastewater, drinking-water support, industrial effluent treatment, and water-reuse systems. Nano bubbles provide a large contact surface within liquid, helping treatment operators improve oxidation, flotation, biological processing, and difficult contaminant removal. Their compact generators can be connected with tanks, pipelines, and recirculation loops, making the technology suitable for plant upgrades where available space is limited. Adoption also benefits from demand for lower chemical dependence and steadier treatment performance.
- For instance, in January 2025, the United States Department of Energy completed its environmental review for a University of Tennessee pilot demonstrating nanobubble-enhanced aeration in biological wastewater treatment.
Agriculture & Aquaculture is expected to be the fastest-growing segment. Expansion is driven by interest in root-zone management, irrigation-water conditioning, pond restoration, and controlled aquatic environments. Farmers and producers are exploring these systems to support healthier growing conditions, improve resource use, and manage water quality across intensive production facilities more consistently.
End User Analysis
Municipal Water Utilities dominate with 31.00% as cities prioritize reliable water quality management.
In 2025, Municipal Water Utilities held a dominant market position, capturing more than a 31.00% share. Their leadership reflected the need for dependable technologies that can support treatment networks, reservoirs, distribution systems, and wastewater facilities. Nano bubble equipment gives utility operators a flexible option for improving circulation, supporting treatment, and managing difficult water conditions within infrastructure. Municipal buyers value systems that can be installed in stages, monitored remotely, and adjusted according to seasonal operating requirements. These advantages strengthened adoption across public water agencies seeking measurable performance and manageable maintenance.
- For instance, in November 2025, the United States Environmental Protection Agency reported that the United States Section of the International Boundary and Water Commission had completed a nanobubble ozonation pilot project for the Tijuana River.
Agriculture Sector is expected to be the fastest-growing end-user segment. Expansion is supported by wider interest in irrigation management, soil-zone conditioning, greenhouse production, and livestock water systems. Producers are increasingly evaluating compact equipment that can improve water handling and support controlled farm operations.
Bubble Size Type Analysis
Below 100 nm dominates with 58.00% because its fine size supports stable dispersion and efficient surface interaction.
In 2025, Below 100 nm held a dominant market position, capturing more than a 58.00% share. Its leadership was supported by suitability for precision water treatment, advanced cleaning, laboratory processing, and controlled biological applications. Bubbles within this size range remain finely dispersed, create extensive liquid contact, and can move through narrow spaces where larger bubbles are less effective. Equipment makers focus on reliable size control, consistent output, and compact generation systems, helping this category gain preference across specialized installations.
- For instance, in September 2025, a peer-reviewed horticulture study described an electromagnetic nanobubble generator and noted that similar devices can produce bubbles below 100 nm, demonstrating the practical relevance of this size class in controlled cultivation systems.
The 100 to 200 nm segment is expected to grow fastest. Its expansion is linked to easier measurement, stable operating performance, and suitability for commercial systems. This size range balances fine dispersion with production consistency, supporting wider adoption in irrigation, aquaculture, industrial washing, and process-water management overall.
Distribution Channel Analysis
Direct/B2B Sales dominate with 76.00% because technical equipment usually requires consultation, customization, and installation support.
In 2025, Direct/B2B Sales held a dominant market position, capturing more than a 76.00% share. This channel remained preferred because nano bubble systems are often designed around water flow, gas input, treatment capacity, operating conditions, and site layout. Suppliers work directly with municipal utilities, farms, factories, and healthcare facilities to assess requirements before recommending generators. Direct engagement also supports equipment testing, operator training, maintenance planning, and after-sales service, helping buyers reduce installation risks and achieve dependable performance.
- For instance, in September 2025, Moleaer partnered with Xylem through a global distribution agreement to expand access to nanobubble technology for municipal and industrial wastewater treatment plants worldwide.
Online Industrial Platforms are expected to be the fastest-growing distribution channel. Their growth is supported by easier product comparison, wider supplier visibility, faster quotation requests, and convenient access to compact or standardized equipment. As technical specifications become clearer online, smaller businesses and independent operators can evaluate systems, contact vendors, and begin procurement without relying entirely on distributor networks for projects.
Key Market Segments
Gas Type
- Oxygen Nano Bubbles
- Air Nano Bubbles
- Ozone Nano Bubbles
- Nitrogen & Others
Technology Type
- Hydrodynamic Cavitation
- Pressurized Dissolution
- Electrolysis
- Ultrasonic Generation
By Application
- Water Treatment
- Agriculture & Aquaculture
- Healthcare & Life Sciences
- Food & Beverage Processing
- Industrial Cleaning
By End-User
- Municipal Water Utilities
- Agriculture Sector
- Industrial Manufacturing
- Healthcare Facilities
- Others
Bubble Size Type
- Below 100 nm
- 100–200 nm
- Above 200 nm
By Distribution Channel
- Direct/B2B Sales
- Equipment Distributors
- Online Industrial Platforms
Driver Analysis
PFAS and advanced water treatment retrofit demand
EPA’s PFAS drinking-water framework has materially strengthened the commercial case for high-efficiency gas-transfer and oxidation-support technologies in municipal and industrial treatment trains because utilities must complete initial PFAS monitoring by 2027 and implement solutions by 2029 when exceedances occur, while enforceable limits remain as low as 4 ppt for PFOA and PFOS. The same U.S. policy stack includes $1 billion of implementation funding for PFAS testing and treatment, which lowers retrofit friction and supports pilot-to-procurement conversion in treatment plants that are already evaluating ozone, flotation, oxidation, and polishing combinations.
Nanobubbles do not solve PFAS removal alone, but they improve dissolved gas transfer, oxidant utilization, and contact efficiency inside broader advanced-treatment architectures, which raises their attach rate in skids sold into remediation, tertiary treatment, and industrial reuse lines. This driver therefore adds a relatively high 2.2 percentage points to market CAGR because compliance deadlines are specific, capital budgets are increasingly earmarked, and buying decisions are moving from demonstration logic to regulated necessity, especially across U.S. utilities, semiconductor water systems, landfill leachate treatment, and contaminated industrial sites.
Drivers Impact Analysis
| Driver | (~) % Impact on CAGR | Geographic Relevance | Impact Timeline |
|---|---|---|---|
| PFAS and advanced water treatment retrofit demand | +2.2% | North America core, EU, developed APAC utilities | Medium term (2-4 years) |
| Aquaculture oxygen-efficiency and survival-rate optimization | +1.9% | APAC core, Nordic aquaculture, North America | Short term (≤ 2 years) |
| Irrigation efficiency and root-zone oxygenation in water-stressed farming | +1.6% | U.S. West, Southern Europe, Israel, Australia, India spill-over | Medium term (2-4 years) |
| EU wastewater directive tightening and micropollutant treatment upgrades | +1.4% | EU core, UK spill-over, accession markets | Medium term (2-4 years) |
| Ozone- and oxygen-based chemical-light treatment economics | +1.3% | Industrial wastewater hubs in North America, EU, East Asia | Short term (≤ 2 years) |
| Equipment modularization and generator performance scaling | +1.1% | Global, strongest in APAC manufacturing corridors and North America | Long term (≥ 4 years) |
Restraint Analysis
High capex and energy operating cost
The first major restraint is the combination of upfront capital intensity and ongoing energy cost for nanobubble systems, which compresses margins and delays capacity additions, especially in energy-sensitive regions like Europe where industrial electricity prices averaged about 16.8 euro cents per kilowatt-hour for companies without special reductions in 2024, and about 10.5 euro cents per kilowatt-hour for firms eligible for tariff and surcharge relief.
As a result, many operators postpone projects or downscale system sizes to fit annual capex envelopes, pulling down the market’s forward CAGR by an estimated 2.3 percentage points as only high-value segments with strong internal rate of return (e.g., premium aquaculture or high-margin industrial reuse) can absorb full equipment and energy costs on a four-to-seven-year horizon.
Restraint Impact Analysis
| Restraint | (~) % Impact on CAGR Forecast | Geographic Relevance | Impact Timeline |
|---|---|---|---|
| High capex and energy operating cost | -2.3% | EU core, North America, industrial APAC | Medium term (2-4 years) |
| Technology validation and performance variability | -2.0% | Global, strongest in emerging APAC and Latin America | Short term (≤ 2 years) |
| Lack of standards and regulatory recognition | -1.8% | Global, strongest in EU and North America utilities | Long term (≥ 4 years) |
| Skilled integration and O&M resource gap | -1.5% | APAC corridors, Africa, Latin America, India | Medium term (2-4 years) |
| Financing and payback uncertainty in end-use sectors | -1.4% | North America, EU, APAC agriculture and aquaculture | Short term (≤ 2 years) |
| Supply chain and control-system complexity | -1.2% | Global manufacturing hubs, APAC and EU | Medium term (2-4 years) |
Opportunity Analysis
Drip fertigation and climate-resilient irrigation platforms
A second white space lies in transforming nanobubbles from a niche irrigation add-on into an integrated drip fertigation and climate-resilient irrigation platform targeted at water-stressed regions and greenhouse agriculture, leveraging evidence that micro/nanobubble-assisted irrigation can reduce nitrogen leaching by up to 85 percent in sandy soils and allow 20 percent reductions in irrigation and fertilization without yield loss, while improving irrigation water-use efficiency by more than 70 percent and nitrogen partial productivity by over 30 percent in tested greenhouse crops.
Because this model extends beyond hardware sales into multi-year agronomy and service contracts, it can raise per-hectare revenue and long-term retention, adding an estimated 2.2 percentage points of CAGR upside above baseline growth driven by existing aquaculture and generic irrigation demand.
Opportunity Impact Analysis
| Opportunity | (~) % Potential CAGR Upside | Geographic Relevance | Execution Window |
|---|---|---|---|
| Performance-based ESG and decarbonization contracts | +2.4% | North America core, EU, East Asia | Medium term (2-4 years) |
| Drip fertigation and climate-resilient irrigation platforms | +2.2% | APAC emerging, India, Middle East, Latin America | Medium term (2-4 years) |
| Industrial reuse water and circular-processing as-a-service | +2.0% | EU, North America, China, Gulf industrial corridors | Long term (≥ 4 years) |
| Bioenergy and carbon-mitigation nanobubble integration | +1.8% | EU, UK, North America, selective APAC | Long term (≥ 4 years) |
| Embedded nanobubble modules for OEM bundling | +1.6% | Global OEM hubs in APAC, EU, North America | Short term (≤ 2 years) |
| Data-layer monetization and remote optimization services | +1.5% | Global, strongest in advanced digital adopters | Medium term (2-4 years) |
Challenges Analysis
Logistics, service, and lifecycle complexity
For complex systems involving pumps, injectors, sensors, and controls, this can translate into average spare-part lead times of 15–45 days and periodic service delays that raise downtime risk relative to simpler aeration technologies with local support, compelling operators to carry more on-site spares and invest in local training to mitigate multi-day outages that directly impact fish survival, crop health, or treatment compliance.
Lifecycle complexity also arises from the need to periodically recalibrate systems, replace wear components, and update firmware and control logic in line with evolving process conditions, demanding structured maintenance regimes and monitoring across hundreds of small sites rather than a few central plants; this adds 3–7 percent to annual operating costs and ties up working capital in spare inventories and service contracts.
Over time, industry efforts to build regional service networks, standardized component kits, and remote diagnostics will reduce this friction, but in the 2026–2030 window logistics and lifecycle challenges still impose about a 1.0 percentage point drag on potential CAGR, slowing the speed and breadth of deployments in frontier regions that are otherwise highly suitable from an application standpoint.
Challenges Impact Analysis
| Challenge | (~) % CAGR Friction Drag | Geographic Relevance | Mitigation Horizon |
|---|---|---|---|
| Complex flow and scaling physics | -1.6% | Global plants, APAC corridors, EU utilities | Long term (≥ 4 years) |
| Fragmented OEM and integrator ecosystem | -1.4% | APAC manufacturing hubs, North America, EU | Medium term (2-4 years) |
| Limited cross-sector application know-how | -1.3% | Global, strongest in emerging markets | Medium term (2-4 years) |
| Talent and R&D bandwidth constraints | -1.2% | EU research hubs, North America, Japan, India | Long term (≥ 4 years) |
| Data, control, and interoperability gaps | -1.1% | Industrial and utility corridors worldwide | Medium term (2-4 years) |
| Logistics, service, and lifecycle complexity | -1.0% | APAC logistics axes, Latin America, Africa | Medium term (2-4 years) |
Geopolitical Impact Analysis
Rising Water Security Concerns and Environmental Regulations Reshaping the Global Nano Bubbles Market.
The current trends in geopolitics and the environment are having an impact on the nano bubbles market due to increasing capital being directed into facilities for treating and recycling wastewater and implementing more sustainable practices in industries in developed nations. The worldwide need to address issues such as freshwater shortages, industrial contamination, and climate-induced water stress is leading to greater adoption of oxygenation and purification technologies. Due to the close connection between nano bubble technology and wastewater treatment, aquaculture, and sustainable farming, environmental infrastructure and industrial chain disruptions affect market growth.
With growing regulations on the release of industrial wastewater, there is an increased need for water treatment technology that helps meet regulatory compliance. Various governments have introduced policies related to water reuse, pollution prevention, and sustainability in order to push industries to use more efficient treatment technologies.
- According to the United Nations Water Programme, increasing global water stress and climate-related resource challenges are accelerating investments in sustainable water management and treatment infrastructure worldwide.
Geopolitical focus on food security boosts nano bubble technology in aquaculture and precision irrigation, with countries investing in water-efficient agriculture to enhance productivity and reduce resource use.
- The Food and Agriculture Organization (FAO) continues to promote sustainable agriculture and efficient water management technologies to strengthen long-term food security and agricultural resilience globally.
Regional expansion of advanced environmental technology and smart water infrastructure is growing in Asia-Pacific, North America, and Europe, but challenges include rising costs, regulatory uncertainty, and equipment dependence.
Regional Analysis
Asia Pacific Held the Largest Share of the Global Nano Bubbles Market.
In 2025, Asia-Pacific held a dominant market position, capturing more than a 43% share of the global nano bubbles market. This dominance is due to increased investments in the construction of wastewater treatment plants and growth in industrial production processes. Other factors that are responsible for driving the market growth in the region include rising use of sustainable agriculture and aquaculture technology.
The use of nano bubbles technology is increasingly gaining prevalence in Japan and South Korea owing to their advanced technological capabilities and greater emphasis on environmentally sustainable methods of resource treatment. China is also ramping up its efforts to recycle water and improve sustainability in industries as a response to growing environmental pressures.
Key Regions and Countries Covered
- North America
- The US
- Canada
- Europe
- Germany
- France
- The UK
- Spain
- Italy
- Russia & CIS
- Rest of Europe
- APAC
- China
- Japan
- South Korea
- India
- ASEAN
- Rest of APAC
- Latin America
- Brazil
- Mexico
- Rest of Latin America
- Middle East & Africa
- GCC
- South Africa
- Rest of MEA
Key Players Analysis
The global nano bubbles market remains moderately fragmented, with several international and regional companies competing through technology performance, equipment efficiency, application expertise, and service support. Competition is increasingly focused on innovation, strategic partnerships, and the expansion of nano bubble systems across water treatment, agriculture, aquaculture, industrial processing, and environmental applications.
Companies such as Moleaer Inc., Xylem Inc., Acniti LLC, Mazzei Injector Company, and Nikkiso Co., Ltd. are strengthening their market presence through advanced bubble-generation equipment, oxygenation systems, gas-injection technologies, and customized treatment solutions. These companies are also improving system reliability, operational efficiency, and integration with existing water infrastructure to meet the requirements of municipal, agricultural, and industrial customers.
Strategic collaboration between technology suppliers, water utilities, manufacturing companies, agricultural operators, and aquaculture producers is supporting wider commercial adoption. Companies are also expanding distribution networks, improving technical services, and developing application-specific equipment. These strategies help market participants enter new regions, build long-term customer relationships, and strengthen their competitive position.
Market Key Players
- Moleaer Inc.
- AquaPro Solutions
- Nano Gas Technologies
- Acniti LLC
- Agrona B.V.
- Kakuda Bubble Inc.
- Evoqua Water Technologies
- Xylem Inc.
- Hitachi Zosen Corporation
- Nikkiso Co., Ltd.
- Mazzei Injector Company
- Membrana GmbH
- Fine Bubble Industries Association
- Nano Bubble Technologies Pty Ltd
- Airdrive Technologies
Key Development
- In June 2026, Xylem Inc. collaborated with Moleaer Inc. to provide chemical-free nanobubble treatment for lakes, reservoirs and other surface-water bodies. Xylem will combine its YSI water-quality monitoring expertise with Moleaer’s nanobubble systems to address algal blooms, low dissolved oxygen and nutrient pollution.
- In May 2026, Moleaer Inc. was selected for Cohort 7 of the 100+ Accelerator, supported by companies including AB InBev, Coca-Cola, Danone, Colgate-Palmolive, Mondelēz and Unilever. The program will help Moleaer test and expand its nanobubble technology across global manufacturing and wastewater-treatment operations.
- In July 2026, Mazzei Injector Company participated in a new Pinnacle Academy technical episode focused on ozone injection and gas-to-liquid mass transfer. The session presented Mazzei’s injector and mixing technologies for improving ozone delivery efficiency in industrial water-treatment applications.
Report Scope
| Report Features | Description |
|---|---|
| Market Value (2025) | USD 240.4 Mn |
| Forecast Revenue (2035) | USD 545.8 Mn |
| CAGR (2026-2035) | 8.6% |
| Base Year for Estimation | 2025 |
| Historic Period | 2020-2024 |
| Forecast Period | 2026-2035 |
| Report Coverage | Revenue Forecast, Market Dynamics, Competitive Landscape, Recent Developments |
| Segments Covered | By Gas Type (Oxygen Nano Bubbles, Air Nano Bubbles, Ozone Nano Bubbles, Nitrogen & Others), By Technology Type (Hydrodynamic Cavitation, Pressurized Dissolution, Electrolysis, and Ultrasonic Generation), By Application (Water Treatment, Agriculture & Aquaculture, Healthcare & Life Sciences, Food & Beverage Processing, and Industrial Cleaning), By End User (Municipal Water Utilities, Agriculture Sector, Industrial Manufacturing, Healthcare Facilities, and Others), By Bubble Size Type (Below 100 nm, 100–200 nm, and Above 200 nm), By Distribution Channel (Direct/B2B Sales, Equipment Distributors, and Online Industrial Platforms) |
| Regional Analysis | North America – The US & Canada; Europe – Germany, France, The UK, Spain, Italy, Russia & CIS, Rest of Europe; APAC– China, Japan, South Korea, India, ASEAN & Rest of APAC; Latin America– Brazil, Mexico & Rest of Latin America; Middle East & Africa– GCC, South Africa, & Rest of MEA |
| Competitive Landscape | Moleaer Inc., AquaPro Solutions, Nano Gas Technologies, Acniti LLC, Agrona B.V., Kakuda Bubble Inc., Evoqua Water Technologies, Xylem Inc., Hitachi Zosen Corporation, Nikkiso Co., Ltd., Mazzei Injector Company, Membrana GmbH, Fine Bubble Industries Association, Nano Bubble Technologies Pty Ltd, Airdrive Technologies |
| Customization Scope | Customization for segments, region/country-level will be provided. Moreover, additional customization can be done based on the requirements. |
| Purchase Options | We have three licenses to opt for: Single User License, Multi-User License (Up to 5 Users), Corporate Use License (Unlimited Users and Printable PDF) |





































