


Market Overview
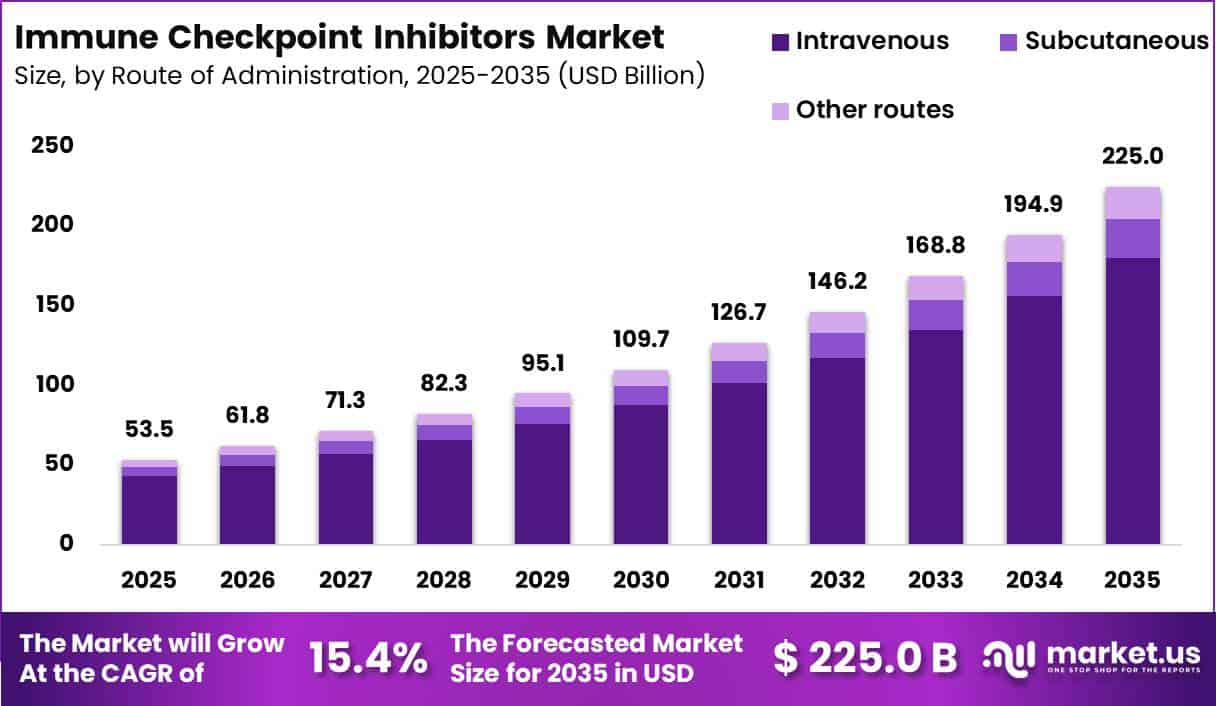
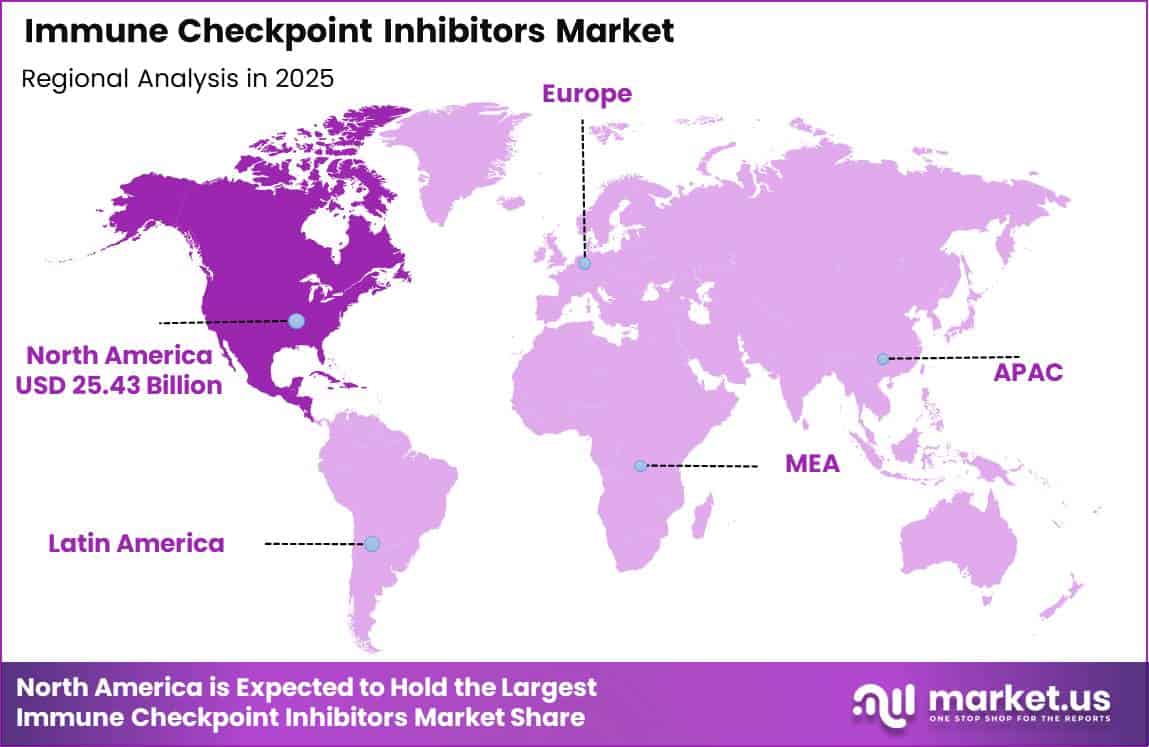
Global Immune Checkpoint Inhibitors Market size is expected to be worth around US$ 225.0 Billion by 2035 from US$ 53.5 Billion in 2025, growing at a CAGR of 15.4% during the forecast period from 2026 to 2035. In 2025, North America led the market, achieving over 47.5% share with a revenue of US$ 25.43 Billion.
The global Immune Checkpoint Inhibitors (ICI) market is expanding as immunotherapy becomes a key pillar of modern cancer treatment. Unlike conventional therapies, immune checkpoint inhibitors work by blocking proteins such as PD-1, PD-L1, and CTLA-4, enabling the immune system to recognize and destroy cancer cells more effectively.
The U.S. National Cancer Institute (NCI) notes that these therapies are now approved for a wide range of cancers, including melanoma, non-small cell lung cancer, kidney, bladder, liver, cervical, colorectal, gastric, breast, and head and neck cancers, with research continuing to broaden their clinical use.
The growing global cancer burden is a major factor supporting demand for these therapies. According to the World Health Organization (WHO), approximately 20 million new cancer cases and 9.7 million cancer deaths occurred worldwide in 2022, while an estimated 53.5 million people were living within five years of a cancer diagnosis. This increasing patient population is driving greater adoption of innovative immunotherapies across healthcare systems.
Clinical and regulatory progress is also accelerating market growth. The U.S. Food and Drug Administration (FDA) continues to approve new oncology indications and breakthrough therapies, expanding the availability of immune checkpoint inhibitors across multiple tumor types. FDA approval reports highlight sustained activity in biologics and oncology drug development, reflecting strong innovation in this therapeutic area.
Research further demonstrates the expanding clinical impact of ICIs. A 2025 peer-reviewed analysis published in the International Journal of Cancer estimated that the proportion of U.S. patients with advanced or metastatic cancers eligible for immune checkpoint inhibitors increased to 56.55% by 2023, while the estimated response rate reached 20.13%, reflecting the rapid expansion of approved indications over the past decade.
The long-term outlook remains positive as pharmaceutical companies, academic institutions, and government-supported research organizations continue to invest in combination immunotherapies, biomarker-driven patient selection, and next-generation checkpoint targets to improve treatment outcomes across a broader range of cancers.
Key Takeaways
- Market Size : Immune Checkpoint Inhibitors Market size is expected to be worth around US$ 225.0 Billion by 2035 from US$ 53.5 Billion in 2025.
- Market Share : The market is growing at a CAGR of 15.4% during the forecast period from 2026 to 2035.
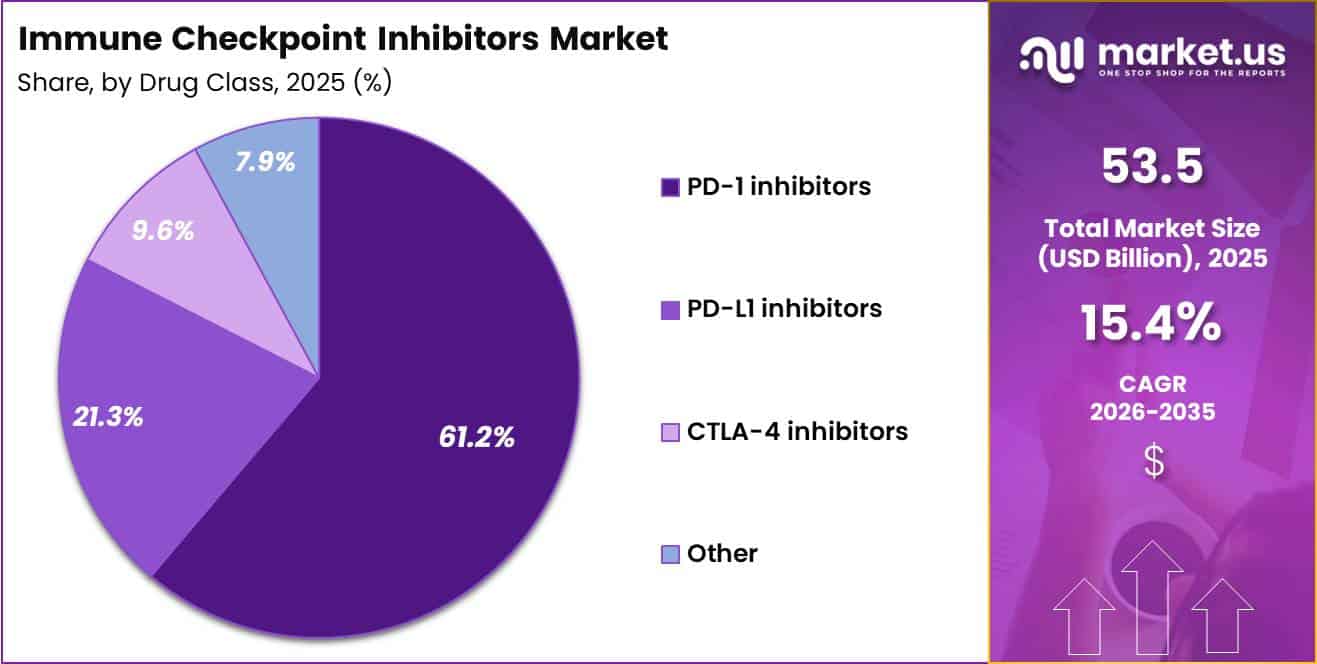
- Drug Class Analysis : The PD-1 inhibitors segment dominated the Immune Checkpoint Inhibitors market with 61.2% of the market share in 2025.
- Cancer Type Analysis : The Lung Cancer (NSCLC/SCLC) segment held the largest share of the Immune Checkpoint Inhibitors market at 32.2% in 2025.
- Route of Administration Analysis : The Intravenous segment dominated the Immune Checkpoint Inhibitors market with 80.1% of the market share in 2025.
- End-user Analysis : The Hospitals and hospital pharmacies segment accounted for the largest 57.3% market share in 2025.
- Regional Analysis : In 2025, North America led the market, achieving over 47.5% share with a revenue of US$ 25.43 Billion.
Drug Class Analysis
The PD-1 inhibitors segment dominated the Immune Checkpoint Inhibitors market with 61.2% of the market share in 2025.
This leadership is supported by the broad clinical use of PD-1 inhibitors such as pembrolizumab, nivolumab, cemiplimab, dostarlimab, and tislelizumab across multiple cancers, including lung cancer, melanoma, renal cell carcinoma, head and neck cancer, and several hematologic malignancies.
Their ability to produce durable clinical responses, extensive regulatory approvals, and strong physician confidence has made PD-1 inhibitors the preferred treatment option in many first-line and combination therapy settings. Continuous expansion into earlier-stage disease and biomarker-guided treatment further strengthens this segment.
The PD-L1 inhibitors segment accounted for 21.3% of the market in 2025, supported by products such as atezolizumab, durvalumab, and avelumab, particularly in lung cancer, bladder cancer, and hepatobiliary tumors.
CTLA-4 inhibitors represented 9.6% of the market, driven mainly by their use in combination regimens that enhance immune responses despite a higher incidence of immune-related adverse events.
The Others segment, holding 7.9%, includes emerging checkpoint targets such as LAG-3 and TIGIT inhibitors that are expanding the next generation of cancer immunotherapy through ongoing clinical development.
Cancer Type Analysis
The Lung Cancer (NSCLC/SCLC) segment held the largest share of the Immune Checkpoint Inhibitors market at 32.2% in 2025.
Lung cancer remains the leading indication for checkpoint inhibitors because PD-1 and PD-L1 therapies are widely recommended as first-line or combination treatments for both advanced and early-stage disease.
Strong clinical evidence, increasing biomarker testing, and expanding treatment guidelines continue to support high adoption in this segment.
The Melanoma segment accounted for 19.2%, reflecting the long-established success of checkpoint inhibitors in improving long-term survival among advanced melanoma patients. Renal cell carcinoma represented 14.8%, driven by the growing use of combination immunotherapy and targeted therapy approaches.
Bladder cancer contributed 10.2%, supported by increasing approvals for PD-1 and PD-L1 inhibitors in advanced disease. Head and neck cancers captured 9.3%, benefiting from expanding immunotherapy use in recurrent and metastatic settings.
Hodgkin lymphoma and other hematologic malignancies accounted for 8.1%, where checkpoint inhibitors have demonstrated high response rates in selected patients. The remaining 6.2% consisted of other solid tumors, including gastric, liver, cervical, and endometrial cancers, where new approvals continue to broaden treatment opportunities.
Route of Administration Analysis
The Intravenous segment dominated the Immune Checkpoint Inhibitors market with 80.1% of the market share in 2025. Most approved checkpoint inhibitors are administered intravenously because this route provides controlled drug delivery, consistent bioavailability, and dosing schedules that align with hospital-based oncology care.
Intravenous infusion also enables physicians to monitor patients closely for immune-related adverse events and manage combination therapies with chemotherapy or targeted medicines. The widespread availability of infusion centers and established treatment protocols further support the dominance of this segment.
The Subcutaneous segment is gaining momentum as pharmaceutical companies develop more convenient formulations that reduce administration time and improve patient comfort.
Recent approvals and ongoing clinical studies evaluating subcutaneous versions of checkpoint inhibitors are expected to increase adoption, particularly in outpatient settings. The Other routes segment represents a smaller share and includes investigational delivery methods that remain in early clinical development.
As healthcare providers continue to focus on improving treatment convenience without compromising clinical outcomes, alternative administration routes are expected to gradually complement traditional intravenous therapy over the coming years.
End-user Analysis
The Hospitals and hospital pharmacies segment accounted for the largest 57.3% market share in 2025. This dominance is driven by the complexity of immune checkpoint inhibitor therapy, which often requires multidisciplinary oncology teams, specialized infusion facilities, advanced diagnostic testing, and continuous monitoring for immune-related adverse events.
Hospitals also serve as the primary centers for administering combination therapies and managing patients with advanced cancers, making them the preferred treatment setting.
Specialty oncology clinics represent the second-largest segment, supported by the growing number of dedicated cancer centers offering personalized immunotherapy, biomarker testing, and long-term patient follow-up.
Academic and research centers continue to play an important role by conducting clinical trials, evaluating new checkpoint inhibitors, and expanding treatment indications through translational research.
Retail and other pharmacies and settings account for a smaller share because most checkpoint inhibitors require controlled administration under healthcare supervision rather than routine outpatient dispensing.
However, the increasing availability of subcutaneous formulations and expanded outpatient cancer services may gradually increase the role of non-hospital settings in future immunotherapy delivery.
Market Segmentations
By Drug Class
- PD‑1 inhibitors
- PD‑L1 inhibitors
- CTLA‑4 inhibitors
- Other
By Cancer type
- Lung Cancer (NSCLC/SCLC)
- Melanoma
- Renal cell carcinoma
- Bladder cancer
- Head & neck cancers
- Hodgkin lymphoma & other heme malignancies
- Other solid tumors
By Route of Administration
- Intravenous
- Subcutaneous
- Other routes
By End-user
- Hospitals & hospital pharmacies
- Specialty oncology clinics
- Academic & research centers
- Retail/other pharmacies & settings
Driver
Earlier Line Expansion of PD 1 PD L1 Regimens Driving Market Growth
Checkpoint inhibitors are no longer limited to late-line metastatic salvage settings the 2025–2026 approval landscape shows increasing integration into first-line, perioperative, and broader disease-management pathways where eligible patient populations are larger and treatment pathways are more standardized.
In 2025, FDA approvals expanded checkpoint inhibitor use across multiple indications, including nivolumab plus ipilimumab in unresectable or metastatic hepatocellular carcinoma, nivolumab plus ipilimumab in MSI-H/dMMR colorectal cancer, pembrolizumab in resectable locally advanced head and neck cancer, durvalumab in muscle-invasive bladder cancer, and pembrolizumab for HER2-positive gastric or gastroesophageal adenocarcinoma.
In 2026, additional approvals further broadened earlier-stage and combination use, including pembrolizumab combinations in ovarian cancer, nivolumab with AVD in Stage III/IV Hodgkin lymphoma, durvalumab plus BCG in high-risk NMIBC, and pembrolizumab plus enfortumab in muscle-invasive bladder cancer among broader cystectomy-eligible populations.
Strategically, this evolution shifts revenue generation away from narrowly defined refractory cohorts toward protocol-driven earlier-line treatment pathways where biomarker testing rates are higher, physician adoption is stronger, and hospital formularies are more likely to standardize treatment algorithms.
Earlier-line integration also improves treatment visibility, increases eligible patient pools, and reduces commercial uncertainty compared with historical checkpoint inhibitor launch patterns focused primarily on salvage therapy.
As PD-1/PD-L1 regimens continue moving into curative-intent, perioperative, and first-line settings, manufacturers benefit from expanded treatment duration, broader clinical adoption, and stronger institutional pathway integration, supporting sustained market growth through 2026 and beyond.
| Driver | (~) % Impact on CAGR Forecast | Geographic Relevance | Impact Timeline |
|---|---|---|---|
| Earlier-line expansion of PD-1/PD-L1 regimens | +2.4% | North America core, EU5, Japan, urban China | Medium term (2-4 years) |
| Biomarker-led precision selection and companion diagnostics | +1.8% | U.S., EU, Japan, South Korea, China tier-1 oncology centers | Short term (≤ 2 years) |
| Perioperative and adjuvant treatment-duration uplift | +1.6% | U.S., EU, Japan, Australia, Gulf tertiary centers | Medium term (2-4 years) |
| Reimbursement support and Medicare Part B payment stability | +1.3% | U.S. core, EU public systems spill-over | Short term (≤ 2 years) |
| Convenience innovation: subcutaneous and combo-ready delivery | +1.1% | U.S., EU, Japan, private APAC hospitals | Short term (≤ 2 years) |
| Global cancer burden expansion and access widening | +1.9% | APAC corridors, Latin America private sector, Middle East, Eastern Europe | Long term (≥ 4 years) |
Challenge
Immune Related Toxicity Burden Limiting Checkpoint Inhibitor Expansion
Immune-related adverse events (irAEs) from checkpoint inhibition impose a multi-layer operational burden on oncology systems and sponsors, constraining aggressive combination regimens and increasing treatment management costs while leaving core monotherapy and selected combinations viable.
Grade 3–4 irAEs occur in around 10–25% of patients receiving PD-1/PD-L1 monotherapy and can exceed 50–55% in certain doublet or triplet combination regimens involving CTLA-4 blockade or targeted agents.
These toxicities require intensive management protocols, 2–6 week treatment interruptions, high-dose corticosteroids, and in 5–10% of cases second-line immunosuppression.
As a result, per-patient management costs can increase by USD 8,000–20,000, while hospitalization risk may rise by 10–15 % points. Across high-volume oncology centers administering thousands of ICI cycles annually, irAE management can consume 15–25% of oncology ward capacity and 20–30% of physician time during peak adoption periods.
Maintaining safe treatment throughput may require an additional 10–20 full-time equivalents (FTEs) per 1,000 active patients, increasing operational pressure on already constrained oncology systems.
From a payer perspective, total episode-of-care costs can increase by 15–30% when complex irAEs occur, encouraging more cautious reimbursement approaches for multi-drug regimens and narrower treatment eligibility criteria despite the clinical benefits of checkpoint inhibitors.
Strategically, pharmaceutical companies and healthcare systems are developing standardized irAE management pathways, predictive risk models based on immune profiles, and protocol-driven dose optimization strategies aimed at reducing severe toxicity rates by 20–30% over the next 3–4 years.
However, until these approaches are validated and incorporated into clinical guidelines, toxicity-related caution is expected to create an estimated 1.1 %-point drag on maximum checkpoint inhibitor market growth trajectories.
| Challenge | (~) % CAGR Friction Drag | Geographic Relevance | Mitigation Horizon |
|---|---|---|---|
| Uneven global access | -1.3% | North America, EU, emerging APAC, LATAM | Long term (≥ 4 years) |
| Trial recruitment bottlenecks | -0.8% | Global oncology hubs, APAC sites | Medium term (2-4 years) |
| Immune-related toxicity burden | -1.1% | North America core, EU, high-volume Asia | Medium term (2-4 years) |
| Biomarker standardization gaps | -0.9% | US, EU, Japan, China | Long term (≥ 4 years) |
| Manufacturing & CMC complexity | -0.7% | Global biologics clusters | Medium term (2-4 years) |
| Pricing & HTA pressure | -1.4% | EU, UK, Canada, selected APAC | Long term (≥ 4 years) |
Restraints
Safety Signals, irAEs and Boxed Warnings Limiting Immunotherapy Expansion
Emerging safety signals, high incidence of immune-related adverse events (irAEs), and increasing use of boxed warnings and enhanced pharmacovigilance requirements for immunotherapies introduce both direct cost and indirect demand restraints.
Real-world studies consistently show irAE rates exceeding 50% among immune checkpoint inhibitor (ICI)-treated patients, with organ-specific toxicities affecting endocrine, dermatologic, hepatic, pulmonary, and cardiac systems, along with fatal events reported in the high single-digit % range in some cohorts.
At the regulatory level, recent FDA communications emphasize stronger safety oversight, including boxed warnings for serious immune-effector complications and stricter requirements for label updates when post-market evidence identifies significant risks.
These actions increase compliance obligations through intensified monitoring, additional safety programs, and more restrictive treatment eligibility criteria. These measures create economic friction by increasing the need for laboratory testing, imaging, and specialist consultations.
For high-risk ICI regimens, incorporating quarterly cardiology or pulmonology evaluations and advanced imaging can add USD 5,000–10,000 per patient annually in monitoring expenses.
Hospitals must also dedicate additional resources to intensive care and multidisciplinary management of severe irAEs, increasing total treatment costs and encouraging more conservative payer utilization controls.
Strategically, safety-driven label tightening slows adoption in borderline populations, including frail elderly patients and individuals with multiple comorbidities, while contributing to discontinuation rates above 10–15% in some treatment settings.
It also encourages oncologists to consider shorter treatment durations or exposure-reducing combination strategies, moderating overall treatment volume growth despite continued clinical benefit.
When incorporated into market forecasting, these safety challenges and regulatory requirements are estimated to reduce baseline CAGR by approximately 1.9 % points, primarily through lower treatment intensity, narrower eligible patient populations in high-risk cancers, and increased non-drug care costs that limit payer expansion at previous growth rates.
| Restraint | (~) % Impact on CAGR Forecast | Geographic Relevance | Impact Timeline |
|---|---|---|---|
| Escalating trial and development costs | -2.3% | North America, EU, Japan, Tier-1 APAC | Long term (≥ 4 years) |
| Pricing controls and Medicare/NPPA interventions | -2.0% | U.S., EU, India | Medium term (2-4 years) |
| Safety signals, irAEs and boxed warnings | -1.9% | North America, EU, East Asia | Medium term (2-4 years) |
| Access and reimbursement barriers in emerging markets | -1.7% | Latin America, MENA, Tier-2/3 APAC | Long term (≥ 4 years) |
| Manufacturing, biologics supply and capacity constraints | -1.5% | Global, with NA/EU biologics hubs | Short–Medium term (≤ 4 years) |
| Clinical and regulatory complexity for new checkpoints | -1.4% | North America, EU, China | Long term (≥ 4 years) |
Opportunity
Tumor Agnostic Biomarker Driven Micro Indications Creating Growth Opportunities
Despite progress on tissue-agnostic approvals for selected biomarkers, the commercialization of tumor-agnostic, biomarker-driven micro-indications remains far from fully exploited, particularly for rare mutations and immune signatures across diverse tumor types where current ICI use remains sporadic.
Rising global cancer incidence across multiple anatomical sites continues to expand the potential patient pool, yet treatment labels and clinical protocols often lag behind advances in molecular stratification, leaving small but collectively meaningful patient segments without systematic access to immune checkpoint inhibitor therapy despite strong biological rationale.
By 2030–2035, deeper integration of high-throughput sequencing, multiplex immunohistochemistry, and standardized biomarker panels into oncology workflows could enable identification of micro-cohorts representing 5–10% of total cancer incidence whose tumors demonstrate specific immune checkpoint-related vulnerabilities.
These populations could support development and reimbursement of targeted ICI regimens on a tumor-agnostic basis. If pharmaceutical manufacturers and diagnostic companies jointly establish registries and evidence frameworks supporting 20–30 such micro-indications globally.
The cumulative incremental revenue opportunity could represent a mid-single-digit share of the broader ICI market, contributing approximately 1.2 % points of CAGR upside beyond baseline forecasts by converting clinically plausible but currently unstructured treatment opportunities into defined commercial pathways.
Operational success depends on reducing per-patient diagnostic costs through panel-based testing and improving payer confidence through real-world outcome evidence.
Achieving 15–25% reductions in biomarker testing costs and 10–15% improvements in non-responder identification could make these micro-indications economically sustainable while maintaining premium pricing for precision-guided immune checkpoint therapies.
| Opportunity | (~) % Potential CAGR Upside | Geographic Relevance | Execution Window |
|---|---|---|---|
| Value-based ICI contracting & outcomes networks | +1.5% | North America, EU, Japan core | Short term (≤ 2 years) |
| Emerging-market access platforms & tiered pricing | +1.8% | APAC emerging, LATAM, MENA, Africa | Medium term (2-4 years) |
| Next-gen multi-checkpoint & bispecific combos | +2.0% | North America, EU, APAC tier-1 | Medium term (2-4 years) |
| Toxicity management ecosystems & insurance-linked services | +0.8% | North America, EU | Short–Medium term (≤ 4 years) |
| Tumor-agnostic, biomarker-driven micro-indications | +1.2% | North America, EU, China | Long term (≥ 4 years) |
| AI-enabled adaptive trial & label expansion platforms | +1.0% | Global (R&D-intensive markets) | Medium–Long term (2-5+ years) |
Regional Analysis
In 2025, North America held the leading position in the global immune checkpoint inhibitors market, accounting for over 47.5% of total revenue. The region benefits from a high cancer burden, rapid adoption of immunotherapy, strong reimbursement coverage, and continuous approvals from the U.S. Food and Drug Administration (FDA).
The United States remains the primary contributor due to its advanced oncology infrastructure, extensive clinical trial activity, and presence of leading immuno-oncology companies.
According to the National Cancer Institute (NCI), immune checkpoint inhibitors are approved for numerous cancers, including melanoma, lung, kidney, bladder, liver, and colorectal cancers, with additional indications continuing to expand through ongoing research.
Europe represents the second-largest regional market, supported by broad access to innovative cancer therapies through public healthcare systems and approvals from the European Medicines Agency (EMA).
Countries including Germany, France, the UK, Italy, and Spain continue to expand immunotherapy use through clinical research and precision oncology initiatives. Recent studies also show Europe has one of the highest numbers of approved immune checkpoint inhibitor indications after the United States.
Asia-Pacific is expected to witness the fastest growth during the forecast period. Rising cancer incidence, expanding healthcare investments, increasing regulatory approvals, and strong domestic drug development in China, Japan, South Korea, and India are driving market expansion.
China has rapidly increased approvals of locally developed checkpoint inhibitors, improving patient access across the region.
Latin America and the Middle East & Africa are emerging markets with growing adoption of immunotherapy. Improvements in cancer diagnosis, healthcare infrastructure, and government-led oncology programs are gradually increasing access to immune checkpoint inhibitors, although high treatment costs and reimbursement limitations continue to restrain broader market penetration.
Key Regions and Countries
North America
- The US
- Canada
Europe
- Germany
- France
- The U.K.
- Italy
- Spain
- Russia & CIS
- Rest of Europe
Asia Pacific
- China
- India
- Japan
- South Korea
- ASEAN
- Australia & New Zealand
- Rest of Asia Pacific
Middle East & Africa
- GCC
- South Africa
- Rest of Middle East & Africa
Latin America
- Brazil
- Mexico
- Rest of Latin America
Key Player Analysis
The Immune Checkpoint Inhibitors market is highly competitive, with leading pharmaceutical companies focusing on expanding approved indications, improving combination therapies, and developing next-generation immuno-oncology products.
Merck & Co., Inc. remains a market leader through KEYTRUDA (pembrolizumab), which continues to receive new regulatory approvals across multiple cancer types.
Bristol Myers Squibb Company maintains a strong position with OPDIVO (nivolumab), YERVOY (ipilimumab), and the LAG-3 inhibitor Opdualag, while continuing to strengthen its oncology pipeline through extensive clinical research.
F. Hoffmann-La Roche Ltd. advances the market with TECENTRIQ (atezolizumab), and AstraZeneca plc continues to expand the use of IMFINZI (durvalumab) in lung and other solid tumors.
Other major companies are increasing investments in immuno-oncology through research collaborations and pipeline expansion. Novartis AG is advancing combination immunotherapy and precision oncology programs, while GlaxoSmithKline plc (GSK) is strengthening its oncology pipeline with innovative immunotherapies.
Sanofi and Regeneron Pharmaceuticals Inc. continue to expand the global reach of LIBTAYO (cemiplimab) across multiple cancer indications. Pfizer Inc. is investing in biologics, bispecific antibodies, and antibody-drug conjugates that complement checkpoint inhibitor strategies, while Eli Lilly and Company is growing its oncology portfolio through targeted acquisitions and clinical development.
These companies are driving market growth through continuous innovation, regulatory approvals, and global clinical trials.
Top Key Players
- Merck & Co. Inc.
- Bristol Myers Squibb Company
- F. Hoffmann‑La Roche Ltd.
- AstraZeneca plc
- Novartis AG
- GlaxoSmithKline plc (GSK)
- Sanofi
- Regeneron Pharmaceuticals Inc.
- Pfizer Inc.
- Eli Lilly and Company
- BeiGene Ltd.
- Immutep Ltd.
- ImmunOs Therapeutics AG
- Agenus Inc.
- Seagen Inc
- Others
Recent Developments
- In June 2026, Merck & Co., Inc. received U.S. FDA approval for KEYTRUDA (pembrolizumab) in combination with Trodelvy for the first-line treatment of PD-L1-positive advanced triple-negative breast cancer, expanding the approved use of its PD-1 checkpoint inhibitor in breast cancer.
- In March 2025, BeiGene Ltd. (now BeOne Medicines) received U.S. FDA approval for TEVIMBRA (tislelizumab) with platinum- and fluoropyrimidine-containing chemotherapy for the first-line treatment of unresectable or metastatic esophageal squamous cell carcinoma, expanding the company’s global PD-1 inhibitor portfolio.
- In 2025, Immutep Ltd. continued the global Phase III TACTI-004 trial evaluating eftilagimod alpha (efti) in combination with Merck’s KEYTRUDA as first-line therapy for recurrent or metastatic head and neck squamous cell carcinoma, further expanding checkpoint inhibitor combination strategies.
Report Scope
| Report Features | Description |
|---|---|
| Market Value (2025) | US$ 53.5 Billion |
| Forecast Revenue (2035) | US$ 225.0 Billion |
| CAGR (2026-2035) | 15.4% |
| Base Year for Estimation | 2025 |
| Historic Period | 2020-2024 |
| Forecast Period | 2026-2035 |
| Report Coverage | Revenue Forecast, Market Dynamics, Competitive Landscape, Recent Developments |
| Segments Covered | By Drug Class (PD‑1 inhibitors, PD‑L1 inhibitors, CTLA‑4 inhibitors, Other) , By Cancer type (Lung Cancer (NSCLC/SCLC), Melanoma, Renal cell carcinoma, Bladder cancer, Head & neck cancers, Hodgkin lymphoma & other heme malignancies, Other solid tumors), By Route of Administration (Intravenous, Subcutaneous, Other routes), By End-user (Hospitals & hospital pharmacies, Specialty oncology clinics, Academic & research centers, Retail/other pharmacies & settings) |
| Regional Analysis | North America – The US, Canada; Europe – Germany, France, U.K., Italy, Spain, Russia & CIS, Rest of Europe; Asia Pacific – China, India, Japan, South Korea, ASEAN, Australia & New Zealand, Rest of Asia Pacific; Middle East & Africa – GCC, South Africa, Rest of Middle East & Africa; Latin America – Brazil, Mexico, Rest of Latin America |
| Competitive Landscape | Merck & Co. Inc. , Bristol Myers Squibb Company , F. Hoffmann‑La Roche Ltd., AstraZeneca plc , Novartis AG, GlaxoSmithKline plc (GSK), Sanofi, Regeneron Pharmaceuticals Inc., Pfizer Inc. , Eli Lilly and Company, BeiGene Ltd. , Immutep Ltd., ImmunOs Therapeutics AG, Agenus Inc., Seagen Inc, Others |
| Customization Scope | Customization for segments, region/country-level will be provided. Moreover, additional customization can be done based on the requirements. |
| Purchase Options | We have three licenses to opt for: Single User License, Multi-User License (Up to 5 Users), Corporate Use License (Unlimited User and Printable PDF) |








