Report Overview
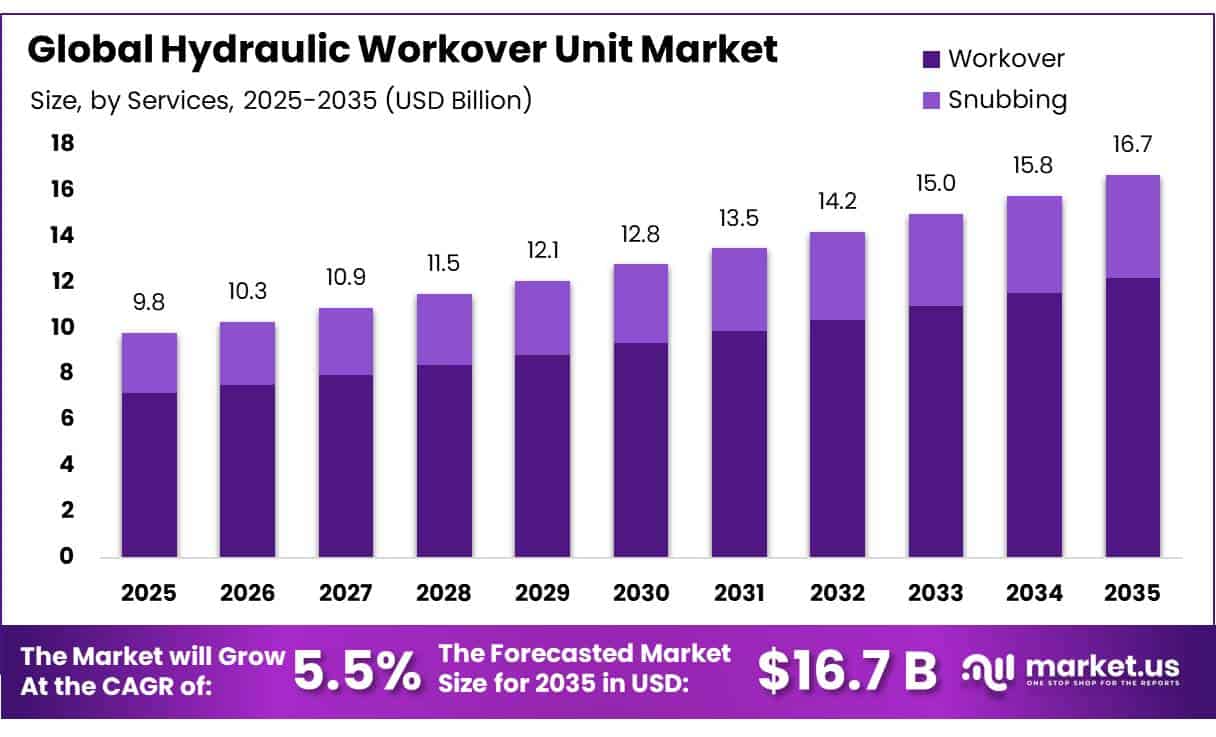
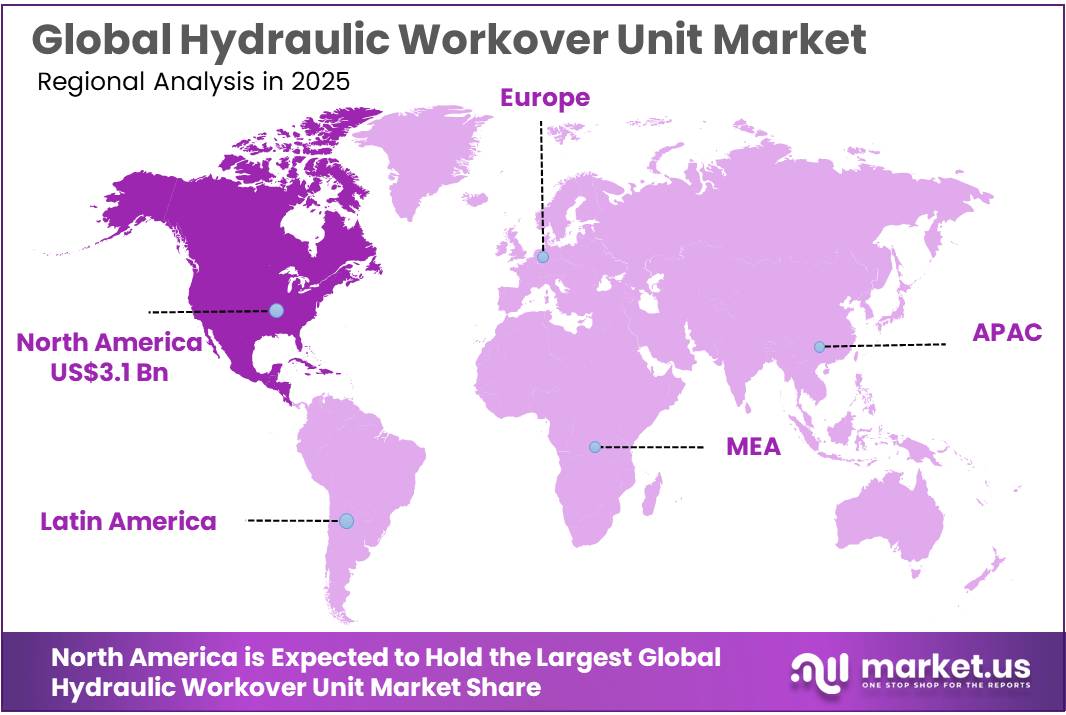
The Global Hydraulic Workover Unit Market size is expected to be worth around USD 16.7 Billion by 2035, from USD 9.8 Billion in 2025, growing at a CAGR of 5.5% during the forecast period from 2026 to 2035. In 2025, North America held a dominant market position, capturing more than a 32.11% share, holding USD 3.1 Billion revenue.
Hydraulic Workover Units (HWUs) are specialized oilfield equipment used to perform well intervention, maintenance, repair, and workover operations without relying entirely on conventional drilling rigs. These units use hydraulic power to move tubing, drill pipes, and other downhole equipment into and out of wells. Their ability to perform operations under pressure makes them valuable in mature oilfields, deep wells, and challenging offshore environments.
- The industrial scenario is closely linked to the need to maintain and restore production from existing oil and gas wells. According to the U.S. Occupational Safety and Health Administration (OSHA), workover operations include remedial activities such as sand removal, casing repair, well recompletion, sidetracking, and plug-back operations.
Technological development is strengthening the adoption of hydraulic workover units across onshore and offshore operations. Modern systems increasingly incorporate automated pipe handling, digital monitoring, hydraulic pressure controls, real-time well data, and improved blowout prevention equipment. These technologies help reduce manual intervention, improve operational accuracy, and minimize downtime. The American Petroleum Institute (API) maintains more than 700 industry standards, covering drilling, well servicing, equipment integrity, and operational safety.
- Future opportunities are emerging from offshore well intervention, deepwater operations, and the redevelopment of aging oil and gas fields. Offshore operators require specialized workover equipment capable of operating within strict space, weight, and safety limitations. The International Organization for Standardization (ISO) introduced ISO 23414:2026, addressing offshore workover rig design, fabrication, commissioning, installation, maintenance, and inspection.
Safety compliance remains central to market development. The Oil Industry Safety Directorate (OISD) provides operational guidelines covering well control, workover and well stimulation, rig inspection, and safe rig-up and rig-down practices. Its OISD-GDN-182 specifically addresses safe practices for workover and well stimulation operations. These frameworks encourage operators to invest in reliable equipment, skilled personnel, and improved well-control technologies.
Key Takeaways
- Hydraulic Workover Unit Market size is expected to be worth around USD 16.7 Billion by 2035, from USD 9.8 Billion in 2025, growing at a CAGR of 5.5%.
- Workover held a dominant market position, capturing more than a 73.00% share.
- Skid-Mounted held a dominant market position, capturing more than a 58.34% share.
- 151–200 Tonnes held a dominant market position, capturing more than a 61.22% share.
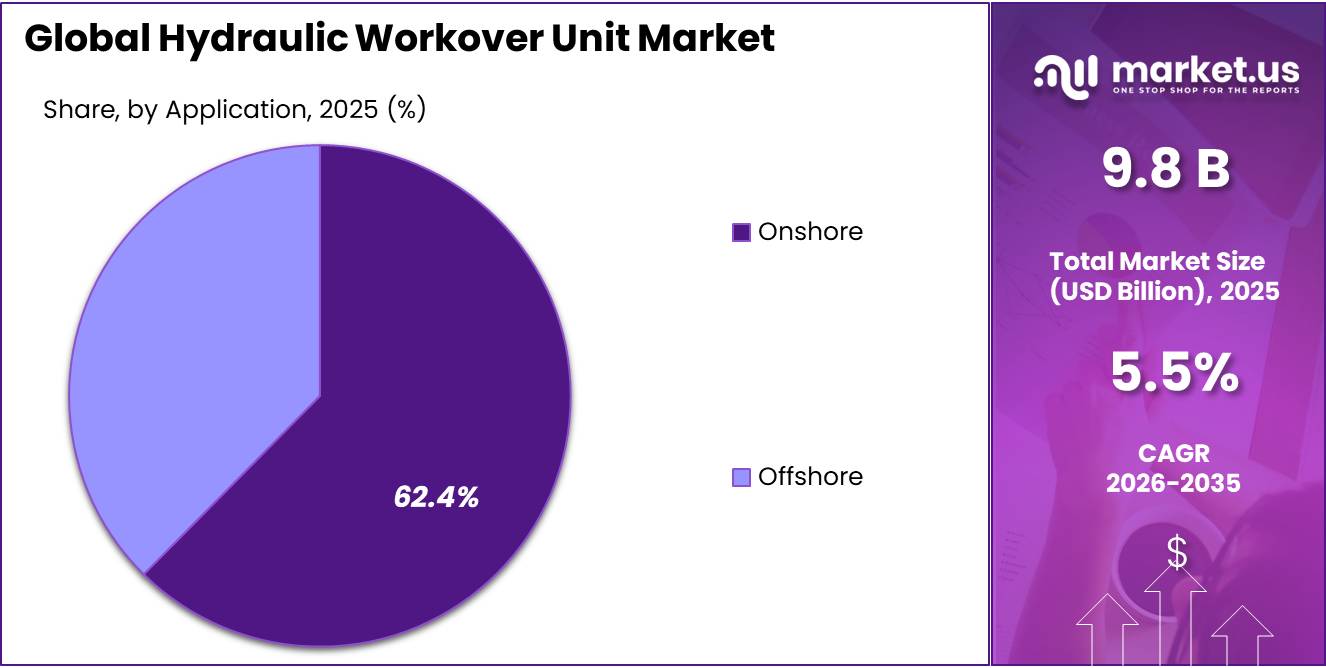
- Onshore held a dominant market position, capturing more than a 62.45% share.
- North America dominated the Hydraulic Workover Unit market, accounting for 32.11% share and reaching USD 3.1 billion
By Services Analysis
Workover services dominate with a 73.00% market share in 2025, supported by their essential role in well maintenance, production restoration, and operational efficiency.
In 2025, “Workover” held a dominant market position, capturing more than a 73.00% share of the Hydraulic Workover Unit market. The segment maintains its leading position due to widespread demand for well repair, tubing replacement, downhole equipment maintenance, and production enhancement. Workover operations help oil and gas operators extend the productive life of existing wells while reducing the need for expensive new drilling activities.
According to the U.S. Environmental Protection Agency (EPA), workover activities include several methods used to maintain or restore existing well production. This established demand continues to support the segment’s position in 2025 and 2026.
Snubbing services involve inserting or removing tubing and equipment from wells while maintaining pressure control, without shutting down production through conventional well-killing procedures. The segment is gaining attention due to its ability to minimize production interruptions, reduce formation damage, and improve operational flexibility.
According to the U.S. Bureau of Safety and Environmental Enforcement (BSEE), snubbing and hydraulic workover operations require specialized well-control systems, with technical assessments supporting improved equipment reliability and operational safety.
By Installation Analysis
Skid-mounted units dominate with a 58.34% share in 2025, driven by operational stability, compact design, and easy installation.
In 2025, “Skid-Mounted” held a dominant market position, capturing more than a 58.34% share of the Hydraulic Workover Unit market. These units are widely preferred because of their compact structure, stable installation, and suitability for fixed oilfield facilities and offshore platforms. Their integrated design allows equipment to be transported, positioned, and installed efficiently, reducing setup time and operational complexity.
In 2026, demand continues to benefit from the need for reliable well intervention equipment, particularly in locations where space limitations and operational safety are important considerations. Skid-mounted hydraulic workover units also support modular installation and efficient equipment handling, making them suitable for demanding oilfield operations.
Trailer-Mounted hydraulic workover units are increasingly preferred by operators seeking flexible equipment deployment across multiple oil and gas locations. Their transportation-friendly design allows service providers to move equipment between well sites with less dependence on separate transportation arrangements.
In 2025, their growing relevance was supported by the need for efficient field mobilization, while in 2026, demand continues to benefit from multiwell operations and remote onshore activities. These units can help reduce relocation time and improve equipment utilization, making them suitable for operators managing several wells across geographically dispersed locations.
By Capacity Analysis
151–200 Tonnes capacity dominates with a 61.22% market share in 2025, driven by its strong lifting capability and suitability for demanding well intervention operations.
In 2025, “151–200 Tonnes” held a dominant market position, capturing more than a 61.22% share of the Hydraulic Workover Unit market. This capacity range is preferred for operations requiring high lifting force, reliable tubing handling, and efficient intervention in complex oil and gas wells. Its ability to support demanding workover activities while maintaining operational flexibility makes it a suitable choice for oilfield operators. In 2026, demand continues to be supported by mature well maintenance, production restoration, and intervention activities in deeper and higher-pressure wells.
Below 150 Tonnes hydraulic workover units are used for operations involving moderate lifting requirements, tubing handling, and maintenance of existing oil and gas wells. In 2025, this capacity category remained relevant for operators seeking equipment suitable for less complex workover activities and cost-efficient well servicing. In 2026, demand continues to be supported by the need for flexible equipment deployment, routine maintenance, and production restoration.
An official Oil India Limited procurement document specifies a 125-tonne hoisting capacity for a mobile workover rig, demonstrating the use of rated lifting capacity in government-owned oilfield operations. This provides a technical reference for workover equipment capacity requirements, although it does not independently verify the 61.22% market share of the 151–200-tonne segment.
By Application Analysis
Onshore applications dominate with a 62.45% market share in 2025, supported by extensive well servicing requirements and cost-efficient production maintenance.
In 2025, “Onshore” held a dominant market position, capturing more than a 62.45% share of the Hydraulic Workover Unit market. Onshore operations account for significant demand because of the large number of existing oil and gas wells requiring maintenance, repair, and production enhancement. Hydraulic workover units are widely used for tubing replacement, downhole equipment servicing, well cleaning, and production restoration.
Their mobility, operational flexibility, and ability to handle different well conditions make them suitable for onshore oilfields. In 2026, demand continues to benefit from efforts to extend the productive life of mature wells, improve recovery rates, and reduce the costs associated with drilling replacement wells. The segment also benefits from easier equipment transportation and deployment compared with offshore operations.
According to the U.S. Energy Information Administration (EIA), the United States produced approximately 13.2 million barrels per day of crude oil in 2024, with a substantial contribution from onshore production activities. This high level of production reflects the scale of onshore oilfield operations and the continuing requirement for well maintenance, intervention, and production optimization services.
Key Market Segments
By Services
- Workoverx
- Snubbing
By Installation
- Skid-Mounted
- Trailer-Mounted
By Capacity
- Below 150 Tonnes
- 151-200 Tonnes
- Above 200 Tonnes
By Application
- Onshore
- Offshore
Driver Analysis
Mature-Well Production Restoration
Operators’ efforts to recover production from existing wells support hydraulic workover procurement where the required tubing handling, mechanical access or remedial scope cannot be completed economically with lighter intervention equipment. The NSTA’s August 2026 Wells Insights release reported 398 UK Continental Shelf interventions during 2025 and 56 reinstated wells contributing approximately 16 million barrels of oil equivalent; the reported well stock included 1,439 operating wells and 558 shut-in wells, demonstrating an existing intervention pool rather than proving that every shut-in well is technically or commercially recoverable.
EIA’s latest producing-well dataset separately identified 918,481 US oil and gas wells in 2024, with approximately 78% producing no more than 15 BOE/day, but this large low-output population should not be treated as automatically suitable for hydraulic workover because intervention cost can exceed recoverable value.
In a constructed candidate producing an additional 100 barrels/day after intervention, 300 productive days and USD 25/barrel incremental operating contribution generate USD 750,000 annually. An assumed USD 400,000 intervention has approximately 0.53-year simple recovery before decline, tax and financing. The +0.8-point sensitivity assumes 30% terminal equipment-revenue exposure and approximately 13.1% cumulative outperformance, adding 3.9% terminal revenue.
Contractors initially benefit through utilization; manufacturers capture growth only through additional units, capacity upgrades or refurbishment, not the entire value of restored production. This shifts equipment selection toward repeatable brownfield tasks and demonstrated job economics rather than maximizing nominal lifting capacity alone.
Drivers Impact Analysis
| Driver | (~) % Impact on CAGR Forecast | Geographic Relevance | Impact Timeline |
|---|---|---|---|
| Mature-well production restoration | +0.8 pp | US, UK, Brazil, Indonesia | Short term (≤ 2 years) |
| Live-well snubbing adoption | +0.7 pp | Gulf states, US, Canada, ASEAN | Medium term (2–4 years) |
| Offshore modular-unit substitution | +0.6 pp | UK, Norway, Brunei, Malaysia | Medium term (2–4 years) |
| Well-abandonment campaign demand | +0.6 pp | UK, Netherlands, Norway, Australia | Long term (≥ 4 years) |
| Artificial-lift intervention requirements | +0.5 pp | US, Gulf states, North Sea, ASEAN | Short term (≤ 2 years) |
| Extended-reach remediation demand | +0.5 pp | Gulf states, US, Canada | Medium term (2–4 years) |
Restraint Analysis
Marginal-Well Intervention Economics
A large mature-well population does not automatically create an economically recoverable hydraulic workover market because modest incremental production may be insufficient to repay mobilization, mechanical intervention and downtime. EIA’s latest well-distribution report states that 78% of more than 918,000 producing US wells generated no more than 15 BOE/day in 2024, whereas only 8% exceeded 100 BOE/day; these historical data establish production concentration, not a 2026 count of hydraulic-workover candidates.
In a constructed oil-well intervention restoring 10 barrels/day over 300 productive days at USD 20/barrel incremental operating contribution, annual benefit is USD 60,000. An assumed USD 300,000 intervention therefore requires five years of simple recovery before decline, tax and financing. If incremental output declines 20% annually, five-year undiscounted contribution totals approximately USD 202,000, below the initial expenditure. Increasing restored production to 25 barrels/day improves first-year contribution to USD 150,000 and materially changes viability, illustrating why screening must use recoverable incremental output rather than existing production alone.
The −0.6-point sensitivity assumes 25% terminal equipment-revenue exposure and an 11.2% realization shortfall, producing approximately 2.8% terminal erosion. Contractors consequently reject or consolidate weak jobs, limiting the utilization that would justify additional units. Manufacturers must not apply equipment-per-well ratios to the entire marginal-well stock; low-cost alternatives, shared mobilization and stronger commodity netbacks can recover some demand, while unsuccessful well candidates should remain outside the serviceable equipment opportunity.
Restraint Impact Analysis
| Restraint | (~) % Impact on CAGR Forecast | Geographic Relevance | Impact Timeline |
|---|---|---|---|
| Marginal-well intervention economics | −0.6 pp | US, Canada, Indonesia, Latin America | Short term (≤ 2 years) |
| Lighter intervention substitution | −0.5 pp | US, Gulf states, North Sea, ASEAN | Medium term (2–4 years) |
| New-unit utilization hurdles | −0.5 pp | US, Canada, Gulf states, ASEAN | Medium term (2–4 years) |
| Pressure and barrier incompatibility | −0.4 pp | US offshore, North Sea, Gulf states | Medium term (2–4 years) |
| Offshore deployment limitations | −0.3 pp | North Sea, Brazil, Malaysia, Brunei | Long term (≥ 4 years) |
| Abandonment expenditure deferrals | −0.3 pp | UK, Netherlands, Australia | Short term (≤ 2 years) |
Opportunity Analysis
Geothermal Intervention Packages
SLB’s published geothermal case restored or enhanced five wells and enabled 14 MW of generation through coiled-tubing unloading and scale removal at temperatures above 260°C, demonstrating both the intervention need and a competing delivery method.
In a constructed forty-well prospect portfolio, suppose ten wells require a genuinely hydraulic-specific mechanical scope and eight unit-days each, creating eighty days of demand. One contractor’s existing unit might cover that workload without a purchase; four comparable, geographically separated programs create 320 days and a stronger case for an additional or substantially upgraded package.
An assumed USD 900,000 qualification and refurbishment program sold across three units creates USD 2.7 million of eligible supplier revenue, provided the work is additional to ordinary refurbishment. The +0.4-point sensitivity requires approximately 1.9% incremental terminal market revenue.
Manufacturers must validate surface temperatures, seals, fluids, corrosion exposure and pressure-control interfaces; downhole temperature alone does not establish surface equipment requirements. The white space is selected heavy-intervention applications, not the entire geothermal well population.
Opportunity Impact Analysis
| Opportunity | (~) % Potential CAGR Upside | Geographic Relevance | Execution Window |
|---|---|---|---|
| Geothermal intervention packages | +0.4 pp | Indonesia, Philippines, Kenya, Türkiye | Medium term (2–4 years) |
| CO₂-storage conversion packages | +0.3 pp | US Gulf Coast, UK, Netherlands, Norway | Long term (≥ 4 years) |
| Electric power-pack retrofits | +0.5 pp | North Sea, EU, US, Canada | Short term (≤ 2 years) |
| Engineered safety retrofit platforms | +0.4 pp | US, Gulf states, Canada, ASEAN | Medium term (2–4 years) |
| Access-constrained offshore packages | +0.4 pp | North Sea, Malaysia, Brunei, Brazil | Medium term (2–4 years) |
| Capability-led acquisition platforms | +0.3 pp | US, UK, Netherlands, Gulf states | Short term (≤ 2 years) |
Challenges Analysis
Specialist Crew Competency Renewal
Hydraulic workover and snubbing require sustained competence in pipe handling, pressure control, barrier management and abnormal-event response, creating a continuing training and supervision burden rather than a one-time certification requirement.
IWCF’s current Well Intervention Pressure Control program identifies snubbing as an optional discipline, requires compulsory completion modules, specifies minimum Level 3 and Level 4 training of twenty to twenty-eight hours depending on selected disciplines, and gives those certificates two-year validity.
In a constructed workforce of eighty relevant personnel with evenly staggered renewals, forty require certification renewal annually. At an assumed USD 3,000 for course, assessment and travel, direct expenditure is USD 120,000; twenty-eight training hours per person add 1,120 unavailable hours, worth USD 56,000 at USD 50/hour before replacement coverage. If five experienced supervisors each lose six additional field days to mentoring, thirty supervisor-days also require scheduling.
The −0.4-point sensitivity assumes 25% terminal equipment-revenue exposure and a 7.5% realization shortfall, producing approximately 1.9% terminal erosion through slower commissioning or constrained fleet expansion. Manufacturers and contractors need structured mentoring, role-specific assessments and recurring practical drills; no published global hydraulic-workover talent-deficit count is assumed, and certification renewals must not be equated automatically with an industry-wide labor shortage.
Challenges Impact Analysis
| Challenge | (~) % CAGR Friction Drag | Geographic Relevance | Mitigation Horizon |
|---|---|---|---|
| Specialist crew competency renewal | −0.4 pp | US, Canada, Gulf states, ASEAN | Long term (≥ 4 years) |
| Hydraulic control reliability management | −0.4 pp | US, North Sea, Gulf states, ASEAN | Medium term (2–4 years) |
| Configuration and standards harmonization | −0.3 pp | US offshore, North Sea, Gulf states | Long term (≥ 4 years) |
| Extended-reach load prediction uncertainty | −0.3 pp | US, Canada, Gulf states | Medium term (2–4 years) |
| Cross-border mobilization synchronization | −0.3 pp | North Sea, Gulf states, ASEAN, Brazil | Medium term (2–4 years) |
| Legacy equipment condition traceability | −0.3 pp | US, Canada, North Sea, ASEAN | Medium term (2–4 years) |
Geopolitical Impact Analysis
Geopolitical Impact of the Ongoing Middle East War on the Hydraulic Workover Unit Market
The ongoing Middle East conflict in 2026 has created significant uncertainty in the global oil and gas industry, directly affecting the Hydraulic Workover Unit market. Disruptions to oil production, shipping routes, and energy infrastructure have increased operational risks for oilfield service providers. According to the International Energy Agency (IEA), oil flows through the Strait of Hormuz have faced major disruptions, while approximately 20% of global liquefied natural gas (LNG) trade passed through this strategic waterway in 2025.
Rising fuel prices, transportation expenses, insurance premiums, and equipment procurement costs are creating financial pressure on hydraulic workover unit manufacturers and service providers. Delays in the delivery of hydraulic components, steel equipment, specialized machinery, and replacement parts are also affecting project schedules. Offshore workover operations face additional challenges due to security risks and restricted marine transportation.
However, geopolitical instability is also creating opportunities for the market. Operators are increasingly prioritizing well maintenance, production recovery, and workover activities to restore disrupted oil production and improve existing well performance. The United Nations reported that Middle East oil output declined by at least 9 million barrels per day in March 2026, compared with approximately 26 million barrels per day in February.
Regional Insights
Dominating Region: North America (32.11% | USD 3.1 Billion)
In 2025, North America dominated the Hydraulic Workover Unit market, accounting for 32.11% share and reaching USD 3.1 billion in market value, according to the provided market data. The region benefits from extensive oil and gas production, established oilfield service infrastructure, and continuous well maintenance activities across the United States and Canada.
The U.S. Energy Information Administration (EIA) reported that U.S. crude oil production reached a record 13.6 million barrels per day in 2025, representing a 3% increase compared with 2024. The Permian Basin alone accounted for approximately 48% of total U.S. crude oil production, highlighting the region’s strong concentration of oilfield activity.
These production levels support demand for hydraulic workover units used in well servicing, production restoration, tubing replacement, and intervention operations. In 2026, investments in mature well optimization, shale operations, and advanced intervention technologies continue to strengthen regional demand. North America’s established equipment manufacturers, skilled workforce, and technological capabilities further support its leading position.
Key Regions and Countries Insights
- North America
- US
- Canada
- Europe
- Germany
- France
- The UK
- Spain
- Italy
- Rest of Europe
- Asia Pacific
- China
- Japan
- South Korea
- India
- Australia
- Rest of APAC
- Latin America
- Brazil
- Mexico
- Rest of Latin America
- Middle East & Africa
- GCC
- South Africa
- Rest of MEA
Key Players Analysis
SLB is a major oilfield services provider offering well intervention, production optimization, and hydraulic workover-related solutions. In 2025, the company strengthened its production services portfolio through the acquisition of ChampionX, completed in July 2025. The acquisition was expected to generate approximately USD 400 million in annual synergies. SLB also secured a multi-year contract with Woodside Energy in March 2025 for 18 ultra-deepwater wells in the Trion project offshore Mexico, with operations scheduled to begin in 2026.
Halliburton is a leading provider of hydraulic workover and snubbing services for onshore and offshore oilfield operations. Its hydraulic workover solutions support live-well intervention, well maintenance, re-entry, fishing, and plug-and-abandonment activities. In a documented offshore intervention, Halliburton deployed a 460K hydraulic workover and snubbing unit to recover stuck coiled tubing from a high-pressure well operating at approximately 3,600 psi. The operation achieved potential production improvement of up to 20% while restoring reservoir access.
Weatherford International provides well intervention, pressure pumping, production optimization, and specialized oilfield services. Its portfolio includes digital monitoring, automation, and intervention technologies that support efficient well operations. In 2025, Weatherford continued strengthening its production and intervention capabilities through integrated technology offerings, including real-time performance analytics and advanced well monitoring solutions.
Top Key Players Outlook
- Schlumberger Limited
- Halliburton Company
- Weatherford International plc
- Nabors Industries Ltd.
- Superior Energy Services Inc.
- Archer Limited
- Altus Intervention AS
- Cudd Energy Services Inc.
- Precision Drilling Corporation
- Ensign Energy Services Inc.
- Hunting Energy Services Ltd.
- COSL Oilfield Services Limited
- Other Key Players
Recent Developments
- In February 2026, Nabors expanded its operational capabilities through a newly upgraded facility in Abu Dhabi, strengthening its regional service capacity. In August 2026, the company invested USD 35 million in Quaise Energy as part of its USD 180 million Series B financing and signed a strategic framework agreement covering drilling operations, technology integration, and commercial development.
- In February 2026, Archer highlighted plans to commercialize new P&A technologies during the year. The company’s Well Services division recorded approximately USD 68 million in EBITDA in 2025, supported by specialized well intervention solutions and technology development. Its continued focus on advanced downhole tools, mechanical isolation, wireline, and integrated intervention services supports innovation in well maintenance and abandonment operations.
Report Scope
| Report Features | Description |
|---|---|
| Market Value (2025) | USD 9.8 Bn |
| Forecast Revenue (2035) | USD 16.7 Bn |
| CAGR (2026-2035) | 5.5% |
| Base Year for Estimation | 2025 |
| Historic Period | 2020-2024 |
| Forecast Period | 2026-2035 |
| Report Coverage | Revenue Forecast, Market Dynamics, Competitive Landscape, Recent Developments |
| Segments Covered | By Services (Workover, Snubbing), By Installation (Skid-Mounted, Trailer-Mounted), By Capacity (Below 150 Tonnes, 151-200 Tonnes, Above 200 Tonnes), By Application (Onshore, Offshore) |
| Regional Analysis | North America – US, Canada; Europe – Germany, France, The UK, Spain, Italy, Rest of Europe; Asia Pacific – China, Japan, South Korea, India, Australia, Singapore, Rest of APAC; Latin America – Brazil, Mexico, Rest of Latin America; Middle East & Africa – GCC, South Africa, Rest of MEA |
| Competitive Landscape | Schlumberger Limited, Halliburton Company, Weatherford International plc, Nabors Industries Ltd., Superior Energy Services Inc., Archer Limited, Altus Intervention AS, Cudd Energy Services Inc., Precision Drilling Corporation, Ensign Energy Services Inc., Hunting Energy Services Ltd., COSL Oilfield Services Limited, Other Key Players |
| Customization Scope | Customization for segments, region/country-level will be provided. Moreover, additional customization can be done based on the requirements. |
| Purchase Options | We have three licenses to opt for: Single User License, Multi-User License (Up to 5 Users), Corporate Use License (Unlimited User and Printable PDF) |