


Report Overview
Global Home Shopping Market size is expected to be worth around USD 21,815.6 Billion by 2035, compared with USD 6,134.5 Billion in 2025. The stated CAGR is 13.6% during the forecast period 2026 to 2035. Home shopping covers merchandise ordered remotely through digital storefronts, television programs, and catalogs, connecting consumers with sellers without requiring store visits. Commercial success depends on converting convenient product access into profitable, repeat purchasing.
Home shopping combines marketplace platforms, direct retail operations, broadcast selling, and catalog businesses serving household consumption needs. According to the U.S. Census Bureau, online retail sales increased 12.2% year over year during the second quarter of 2026. Digital order growth spreads storefront and merchandising costs across more transactions, but sellers still need disciplined acquisition spending. Investors should therefore assess retained contribution rather than treating transaction growth as proof of stronger earnings.
Key Takeaways
- The market starting value is USD 6,134.5 Billion in 2025.
- The forecast market value is USD 21,815.6 Billion by 2035.
- The stated CAGR is 13.6% for 2026 to 2035.
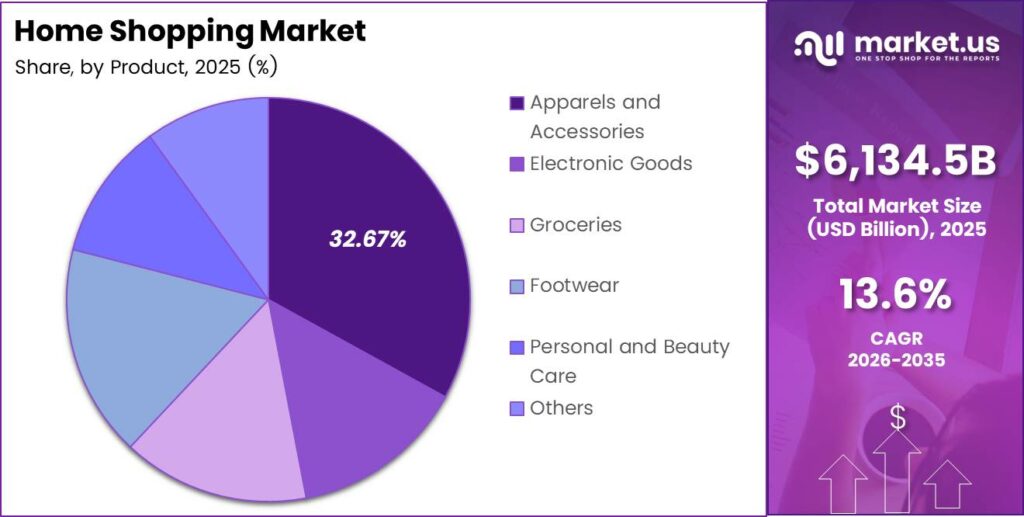
- Apparels and Accessories lead the product segmentation with a 32.67% share; Electronic Goods represent the fastest-growing product category.
- E-Commerce and Mobile Shopping lead the type segmentation with a 74.34% share and represent its fastest-growing channel.
- Card Payments lead payment segmentation with a 48.3% share.
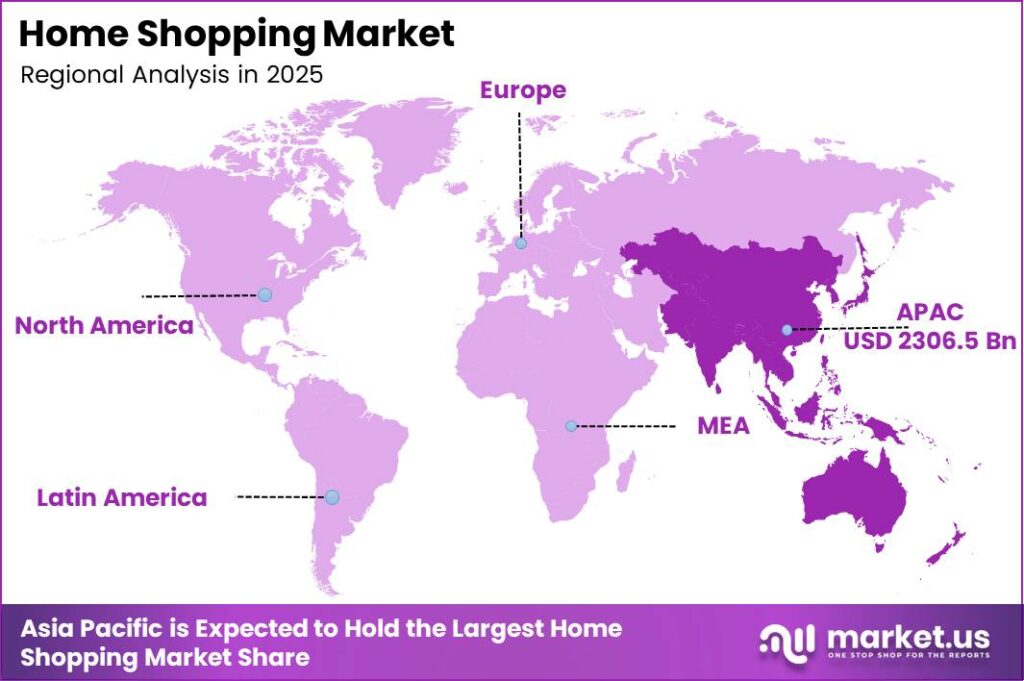
- Asia-Pacific leads regional segmentation with a 37.67% share and a market value of USD 2306.5 Billion.
- Middle East & Africa represent the fastest-growing region.
- The forecast period runs from 2026 to 2035.
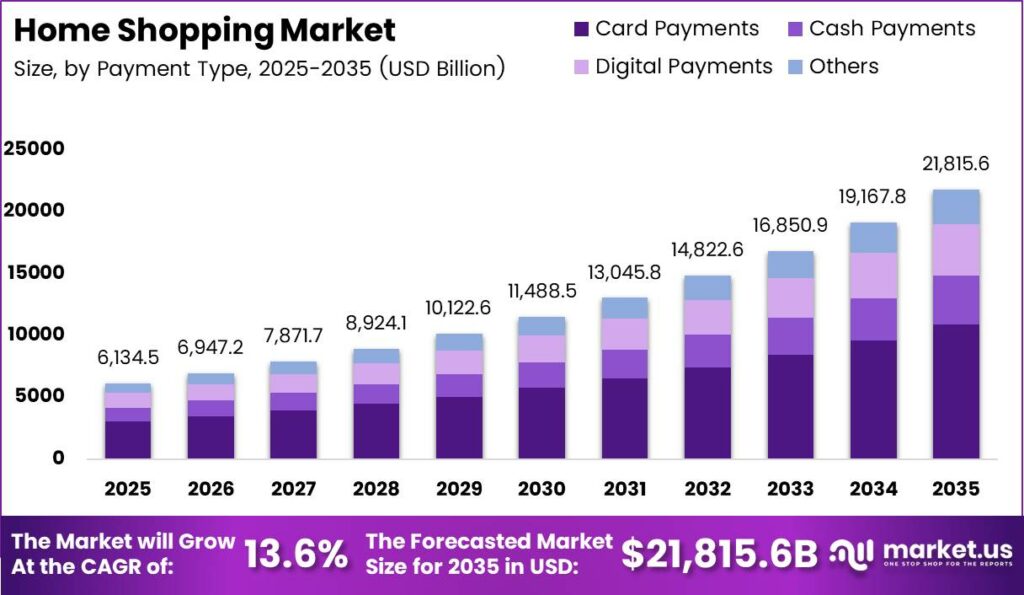
Consumer protection, payment oversight, and product compliance shape the operating conditions for remote retail, making trust a commercial requirement. As reported by Eurostat, 77% of EU internet users purchased goods or services online during the preceding year in 2024. This participation benchmark supports continued investment in accessible storefronts and clear purchasing terms. Retailers that make product claims, delivery commitments, and refund conditions understandable can compete on confidence rather than discounts alone.
Cross-business infrastructure commitments show how large operators connect retail fulfillment with cloud computing and artificial intelligence. Data from Amazon shows a June 2026 announcement covering USD 48 Billion of planned India investment during 2026 to 2030. The program spans different businesses, so the headline amount does not represent retail spending alone. Investors should distinguish shopping infrastructure that improves delivery economics from technology spending serving broader enterprise customers and workloads.
Asia-Pacific holds the leading regional position, supported by established digital retail ecosystems, dense consumer markets, and extensive supplier networks. Regional platforms can connect product discovery, payment, and fulfillment within closely linked shopping journeys, reducing the steps between interest and purchase. That structure favors merchants capable of matching local preferences with dependable delivery. Investors should examine operating differences between countries rather than treating regional scale as evidence of uniform profitability.
Product Analysis
Apparels and Accessories dominate with 32.67% share due to visual merchandising and style-led purchasing.
Apparels and Accessories occupy the leading product position because visual merchandising can connect style choices with remote purchasing. Eurostat found that 45% of EU residents purchased clothing, shoes, or accessories online during the preceding quarter in 2024. The measure combines these categories rather than isolating apparel alone. Sellers can translate browsing into orders through clearer sizing, material descriptions, and product imagery, making merchandise accuracy a direct contributor to retained sales.
Electronic Goods depend on clear specifications, credible warranties, and dependable delivery because buyers compare performance before committing to higher-value purchases. Based on Best Buy data, domestic online revenue reached USD 4.91 Billion during its fourth quarter of fiscal 2026. This retailer benchmark includes its broader online assortment rather than electronics alone. Sellers that explain compatibility and service coverage can reduce purchase hesitation while protecting margins against price-only comparisons.
Groceries connect home shopping with recurring household replenishment, making availability and delivery timing central to the purchase decision. Amazon indicates that perishable Same-Day Delivery sales expanded 30 times from January 2025 through its December update. The result reflects a service rollout rather than an industry-wide growth rate. Retailers need accurate stock records and suitable handling processes because missed items or damaged perishables can weaken the repeat purchasing needed to support delivery economics.
Type Analysis
E-Commerce and Mobile Shopping dominate with 74.34% share due to convenient access and integrated checkout journeys.
E-Commerce and Mobile Shopping connect product discovery, comparison, ordering, and account management within continuously accessible storefronts. Figures from the U.S. Census Bureau show estimated online retail sales of USD 310.3 Billion during the third quarter of 2025. The measure covers U.S. retail rather than the entire home-shopping market. Merchants need responsive interfaces and accurate availability because digital convenience creates value only when customers can complete purchases without avoidable checkout or fulfillment failures.
Teleshopping uses demonstrations and presenter explanations to reduce uncertainty about products that customers cannot inspect before ordering. According to QVC Group, its broadcast networks reached more than 200 million households worldwide each day during fiscal 2025. Broadcast distribution measures potential exposure rather than purchasing customers, making conversion discipline essential. Operators should connect demonstrations with simple ordering paths and credible delivery promises, allowing production spending to support measurable sales rather than audience reach alone.
Other home-shopping formats include catalog-led purchasing, where printed selections can prompt product consideration beyond a screen-based browsing session. As reported by QVC Group, annual catalog circulation totaled approximately 75 million during 2025. Catalog circulation does not establish how customers ultimately placed their orders, so channel attribution needs care. Retailers should measure incremental response and retained contribution before expanding mailing programs, since printing and distribution costs arise before any resulting purchase.
Payment Type Analysis
Card Payments dominate with 48.3% share due to familiar credentials and established payment acceptance.
Card Payments connect remote orders with familiar payment credentials, supporting purchases where customers value established authorization and dispute processes. Data from Visa shows payments volume of USD 14.2 Trillion during fiscal 2025, covering its broader network rather than home shopping alone. Card acceptance can widen the reachable customer base, but processing costs and unsuccessful authorizations affect conversion. Merchants should assess payment performance alongside fraud exposure instead of selecting providers on transaction fees alone.
Cash Payments remain relevant where customers prefer settlement after delivery, although payment-on-delivery does not always involve physical cash. The World Bank found that approximately one-third of online shoppers in low- and middle-income economies paid on delivery rather than online. Deferred collection can reassure hesitant buyers while exposing sellers to rejected deliveries and delayed receipts. Merchants should distinguish cash from card or digital settlement at the doorstep before evaluating collection costs and customer preferences.
Digital Payments support remote purchasing by allowing customers to authorize transactions through electronic accounts and payment interfaces. Based on World Bank data, 61% of adults in low- and middle-income economies made or received a digital payment in 2024. The indicator covers several payment purposes, not shopping alone, and can overlap with card usage. Retailers should offer locally relevant methods while measuring completion rates, settlement timing, and reconciliation costs to judge their commercial value.
Key Market Segments
By Product
- Apparels and Accessories
- Electronic Goods
- Groceries
- Footwear
- Personal and Beauty Care
- Furniture and Home Decor
- Others
By Type
- E-Commerce and Mobile Shopping
- Teleshopping
- Others
By Payment Type
- Card Payments
- Cash Payments
- Digital Payments
- Others
Regional Analysis
Asia-Pacific Dominates the Home Shopping Market with a Market Share of 37.67%, Valued at USD 2306.5 Billion.
Asia-Pacific benefits when established shopping platforms connect local sellers with dense delivery territories and frequent household purchasing. Alibaba indicates that quick-commerce revenue increased 56% year over year during the quarter ended December 2025. This China-focused company indicator does not measure the entire regional market, but it illustrates competition around faster replenishment. Investors should examine whether delivery density and repeat ordering support contribution after fulfillment expenses, rather than equating quicker service with stronger profitability.
Middle East & Africa offer expansion potential across markets with different payment habits, delivery networks, and consumer purchasing power. Figures from Jumia show full-year 2025 gross merchandise value of USD 818.6 Million, providing an African platform benchmark rather than a regional total. Operators need local collection methods and reliable delivery coverage because customer access does not guarantee completed orders. Investors should evaluate country-level execution and cash conversion before extending platform results across the wider region.
Key Regions and Countries
North America
- US
- Canada
Europe
- Germany
- France
- The UK
- Spain
- Italy
- Rest of Europe
Asia Pacific
- China
- Japan
- South Korea
- India
- Australia
- Rest of APAC
Latin America
- Brazil
- Mexico
- Rest of Latin America
Middle East and Africa
- GCC
- South Africa
- Rest of MEA
Market Dynamics
Home-shopping economics depend on retained sales, not simply the value of merchandise dispatched to customers. According to the National Retail Federation and Happy Returns, an estimated 19.3% of U.S. online sales would be returned in 2025. Returns can require collection, inspection, repacking, and markdown decisions before inventory becomes saleable again. Operators should connect product information with recovery processes, allowing managers to evaluate customer acquisition against the contribution remaining after reverse logistics.
Drivers
Established online purchasing habits move home shopping toward always-accessible storefronts rather than isolated television schedules or catalog campaigns. Digital storefronts give customers more control over product comparison and ordering, while broadcast and printed content can support discovery. Merchants can spread content and storefront spending across recurring purchasing activity, but acquisition costs still require discipline. Sellers that improve product clarity and checkout completion can turn existing channel adoption into stronger customer retention.
The driver sensitivities represent illustrative percentage-point contributions already embedded within the baseline growth assumption, not extra increments to add mechanically. Instant payments can shorten checkout, creator content can direct discovery, and marketplaces can aggregate fragmented assortments. Replenishment subscriptions can make repeat purchasing more predictable when customers retain control over timing and cancellation. Investors should judge these mechanisms through retained orders and contribution, rather than assuming each independently produces the full modeled effect.
| Driver | (~) % Impact on CAGR Forecast | Geographic Relevance | Impact Timeline |
|---|---|---|---|
| Consumer migration toward remote purchasing | +0.90% | Global; strongest in digitally mature markets | Short term (≤ 2 years) |
| Instant-payment checkout adoption | +0.65% | India, Brazil, Southeast Asia | Short term (≤ 2 years) |
| Creator-led product discovery | +0.55% | China, Southeast Asia, North America | Short term (≤ 2 years) |
| Marketplace assortment aggregation | +0.45% | Global; fragmented retail markets | Medium term (2–4 years) |
| Existing replenishment-subscription adoption | +0.35% | North America, Europe, developed Asia | Short term (≤ 2 years) |
Restraints
Low-value import duties can weaken price-led cross-border shopping by raising landed costs before a seller covers fulfillment and customer service. Retailers face a choice between absorbing charges and passing them to customers, with either route affecting order economics. Merchants that absorb duties sacrifice contribution, while higher checkout prices can discourage marginal purchases. Basket thresholds, selective assortment changes, and regional inventory can reduce exposure, but each response introduces operating costs or limits customer choice.
Household budget pressure, restricted merchant finance, access barriers, and product-safety prohibitions can further narrow the pool of economically viable transactions. These restraints affect different parts of the purchasing process, so their modeled effects should not be treated as independently proven deductions. Operators should identify whether weak performance originates in affordability, customer access, funding, or compliance. Investors can then distinguish temporary trading pressure from structural barriers that require a different market-entry model.
| Restraint | (~) % Impact on CAGR Forecast | Geographic Relevance | Impact Timeline |
|---|---|---|---|
| Low-value import duty barriers | -0.70% | European Union; cross-border sellers | Short term (≤ 2 years) |
| Household discretionary-budget constraints | -0.60% | Global; financially stressed households | Short term (≤ 2 years) |
| Internet-access exclusion | -0.45% | Low-income markets; underserved rural populations | Long term (≥ 4 years) |
| Merchant working-capital rationing | -0.35% | Emerging markets; smaller merchants | Short term (≤ 2 years) |
| Product-safety sales prohibitions | -0.25% | European Union, North America | Short term (≤ 2 years) |
Challenges
Remote product selection creates uncertainty about fit, appearance, and suitability, leaving operators responsible for recovering value when purchases disappoint. Product information can reduce avoidable mistakes, but reverse logistics still needs inspection rules, restocking capacity, and resale decisions. Retailers that treat returns only as a seasonal expense risk hiding persistent weaknesses in merchandise or purchasing guidance. Investors should examine how quickly returned goods become saleable and how much contribution survives the recovery process.
Delivery variability, fragmented inventory forecasts, fraud controls, and older commerce systems create separate operating pressures across the order journey. Strict screening can reject genuine buyers, while weak controls expose merchants to losses that transaction growth can conceal. Systems investment should connect purchasing, inventory, payment, and recovery records rather than add isolated tools. Operators that measure retained contribution across these processes can identify whether a service improvement creates value or simply shifts costs elsewhere.
| Challenge | (~) % CAGR Friction Drag | Geographic Relevance | Mitigation Horizon |
|---|---|---|---|
| Returns and recovery complexity | -0.65% | Global; apparel and discretionary merchandise | Medium term (2–4 years) |
| Last-mile delivery variability | -0.50% | Global; dispersed delivery territories | Medium term (2–4 years) |
| Inventory forecasting fragmentation | -0.40% | Global; multichannel operators | Medium term (2–4 years) |
| Fraud screening trade-offs | -0.30% | Global; card-based remote transactions | Short term (≤ 2 years) |
| Legacy commerce integration debt | -0.25% | Established television and catalogue operators | Medium term (2–4 years) |
Opportunities
Certified pre-owned merchandise can create an adjacent revenue stream when operators build dependable sourcing, inspection, refurbishment, and warranty processes. Planned trade-ins and specialist partnerships offer a different supply route from ordinary merchandise returns, supporting separate assortment and pricing decisions. Sellers need to account for acquisition costs, repair work, and warranty reserves before treating resale revenue as incremental profit. Early movers should test retained contribution and customer trust before expanding across product categories.
Supplier-funded media, assisted purchasing, business procurement, and exclusive merchandise offer other routes beyond conventional transaction growth. Each requires capabilities that established customer traffic does not automatically provide, including advertiser measurement, accessible service, purchasing controls, or product development. Retailers should separate new revenue from sales displaced elsewhere in their assortment. Investors can then assess whether these initiatives deepen customer value or merely reclassify existing spending within a broader commercial model.
| Opportunity | (~) % Potential CAGR Upside | Geographic Relevance | Execution Window |
|---|---|---|---|
| Certified pre-owned lifecycle commerce | +0.65% | Europe; selective global expansion | Medium term (2–4 years) |
| Supplier-funded retail media monetization | +0.45% | North America, Europe, developed Asia | Medium term (2–4 years) |
| Assisted purchasing for older consumers | +0.40% | Japan, Europe, North America | Medium term (2–4 years) |
| Small-business procurement adjacency | +0.30% | Global; fragmented microenterprise demand | Medium term (2–4 years) |
| Exclusive private-label category development | +0.25% | Global; established customer franchises | Medium term (2–4 years) |
Key Company Insights
Alibaba Group
Alibaba combines commerce operations with technology businesses, making consolidated scale broader than its exposure to remote merchandise purchasing. According to its fiscal 2026 annual reporting, group revenue totaled RMB 1,023,670 Million for the year ended March 2026. Investors should not equate this figure with home-shopping sales because different businesses contribute to the total. The commercial assessment should instead connect commerce performance with fulfillment quality, merchant participation, and the costs required to retain purchasing activity.
Alibaba’s infrastructure strategy connects its commerce ecosystem with cloud computing and artificial intelligence capabilities serving wider customer needs. As reported by Alibaba Group, the company announced at least RMB 380 Billion of planned cloud and AI infrastructure investment in February 2025. The program covers a multiyear commitment rather than spending attributable entirely to shopping. Investors should assess utilization and commercial returns before assuming that technology capacity automatically improves merchandise conversion or retail operating margins.
Amazon.com Inc.
Amazon combines online merchandise selling with marketplace services and businesses outside retail, creating several routes to revenue from its operating infrastructure. Data from its annual report shows consolidated 2025 net sales of USD 716,924 Million, including activities beyond home shopping. Investors should separate business contributions rather than treating the total as merchandise transaction value. Retail execution depends on whether selection, fulfillment, and customer retention generate contribution after service costs and capital requirements.
Amazon’s rural delivery investment targets territories where dispersed customers can make fast service difficult to support economically. Amazon indicates that its April 2025 announcement committed more than USD 4 Billion to expanding the rural U.S. delivery network. Dedicated capacity can improve coverage, but lower delivery density still requires careful routing and sufficient order activity. Investors should monitor whether expanded access produces durable purchasing relationships rather than evaluating the program through facility openings alone.
Key Players
- Alibaba Group
- Amazon.com Inc.
- Best Buy
- Ebay Inc.
- Flipkart Internet Private Limited
- Naaptol Company
- The Home Depot Inc
- Jumia Technologies AG
- HomeShop18 (Reliance)
- Wayfair Inc.
- Shopify Inc.
- Ubuy Co.
- VGL Group
- Walmart Inc.
- OTTO Group
- Coupang Corp.
- MercadoLibre Inc.
- Shop LC (Vaibhav Global)
- QVC Group
- JD.com Inc
- Rakuten Group Inc.
- Carrefour Group, S.A.
- Other Key Players
Recent Developments
2026
- October 2026: Walmart completed a capacity expansion by opening a Stockton fulfillment center exceeding 900,000 square feet, supporting faster regional order handling. According to Walmart, the next-generation facility expands its West Coast fulfillment network.
- September 2026: JINGDONG Property signed an agreement for approximately 150,000 square metres of warehousing facilities in Abu Dhabi. As reported by JD Corporate Blog and KEZAD, the planned project extends logistics capacity serving the regional trade network.
- September 2026: Amazon announced an additional USD 1.9 Billion investment in its Delivery Service Partner program for 2027. Data from Amazon shows that the commitment supports delivery operations, making driver capacity and service reliability central execution priorities.
- June 2026: Amazon announced a capacity expansion involving more than 100 specialized Urban Fulfillment Centers for Amazon Now in India. According to Amazon, the rollout supports rapid local delivery, requiring neighborhood-level assortment and inventory discipline.
- June 2026: Amazon announced more than EUR 10 Billion of planned European fulfillment investment. As reported by Amazon, modernization and robotics form part of the program, linking capital spending with processing capacity and operating efficiency.
- April 2026: Coupang disclosed cumulative investment exceeding USD 84 Million in U.S. and global AI technology startups since 2023. Data from Coupang shows a portfolio investment disclosure rather than a single newly completed funding transaction.
- March 2026: Wayfair announced the opening date for its approximately 150,000-square-foot Atlanta store. According to Wayfair, the physical expansion supports its omnichannel strategy, adding a product-interaction route rather than new fulfillment capacity.
- January 2026: Walmart and Wing announced a partnership expansion covering an additional 150 stores for drone delivery. As reported by Wing, the program extends a delivery format whose value depends on suitable baskets, coverage, and repeat usage.
- February 2026: eBay announced an acquisition agreement for Depop valued at approximately USD 1.2 Billion in cash, subject to adjustments. According to eBay, the acquisition subsequently closed in July, extending its position in resale-oriented commerce.
2025
- September 2025: The Home Depot and SRS Distribution completed the GMS acquisition at approximately USD 5.5 Billion in enterprise value. As reported by The Home Depot, the transaction expands specialty distribution rather than directly measuring consumer home-shopping activity.
- September 2025: Best Buy and IKEA U.S. announced a partnership pilot across 10 locations. Data from IKEA shows dedicated planning and shopping spaces, connecting remote purchasing decisions with physical consultation and merchandise presentation.
Geopolitical Impact Analysis
Trade realignment changes where home-shopping merchants source merchandise and which borders their inventories cross before reaching consumers. Figures from UNCTAD show global goods-and-services trade reached approximately USD 35 Trillion in 2025, while South-South trade expanded approximately 9%. These measures describe broader trade activity rather than online retail, but they frame sourcing choices for apparel fabrics, electronic components, and packaged household products. Merchants can diversify suppliers across trading corridors, yet each additional route requires checks on product standards, customs treatment, and replenishment reliability. Buyers should compare landed costs and delivery consistency rather than assuming that a lower supplier quotation produces a cheaper saleable product. Distributors need purchasing plans that account for border exposure without allowing safety inventory to absorb excessive working capital.
Shipping-route disruption can increase the transport effort required to deliver merchandise even when physical cargo volumes change more slowly. According to UNCTAD, maritime trade volumes increased 2.2% in 2024, while maritime ton-miles rose approximately 6% as rerouting lengthened journeys. Longer routes can affect replenishment planning for televisions, flat-packed furniture, textiles, and other merchandise carried through ocean freight networks. Retailers should distinguish cargo growth from distance growth because the latter can tie inventory to transport for longer periods without creating additional consumer sales. Distributors can respond through more selective safety stocks, earlier ordering, and closer coordination between purchasing and promotional schedules. Manufacturers serving home-shopping channels should evaluate delivery commitments against route reliability, while buyers should assess freight exposure before relying on aggressive promotional prices.
Report Scope
| Report Features | Description |
|---|---|
| Market Starting Year | 2025 |
| Forecast Year | 2035 |
| Forecast CAGR Period | 2026 to 2035 |
| Market Valuation | Headline market values and stated CAGR appear in Report Overview and Key Takeaways without numerical adjustment. |
| Report Coverage | Revenue Forecast, Market Dynamics, Market Opportunity Analysis, Technology and Innovation Landscape, Competitive Landscape, Recent Developments |
| Segments Covered | By Products (Apparels and Accessories, Electronic Goods, Groceries, Footwear, Personal and Beauty Care, Furniture and Home Decor, Others), By Type (E-Commerce and Mobile Shopping, Teleshopping, Others), By Payment Type (Card Payments, Cash Payments, Digital Payments, Others) |
| Regional Analysis | Quantitative discussion covers Asia-Pacific and Middle East & Africa. The geographic classification also lists North America, Europe, and Latin America without separate numerical regional analysis. |
| Competitive Landscape | Alibaba Group, Amazon.com Inc., Best Buy, Ebay Inc., Flipkart Internet Private Limited, Naaptol Company, The Home Depot Inc, Jumia Technologies AG, HomeShop18 (Reliance), Wayfair Inc., Shopify Inc., Ubuy Co., VGL Group, Walmart Inc., OTTO Group, Coupang Corp., MercadoLibre Inc., Shop LC (Vaibhav Global), QVC Group, JD.com Inc, Rakuten Group Inc., Carrefour Group, S.A., Other Key Players. |
| Company Profiles | Alibaba Group and Amazon.com Inc. |
| Scenario Method | DORT table impacts are illustrative analyst sensitivities, not independently verified causal forecasts or automatically additive adjustments. |
| Internal Links | No internal anchor text or destination URLs supplied. |





































