


Report Overview
Global Shopping Cart Market size is expected to be worth around USD 4.0 Billion by 2035 from USD 2.4 Billion in 2025, growing at a CAGR of 5.4% during the forecast period 2026 to 2035.
The shopping cart market encompasses the design, manufacturing, and commercial distribution of wheeled retail conveyance equipment used across supermarkets, hypermarkets, warehouse clubs, and specialty retail formats. This market spans traditional wire and metal basket units, plastic and hybrid alternatives, and a growing base of sensor-equipped smart cart platforms that integrate payment, navigation, and inventory functions.
Key Takeaways
- The Global Shopping Cart Market was valued at USD 2.4 Billion in 2025 and is projected to reach USD 4.0 Billion by 2035, growing at a CAGR of 5.4%.
- By Type, Traditional Shopping Carts dominate with 85.0% market share in 2025.
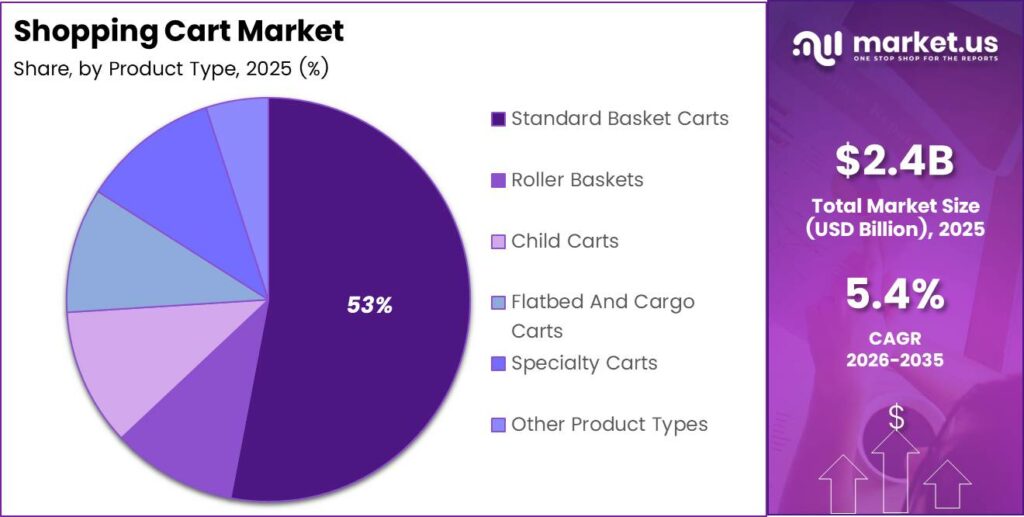
- By Product Type, Standard Basket Carts lead with 53.0% market share in 2025.
- By Material, Metal and Wire holds a 37.0% share, the largest among all material categories.
- By Capacity, the 100 to 200 Litres segment commands 49.0% share, reflecting mid-size cart dominance.
- By Wheel Configuration, Four-Wheel Carts account for 79.0% of the market.
- By Distribution Channel, Offline Retail leads with 68.0% share.
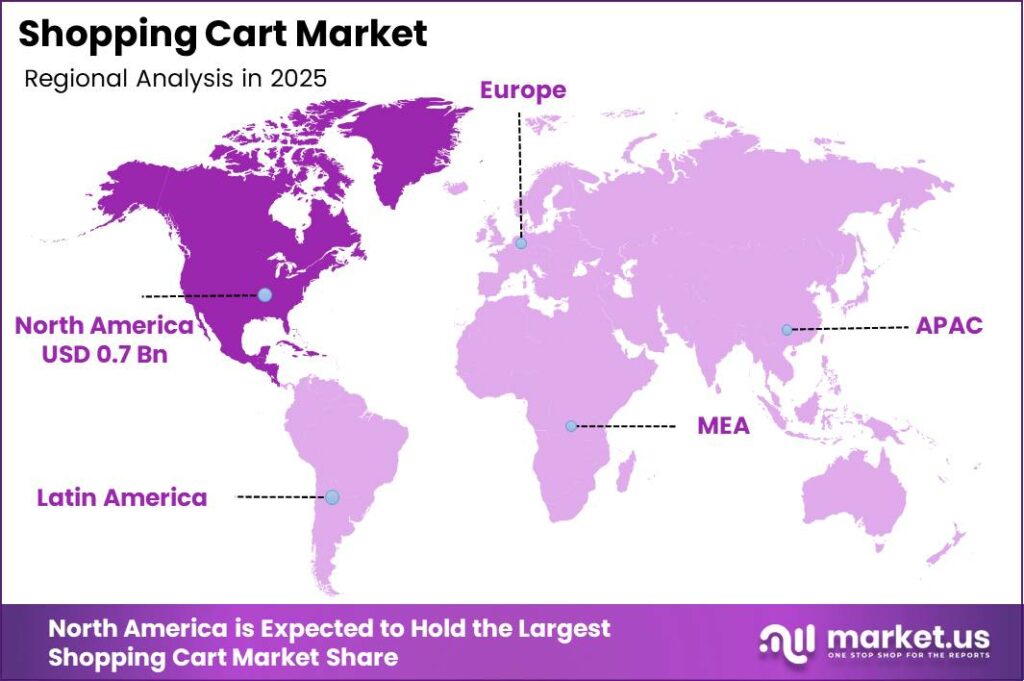
- North America is the dominant region with 32.0% market share, valued at USD 0.7 Billion in 2025.
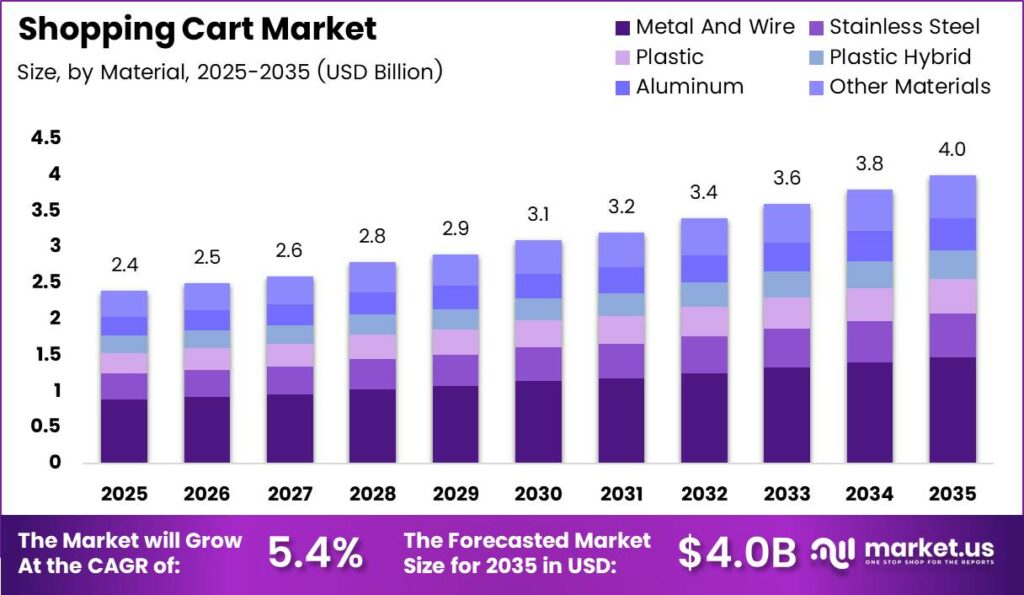
Retail infrastructure investment continues to reshape procurement patterns across this market. Governments in Asia-Pacific, the Middle East, and Africa have actively supported organized retail development through foreign direct investment relaxations and urban commercial zoning expansions. These policy moves accelerate store rollouts, which in turn generate direct fleet procurement demand for shopping cart manufacturers, particularly in emerging market corridors where cart penetration rates remain comparatively low.
In February 2026, Tata debuted an autonomous robotic shopping cart at the India AI Impact Summit in New Delhi, capable of navigating store layouts independently, responding to customer app requests, and tracking personal health and allergy metrics. This development signals a shift in how retailers across high-growth economies perceive cart functionality. Manufacturers that invest in smart infrastructure now will establish procurement relationships before fleet standardization occurs across these markets.
As per our research, U.S. retail e-commerce sales reached USD 340.2 Billion in Q2 2026, representing 17.1% of total U.S. retail sales on a seasonally adjusted basis, up 12.2% from Q2 2025. This scale of channel migration puts direct pressure on in-store cart utilization rates. As per our research, global maritime trade grew 2.2% in 2024 but was projected to slow to 0.5% in 2025, affecting cross-border cart component and finished-goods logistics costs for manufacturers dependent on international supply chains.
Type Analysis
Traditional Shopping Carts dominate with 85.0% due to cost efficiency, fleet compatibility, and retail ubiquity.
In 2025, Traditional Shopping Carts held a dominant market position in the By Type segment of the Shopping Cart Market, with a 85.0% share. Retailers across all store formats continue to standardize on wire-frame and metal-basket configurations because of low unit cost, predictable maintenance cycles, and seamless integration with existing corral and nesting infrastructure. This structural preference limits near-term displacement risk for incumbent cart manufacturers.
Smart Shopping Carts occupy the remaining market share but represent the category’s highest-growth upside. These units embed computer vision, weight sensors, digital payment, and loyalty integration into the cart chassis, converting a procurement cost into a revenue-generating retail tool. Retailers that pilot smart carts early gain checkout throughput advantages and basket-size data before competitors standardize on similar platforms. In November 2025, Instacart nearly tripled the number of active grocery retail stores deploying its Caper smart carts, demonstrating accelerating retailer adoption beyond early-stage pilots.
Product Type Analysis
Standard Basket Carts dominate with 53.0% due to versatile capacity and universal retail compatibility.
In 2025, Standard Basket Carts held a dominant market position in the By Product Type segment of the Shopping Cart Market, with a 53.0% share. Their balanced load capacity, stackable form factor, and compatibility with narrow and wide aisle formats make them the default specification for supermarket and hypermarket buyers. Manufacturers that optimize Standard Basket Cart production runs benefit from higher volume-to-tooling ratios and more predictable raw material scheduling.
Roller Baskets serve compact retail footprints and urban grocery concepts where full-size carts cannot navigate efficiently. These units appeal to convenience formats and city-center stores that compete on speed of transaction rather than basket size. As per our research, global economic growth was projected to slow to 2.3% in 2025, which has pressured consumer spend-per-trip patterns, increasing demand for smaller-capacity formats like Roller Baskets in price-sensitive retail channels.
Child Carts, Flatbed and Cargo Carts, Specialty Carts, and Other Product Types collectively hold the remaining share of the By Product Type segment. Flatbed and Cargo Carts serve warehouse and bulk-purchase formats where oversized item transport drives the specification. Specialty Carts address accessibility and niche retail requirements that standard configurations cannot fulfill. The Shanghai Export Containerized Freight Index fell 40% between early January and late March 2025, reducing per-unit import cost for retailers sourcing these lower-volume cart categories from overseas manufacturers.
Material Analysis
Metal and Wire dominates with 37.0% due to structural durability and established retail procurement standards.
In 2025, Metal and Wire held a dominant market position in the By Material segment of the Shopping Cart Market, with a 37.0% share. Wire-frame construction delivers the highest load-bearing capacity per unit cost, and its open-basket design satisfies visual product inspection requirements in fresh food and produce aisles. Retailers replacing aging fleets consistently reorder metal configurations because switching material types requires corral and nesting system modifications.
Stainless Steel carts command a premium segment within metal categories, targeting coastal, humid-climate, and food-service-adjacent retail environments where zinc-coated wire corrodes faster. These carts carry higher unit prices but generate lower long-term replacement frequency, making them attractive for operators calculating total cost of ownership over a five-year fleet cycle. Plastic and Plastic Hybrid carts, along with Aluminum and Other Materials, collectively capture the remaining market share across lighter-duty, specialty, and sustainability-focused retail procurement programs.
Capacity Analysis
100 to 200 Litres dominates with 49.0% due to alignment with standard supermarket basket-size requirements.
In 2025, the 100 to 200 Litres segment held a dominant market position in the By Capacity segment of the Shopping Cart Market, with a 49.0% share. This capacity range aligns directly with the average weekly grocery purchase volume for a household of two to four, making it the default fleet specification for supermarkets, neighborhood stores, and mid-format hypermarkets. Manufacturers producing primarily in this range benefit from the largest and most recurring replacement order pool.
The Up to 100 Litres segment serves compact urban formats, convenience-format grocery operators, and specialty retailers where transaction volumes are lower and aisle widths are narrower. Above 200 Litres configurations serve warehouse clubs and cash-and-carry formats where bulk purchasing drives the store economics. Both segments address structurally distinct retail models, meaning their procurement cycles and buyer profiles rarely compete directly with the dominant mid-range tier.
Wheel Configuration Analysis
Four-Wheel Carts dominate with 79.0% due to stability, maneuverability, and universal retail floor compatibility.
In 2025, Four-Wheel Carts held a dominant market position in the By Wheel Configuration segment of the Shopping Cart Market, with a 79.0% share. Full four-wheel swivel designs allow shoppers to navigate checkout lanes, narrow aisles, and produce areas without repositioning the cart body, reducing dwell time at high-traffic points. Retailers prioritize four-wheel designs because they reduce aisle-blocking incidents and lower reported shopper frustration at peak trading hours.
Three-Wheel Carts hold the remaining configuration share and target niche formats where weight distribution or turning radius creates specific design requirements. These units appear in compact urban grocery concepts and certain specialty-retail configurations. However, their non-standard chassis limits interchangeability with existing corral infrastructure, creating a procurement barrier that reinforces the four-wheel category’s structural dominance across mainstream retail environments.
Distribution Channel Analysis
Offline Retail dominates with 68.0% due to established B2B procurement relationships and fleet contract structures.
In 2025, Offline Retail held a dominant market position in the By Distribution Channel segment of the Shopping Cart Market, with a 68.0% share. Large retail chains procure shopping carts through direct manufacturer contracts, regional distributors, and equipment leasing programs that require physical inspection, customization, and logistics coordination. This procurement structure favors suppliers with established physical sales infrastructure and regional service networks over purely digital sales channels.
Online Sales account for the remaining channel share and serve independent grocers, smaller retail operators, and international buyers who cannot access local distributor networks. Digital procurement removes geographic barriers for end buyers but compresses manufacturer pricing visibility. As online channel share grows, manufacturers that invest in digital product configurators and transparent pricing tools will capture the independent-operator segment that large competitors typically underserve.
Key Market Segments
By Type
- Traditional Shopping Carts
- Smart Shopping Carts
By Product Type
- Standard Basket Carts
- Roller Baskets
- Child Carts
- Flatbed and Cargo Carts
- Specialty Carts
- Other Product Types
By Material
- Metal and Wire
- Stainless Steel
- Plastic
- Plastic Hybrid
- Aluminum
- Other Materials
By Capacity
- Up To 100 Litres
- 100 to 200 Litres
- Above 200 Litres
By Wheel Configuration
- Four-Wheel Carts
- Three-Wheel Carts
By Distribution Channel
- Offline Retail
- Online Sales
Regional Analysis
North America Dominates the Shopping Cart Market with a Market Share of 32.0%, Valued at USD 0.7 Billion
North America holds the largest regional share of the Shopping Cart Market at 32.0%, valued at USD 0.7 Billion in 2025. The region’s dominance reflects its mature large-format retail infrastructure, high cart-per-store ratios, and established fleet replacement cycles across supermarket and warehouse club formats. Retailers in the US and Canada operate some of the highest-density shopping cart fleets globally, creating consistent annual replacement procurement volumes for domestic and import-source manufacturers.
Asia-Pacific represents the market’s fastest-growing region, driven by ongoing supermarket, hypermarket, and discount grocery expansion across China, India, Southeast Asia, and the Gulf Cooperation Council corridor. In February 2025, Instacart launched its AI-powered Caper Carts at Coles Supermarkets in Melbourne, Australia, signaling that technology-led cart deployment has moved beyond North America into developed Asia-Pacific markets. Manufacturers that establish regional production or distribution partnerships in Asia-Pacific now will access fleet procurement volumes before local competitors scale.
Europe, Latin America, and the Middle East and Africa collectively represent the remaining regional market share. European markets prioritize cart durability, recyclability compliance, and smaller urban-format configurations due to compact retail footprints. Latin American retail expansion continues to create net-new fleet demand, particularly in Brazil and Mexico where organized grocery penetration is rising. Middle East and Africa markets, particularly Gulf Cooperation Council countries, are investing in modern retail formats that require full cart fleet procurement from launch.
Key Regions and Countries
North America
- US
- Canada
Europe
- Germany
- France
- The UK
- Spain
- Italy
- Rest of Europe
Asia Pacific
- China
- Japan
- South Korea
- India
- Australia
- Rest of APAC
Latin America
- Brazil
- Mexico
- Rest of Latin America
Middle East and Africa
- GCC
- South Africa
- Rest of MEA
Market Dynamics
Market Opportunity Analysis - Underserved capacity segments and emerging regional markets create entry points for focused cart manufacturers
The Above 200 Litres capacity segment serves warehouse clubs and cash-and-carry formats with distinct procurement specifications that mainstream suppliers rarely prioritize. Retailers in this format operate fleets of high-capacity carts as operational equipment rather than commodity replacements. Manufacturers that develop dedicated large-capacity configurations for this segment can command higher per-unit prices and establish long-term supply relationships before volume competition intensifies.
Three-Wheel Carts currently hold a minority share of the Wheel Configuration segment, but their non-standard chassis creates a focused procurement niche within compact urban grocery formats. Suppliers that design purpose-built three-wheel configurations compatible with existing urban store corral systems will reduce the switching barrier that currently limits adoption. This segment rewards specialist positioning over broad-line competition.
Latin America remains an underexploited regional market despite net-new organized retail expansion across Brazil and Mexico. Organized grocery penetration continues rising in these markets, generating fleet procurement demand that currently flows primarily to import-source manufacturers rather than regionally embedded suppliers. Distributors and manufacturers that establish Latin American service and parts networks will convert proximity into contract preference as local retail chains scale fleet sizes.
Online Sales currently account for the minority of distribution channel share at 32.0%, yet they represent the primary access route for independent grocers and small-format operators who cannot engage large distributor networks. Manufacturers that invest in digital configurators, transparent pricing, and direct online procurement tools will capture the independent-operator segment that volume-focused competitors structurally underserve.
Technology and Innovation Landscape - Smart cart hardware, sensor integration, and sustainability-led material redesign define the next competitive frontier
Smart cart platforms combine computer vision cameras, weight sensors, barcode-scanning capability, digital payment terminals, store navigation, and loyalty integration into a single chassis. A2Z Cust2Mate’s Cust2Mate 3.0 platform demonstrates commercial readiness at scale, with purchase orders covering more than 12,000 smart cart units across multiple retail chains as of mid-2026. Manufacturers that achieve modular electronics design will reduce per-unit production cost and accelerate fleet conversion timelines.
Autonomous cart navigation represents the frontier beyond sensor-assisted smart carts. Tata’s robotic cart concept, debuted at the India AI Impact Summit in February 2026, demonstrated a unit capable of navigating store layouts independently, responding to customer app requests, and tracking health and allergy metrics. This development signals that cart hardware is converging with robotics and personalized retail technology, creating a new product category with no established incumbent supplier.
Instacart’s Caper Cart platform integrates computer vision and weight sensor technology to automatically identify products and calculate totals on an integrated display, eliminating manual barcode scanning at the cart level. Amazon’s upgraded Dash Cart hardware, rolling out to more than 25 Whole Foods locations through 2026, pairs cart-level item detection with cashierless checkout infrastructure. These deployments by platform-scale technology operators establish consumer behavior expectations that traditional cart manufacturers must eventually match or partner to address.
Target’s May 2026 launch of its All Plastic Cart design signals that sustainability-led material innovation is entering mainstream procurement specifications at the largest retail scale. The fully recyclable design positions plastic hybrid and recycled polymer configurations as viable replacements for metal-dominant fleet procurement. Manufacturers that develop certified-recycled polymer cart lines with comparable load ratings to wire-frame equivalents will access a growing sustainability-driven procurement requirement across North America and Europe.
Drivers
Organized grocery expansion across Asia-Pacific, the Middle East, Africa, and Latin America generates direct fleet procurement demand because each new large-format store requires a full cart fleet before revenue generation begins. A conventional supermarket requires roughly 80 to 250 carts at launch, while a high-throughput hypermarket or wholesale format requires more than 300 units. Fleet refresh intervals of approximately 5 to 8 years add recurring replacement volume on top of net-new store demand, supporting an estimated +1.3% incremental contribution to the 5.4% baseline CAGR.
This expansion also benefits manufacturers through larger multi-store contracts that improve production scheduling, standardize component purchasing, and spread tooling and freight costs. Cart Fleet Replacement Cycles in North America, Western Europe, and Japan add an estimated +0.9% to the baseline CAGR, while Omnichannel Fulfillment Retrofits contribute +0.8% over a medium-term horizon. Bulk-Basket Shopping Demand and Durable Hybrid Cart Adoption add a further +0.7% and +0.5% respectively.
| Driver | (~) % Impact on CAGR Forecast | Geographic Relevance | Impact Timeline |
|---|---|---|---|
| Organized Grocery Expansion | +1.3% | Asia-Pacific, Middle East, Africa, Latin America | Short term (≤ 2 years) |
| Cart Fleet Replacement Cycles | +0.9% | North America, Western Europe, Japan | Short term (≤ 2 years) |
| Omnichannel Fulfillment Retrofits | +0.8% | North America, Europe, Australia | Medium term (2–4 years) |
| Bulk-Basket Shopping Demand | +0.7% | North America, Gulf Cooperation Council, Southeast Asia | Short term (≤ 2 years) |
| Durable Hybrid Cart Adoption | +0.5% | Global urban retail markets | Medium term (2–4 years) |
Restraints
Steel-intensive cart construction exposes manufacturers directly when input costs rise faster than contracted selling prices. In the United States, the Section 232 tariff on steel and aluminum imports rose to 25% on March 12, 2025, and then to 50% on June 4, 2025. By late May, domestic hot-rolled-coil pricing had increased approximately 31% from the tariff announcement period, compressing manufacturer margins immediately.
For a standard wire-basket cart, a sustained 10 to 20% increase in steel-related input prices can compress gross margin by roughly 200 to 500 basis points where annual retail contracts lack metal-index pass-through clauses. This dynamic justifies a -1.1% deduction from the 5.4% baseline CAGR. Store Capital Expenditure Deferrals, Online Grocery Substitution, Retailer Procurement Consolidation, and Municipal Space Constraints subtract a further -0.8%, -0.6%, -0.5%, and -0.3% respectively.
| Restraint | (~) % Impact on CAGR Forecast | Geographic Relevance | Impact Timeline |
|---|---|---|---|
| Steel Input Cost Shock | -1.1% | United States, Canada, import-dependent markets | Short term (≤ 2 years) |
| Store Capital Expenditure Deferrals | -0.8% | Europe, North America, selected emerging markets | Short term (≤ 2 years) |
| Online Grocery Substitution | -0.6% | North America, Western Europe, East Asia | Medium term (2–4 years) |
| Retailer Procurement Consolidation | -0.5% | Global chain-retail markets | Medium term (2–4 years) |
| Municipal Space Constraints | -0.3% | Dense urban markets in Europe and Asia-Pacific | Medium term (2–4 years) |
Challenges
Cart theft, abandonment beyond store boundaries, and off-premise damage shorten usable fleet life without triggering replacement orders at the original product specification. A retailer operating several hundred carts can experience annual loss or irreparable-damage rates in the mid-single digits. A 5% loss rate across a 500-unit fleet requires replacement of approximately 25 carts annually before normal wear-related renewals occur. This diverts retailer budgets toward asset-control infrastructure rather than fleet expansion.
Anti-theft systems including wheel locks, radio-frequency identification, geofencing, and reinforced chassis reduce loss but add hardware, installation, and systems-integration costs that independent grocers with small fleets struggle to absorb. The estimated -0.8% friction drag from Theft and Asset Loss reflects this budget diversion. Fragmented Component Supply, Smart Cart Reliability, Corrosion and Maintenance Burden, and Cross-Border Compliance Variation add a further -0.6%, -0.5%, -0.4%, and -0.3% to CAGR friction pressure.
| Challenge | (~) % CAGR Friction Drag | Geographic Relevance | Mitigation Horizon |
|---|---|---|---|
| Theft and Asset Loss | -0.8% | North America, Europe, Latin America, urban retail markets | Medium term (2–4 years) |
| Fragmented Component Supply | -0.6% | Global manufacturing supply chains | Medium term (2–4 years) |
| Smart Cart Reliability | -0.5% | North America, Europe, East Asia | Long term (≥ 4 years) |
| Corrosion and Maintenance Burden | -0.4% | Coastal, humid, and high-turnover retail markets | Medium term (2–4 years) |
| Cross-Border Compliance Variation | -0.3% | Europe, North America, Middle East, Asia-Pacific | Long term (≥ 4 years) |
Opportunities
Smart cart platform deployment remains an untapped revenue source because most retail fleets still use conventional carts and pilots have not converted into standardized multi-site procurement programs. A scaled platform combines item recognition, digital payment, store navigation, loyalty integration, and loss-prevention alerts, converting a one-time equipment sale into recurring hardware, software, and analytics revenue. Reducing hardware cost per unit by roughly 20 to 30% through scale and modular electronics could add approximately +1.4% above the 5.4% baseline CAGR.
Fleet-as-a-Service contracts offer a further +0.9% potential CAGR upside by converting capital procurement into subscription relationships that generate predictable recurring revenue for manufacturers. Recycled Polymer Premium Lines, Micro-Fulfillment Cart Systems, and Accessibility-Focused Designs add +0.7%, +0.6%, and +0.5% respectively. Early movers in Fleet-as-a-Service and recycled materials will establish long-term retailer contracts before these models become standard procurement expectations in Europe, Japan, and North America.
| Opportunity | (~) % Potential CAGR Upside | Geographic Relevance | Execution Window |
|---|---|---|---|
| Smart Cart Platform Monetization | +1.4% | North America, Western Europe, East Asia, Gulf Cooperation Council | Medium term (2–4 years) |
| Fleet-as-a-Service Contracts | +0.9% | North America, Europe, Australia, urban Asia | Medium term (2–4 years) |
| Recycled Polymer Premium Lines | +0.7% | Europe, Japan, South Korea, North America | Medium term (2–4 years) |
| Micro-Fulfillment Cart Systems | +0.6% | Dense metropolitan markets globally | Long term (≥ 4 years) |
| Accessibility-Focused Designs | +0.5% | North America, Europe, developed Asia-Pacific | Medium term (2–4 years) |
Key Company Insights
Cart.com reached a post-money valuation of USD 1.6 Billion in May 2025 following an additional USD 50 Million funding round, bringing cumulative capital raised to USD 475 Million. The company expanded its logistics network from 13 to 18 omnichannel facilities totaling more than 10 Million square feet. In May 2026, Target launched fully recyclable All Plastic Carts, signaling that sustainability-led cart redesign is becoming a procurement requirement rather than a premium option.
Wanzl GmbH & Co. KGaA operates as a global cart manufacturing leader with production and distribution infrastructure across Europe, North America, and Asia-Pacific. Its broad geographic footprint and multi-format product portfolio reduce exposure to single-region procurement downturns. The IMF projected global growth to slow from 3.3% in 2024 to 3.2% in 2025 and 3.1% in 2026, a macroeconomic trajectory that puts pressure on retail capital expenditure budgets and directly affects fleet procurement timing across Wanzl’s key markets.
Key Players
- Wanzl GmbH & Co. KGaA
- Caddie S.A.
- Unarco Industries LLC
- Technibilt Ltd.
- National Cart Co.
- Americana Companies
- R.W. Rogers Company
- Versacart Systems, Inc.
- R&B Wire Products, Inc.
- Sambocorp
- Suzhou Hongyuan Business Equipment Manufacturing Co., Ltd.
- Kailiou Commercial Equipment Co., Ltd.
- Cefla S.C.
- Marsanz S.A.
Recent Developments
- September 2025 – A2Z Cust2Mate secured a USD 55 Million purchase order from Yochananof for deployment of 5,000 Cust2Mate 3.0 smart shopping carts, with rollout scheduled for completion by the end of 2026, covering up to 250 carts per large store and 100 carts per medium-sized site.
- June 2025 – A2Z Cust2Mate secured an initial order worth more than USD 25 Million from Trixo for 3,000 Cust2Mate 3.0 smart carts for Latin American and Mexican retail deployment beginning Q1 2026, with a recurring-revenue agreement applying monthly charges per unit for at least 36 months.
- September 2025 – A2Z Cust2Mate priced an upsized and oversubscribed public offering of 5,625,000 shares at USD 8.00 per share, expected to generate approximately USD 45 Million in gross proceeds for smart-cart manufacturing, deployment, sales, and working capital.
- January 2026 – A2Z Cust2Mate Solutions Corp. secured a USD 15 Million smart shopping cart contract with Toys “R” Us Israel and The Red Pirate to supply and manage 2,000 smart carts equipped with localized promotional capabilities.
- April 2026 – A2Z Cust2Mate expanded its global commercial operations by closing a five-year, USD 50 Million platform agreement with Carrefour Israel to deploy 4,000 automated smart carts across their retail networks.
- January 2026 – Amazon announced the broad rollout of its upgraded Dash Cart hardware models to more than 25 Whole Foods Market locations through the end of 2026 to augment cashierless checkout operations.
Report Scope
| Report Features | Description |
|---|---|
| Market Value (2025) | USD 2.4 Billion |
| Forecast Revenue (2035) | USD 4.0 Billion |
| CAGR (2026-2035) | 5.4% |
| Base Year for Estimation | 2025 |
| Historic Period | 2020-2024 |
| Forecast Period | 2026-2035 |
| Report Coverage | Revenue Forecast, Market Dynamics, Market Opportunity Analysis, Technology and Innovation Landscape, Competitive Landscape, Recent Developments |
| Segments Covered | By Type (Traditional Shopping Carts, Smart Shopping Carts), By Product Type (Standard Basket Carts, Roller Baskets, Child Carts, Flatbed and Cargo Carts, Specialty Carts, Other Product Types), By Material (Metal and Wire, Stainless Steel, Plastic, Plastic Hybrid, Aluminum, Other Materials), By Capacity (Up To 100 Litres, 100 to 200 Litres, Above 200 Litres), By Wheel Configuration (Four-Wheel Carts, Three-Wheel Carts), By Distribution Channel (Offline Retail, Online Sales) |
| Regional Analysis | North America (US and Canada), Europe (Germany, France, The UK, Spain, Italy, and Rest of Europe), Asia Pacific (China, Japan, South Korea, India, Australia, and Rest of APAC), Latin America (Brazil, Mexico, and Rest of Latin America), Middle East and Africa (GCC, South Africa, and Rest of MEA) |
| Competitive Landscape | Wanzl GmbH & Co. KGaA, Caddie S.A., Unarco Industries LLC, Technibilt Ltd., National Cart Co., Americana Companies, R.W. Rogers Company, Versacart Systems, Inc., R&B Wire Products, Inc., Sambocorp, Suzhou Hongyuan Business Equipment Manufacturing Co., Ltd., Kailiou Commercial Equipment Co., Ltd., Cefla S.C., Marsanz S.A. |
| Customization Scope | Customization for segments, region/country-level will be provided. Additional customization can be done based on requirements. |
| Purchase Options | We have three licenses to opt for: Single User License, Multi-User License (Up to 5 Users), Corporate Use License (Unlimited User and Printable PDF) |





































