


Report Overview
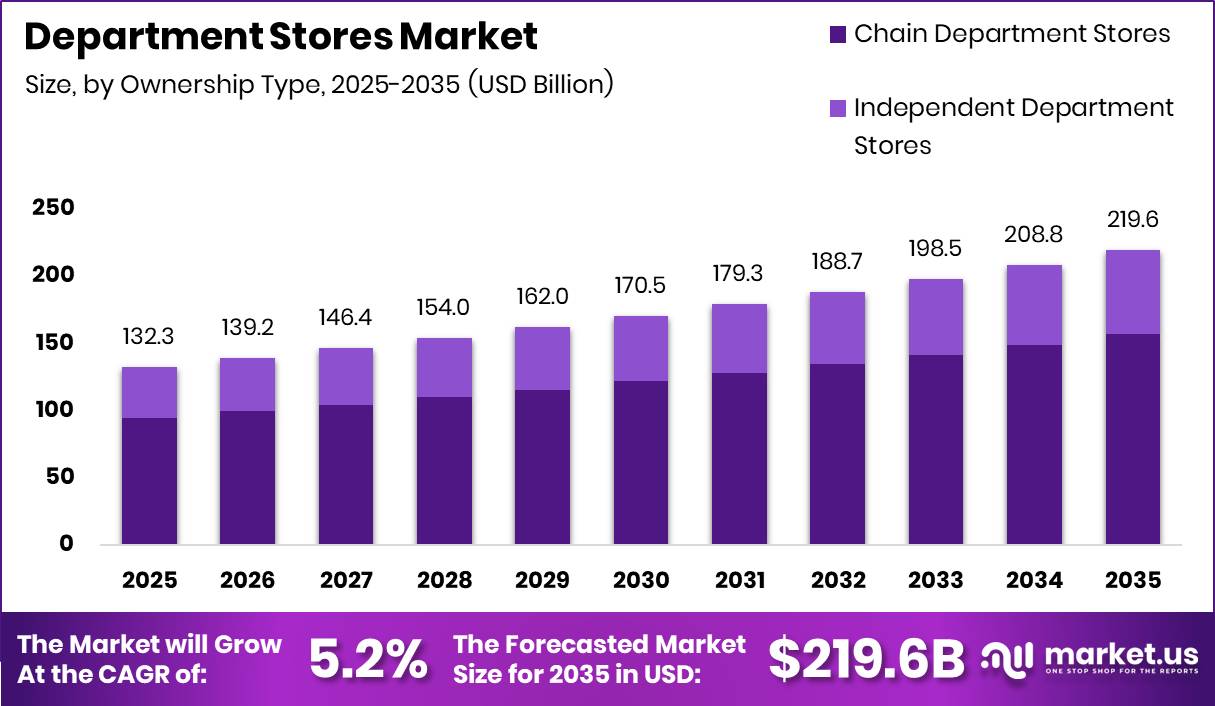
Global Department Stores Market size is expected to be worth around USD 219.6 Billion by 2035 from USD 132.3 Billion in 2025, growing at a CAGR of 5.2% during the forecast period 2026 to 2035. Asia-Pacific leads this expansion with a 36.90% regional share, valued at USD 48.8 Billion. This growth positions the format as a resilient retail channel despite structural pressures in mature Western markets.
The department store market encompasses large-format retail establishments that sell multiple product categories under one roof. These categories span apparel, beauty, home goods, electronics, and accessories. Stores operate under full-line, discount, luxury, and specialty formats, serving mass market, premium, and family consumer segments across owned, chain, and independent ownership structures.
Key Takeaways
- Global Department Stores Market was valued at USD 132.3 Billion in 2025 and is forecast to reach USD 219.6 Billion by 2035.
- The market grows at a CAGR of 5.2% during the forecast period 2026 to 2035.
- By Store Format, Full-Line Department Stores dominate with a 58.60% share.
- By Product Category, Apparel and Fashion leads with a 42.30% share.
- By Ownership Type, Chain Department Stores hold a 71.40% share.
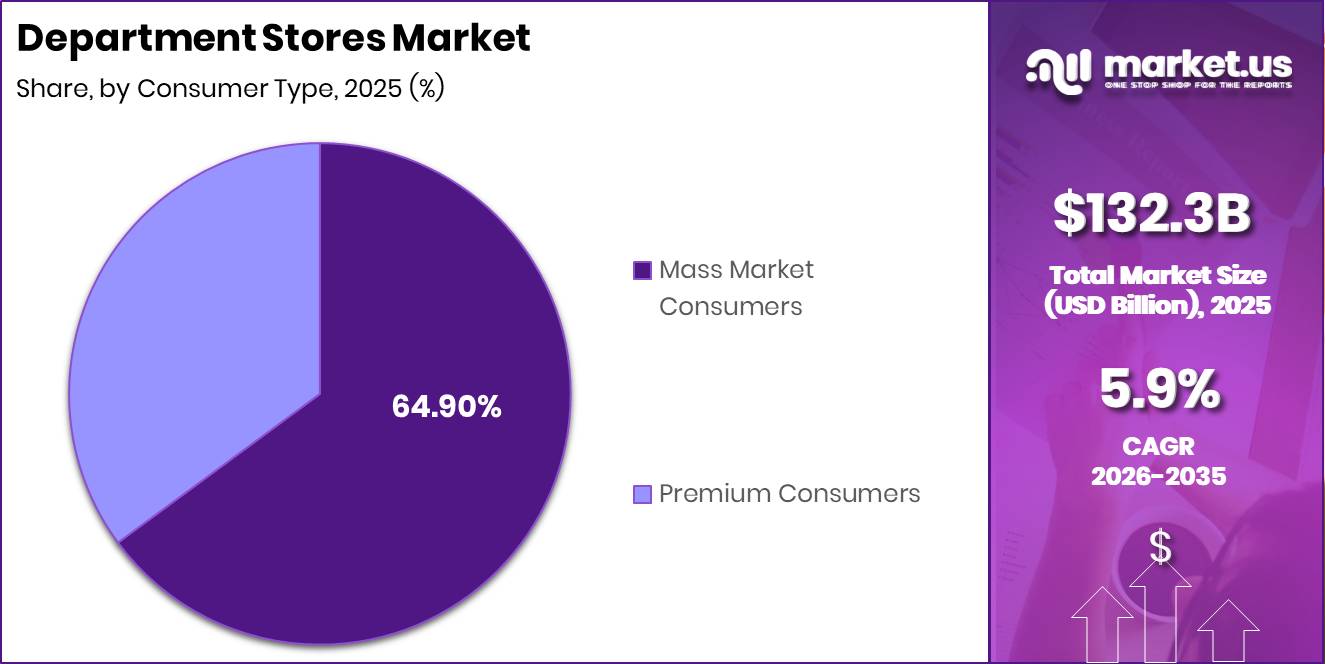
- By Consumer Type, Mass Market Consumers account for a 64.90% share.
- By Gender, Female Consumers represent a 55.70% share.
- By Age Group, the 25 to 44 Years segment holds a 47.20% share.
- By Distribution Channel, Offline Stores command a 76.80% share.
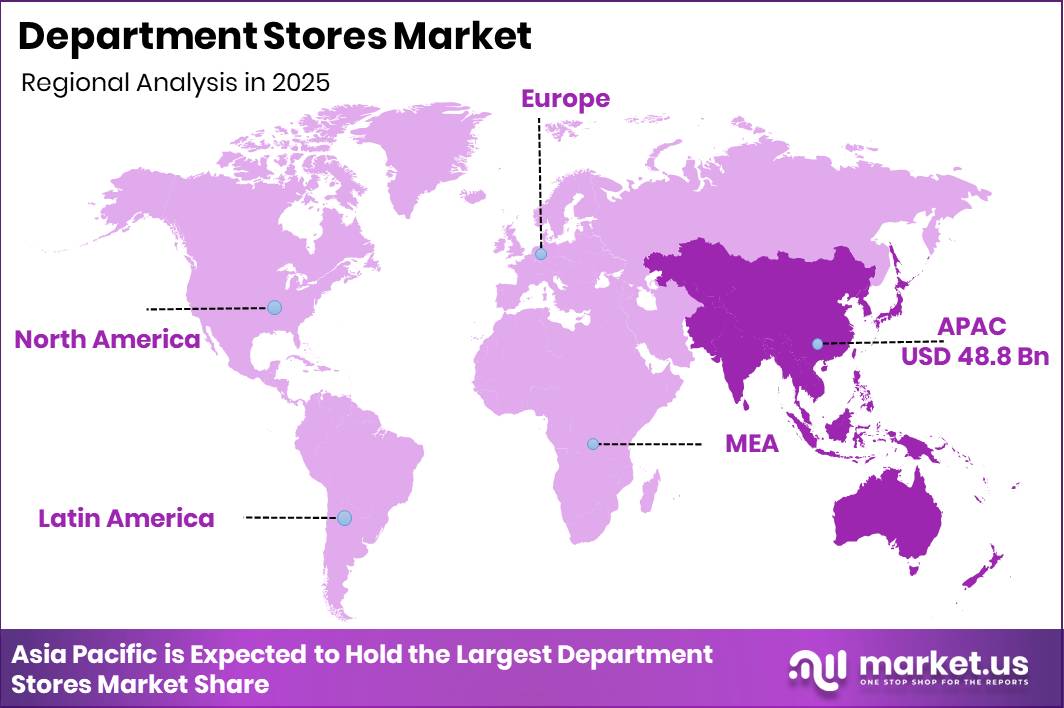
- Asia-Pacific dominates regionally with a 36.90% share, valued at USD 48.8 Billion.
According to ICSC, 91% of consumers planned to shop during the 2025 holiday season. This scale of planned participation signals that consumer intent remained strong even under macroeconomic stress. Department store operators that aligned inventory and promotions with this intent held a structural advantage over less prepared competitors.
ICSC found that holiday retail sales growth was forecast at 3.5% to 4.0% for the 2025 season. This projected range outpaced underlying inflation expectations in discretionary categories. Retailers with flexible pricing architectures and broad category depth were best positioned to capture this spending above baseline growth.
As reported by Reuters, U.S. retail sales rose 0.6% month-over-month in June 2025, while core retail sales climbed 0.5% over the same period. These figures confirm that consumer spending remained active through mid-year despite cost pressures. Department stores with strong in-store traffic models benefited directly from this sustained purchase activity.
Store Format Analysis
Full-Line Department Stores dominates with 58.60% due to broad category depth and brand concentration.
In 2025, Full-Line Department Stores held a dominant market position in the By Store Format segment of the Department Stores Market, with a 58.60% share. These stores offer the widest category assortment, anchoring major retail destinations globally. As per our research, NRF estimated 2025 holiday retail sales would surpass $1 trillion for the first time, confirming that full-line operators sit at the center of peak consumer spending cycles and carry the greatest revenue capture potential.
Discount Department Stores represent the fastest-growing sub-segment within the format category. Their value-driven positioning attracts cost-sensitive consumers who trade down during periods of economic stress. As per our research, more than 8,000 U.S. chain retail stores closed during 2025, and discount formats absorbed a share of the displaced shopper base by offering accessible price points that traditional full-line operators could not match without margin damage.
Luxury Department Stores operate in a structurally separate tier, competing primarily on brand exclusivity and high-margin concession arrangements. Their customer base is less price-elastic, making them resilient during economic downturns. This segment captures premium-floor categories including cosmetics, watches, and fashion accessories, which generate outsized margin contribution relative to their physical footprint within the store.
Specialty Department Stores focus on defined product verticals rather than full-category breadth. This focus allows tighter inventory discipline and clearer brand positioning. By contrast, their narrower assortment limits total basket size per visit, which constrains average revenue per transaction compared to full-line operators. Luxury and Specialty formats together hold the remaining share not captured by Full-Line and Discount sub-segments.
Product Category Analysis
Apparel and Fashion dominates with 42.30% due to repeat purchase frequency and high margin contribution.
In 2025, Apparel and Fashion held a dominant market position in the By Product Category segment of the Department Stores Market, with a 42.30% share. This category drives floor traffic and anchors promotional calendars across all store formats. Its high SKU count and seasonal replenishment cycles make it the primary revenue generator in both full-line and specialty department store formats globally.
Beauty and Personal Care is the fastest-growing product category within the department store format. Its growth reflects the shift toward premium skincare and prestige cosmetics consumption across Asia-Pacific and North America. This category benefits from high replenishment frequency, strong brand loyalty, and low markdown risk compared to fashion apparel, making it a structurally superior margin contributor per square foot of floor allocation.
Home and Living serves a functionally distinct consumer need, anchoring longer purchase decision cycles and higher average transaction values. This sub-category performs strongest during household formation periods and renovation cycles. Its performance is sensitive to housing market conditions, meaning operators in markets with active residential construction pipelines derive stronger Home and Living revenues than those in stagnant property markets.
Electronics operates as a traffic-driving category rather than a margin leader within the department store format. Its low gross margins require volume throughput to justify floor allocation. By contrast, Others, including accessories and gifting products, hold the remaining category share and generate strong seasonal performance concentrated around key retail calendar events including holidays and celebrations.
Ownership Type Analysis
Chain Department Stores dominates with 71.40% due to scale advantages in procurement and marketing.
In 2025, Chain Department Stores held a dominant market position in the By Ownership Type segment of the Department Stores Market, with a 71.40% share. Chains benefit from centralized buying, shared technology infrastructure, and national marketing reach that independent operators cannot replicate. This concentration of ownership creates significant barriers to entry and gives chain operators substantial leverage in brand concession negotiations and real estate sourcing.
Independent Department Stores hold the remaining ownership share outside the chain segment. These operators compete through localized curation, community relationships, and flexible store formats that large chains find difficult to replicate. However, their limited purchasing scale and higher per-unit cost structures expose them to margin pressure in competitive retail environments where chain operators use volume discounts to subsidize pricing strategies.
Consumer Type Analysis
Mass Market Consumers dominates with 64.90% due to volume-driven purchasing and price sensitivity.
In 2025, Mass Market Consumers held a dominant market position in the By Consumer Type segment of the Department Stores Market, with a 64.90% share. As reported by Deloitte, 77% of surveyed shoppers expected higher prices on holiday goods in 2025, signaling that price sensitivity within this segment intensified. Department stores that responded with clear value promotions and private label alternatives retained mass market footfall more effectively than those relying on full-price positioning.
Premium Consumers represent the fastest-growing consumer segment within the department store format. Deloitte found that 57% of consumers expected the economy to weaken within the next six months, yet premium spending showed relative resilience. This reflects a bifurcation in consumer behavior where aspirational shoppers continue to allocate discretionary income toward perceived value upgrades, creating a durable growth pathway for department stores with strong luxury and prestige category offerings.
Gender Analysis
Female Consumers dominates with 55.70% due to higher purchase frequency across apparel and beauty.
In 2025, Female Consumers held a dominant market position in the By Gender segment of the Department Stores Market, with a 55.70% share. This demographic drives disproportionate spending across apparel, beauty, and home categories, which collectively represent the highest-margin and highest-frequency purchase occasions within the department store format. Retailers who optimize floor layouts and loyalty programs around female shopper journeys generate superior basket sizes and repeat visit rates.
Male Consumers represent the fastest-growing gender segment within department stores. This growth reflects expanding product offerings in menswear, grooming, and lifestyle categories that have historically been underdeveloped relative to female-targeted floor allocations. Unisex and Family Shoppers hold the remaining gender segment share, contributing meaningfully during seasonal peaks and representing a high-value target for family-oriented promotional strategies.
Age Group Analysis
25 to 44 Years dominates with 47.20% due to peak household spending and brand engagement.
In 2025, the 25 to 44 Years segment held a dominant market position in the By Age Group segment of the Department Stores Market, with a 47.20% share. This cohort represents peak earning and household formation stages, driving sustained spending across apparel, home, and beauty categories. According to NRF, as of early December 2025, consumers had completed 51% of their holiday shopping on average, and this age group accounted for the largest portion of that purchasing activity given their concentrated discretionary budget and family gift-giving obligations.
The 18 to 24 Years segment is the fastest-growing age group within the department store channel. This cohort responds strongly to experiential retail formats, social commerce integration, and sustainability credentials. Retailers that invest in store environments and digital touchpoints tailored to younger adult shoppers position themselves to capture this group before loyalty patterns solidify around competing specialty or direct-to-consumer alternatives.
The 45 to 64 Years segment represents a high-value, stability-oriented consumer base. This group shows stronger brand loyalty and higher average transaction values than younger segments. The 65 and above segment holds the remaining age group share and responds well to premium service levels, accessibility features, and curated product selection that prioritizes ease of navigation over broad SKU breadth.
Distribution Channel Analysis
Offline Stores dominates with 76.80% due to physical experience and immediate product access.
In 2025, Offline Stores held a dominant market position in the By Distribution Channel segment of the Department Stores Market, with a 76.80% share and represented the fastest-growing channel. According to ICSC, 92% of holiday shoppers planned to spend money in physical stores during the 2025 holiday season. This near-universal physical shopping intent confirms that the in-store format retains an irreplaceable role in consumer purchase journeys, particularly during high-value seasonal spending periods.
Online Channels represent the non-dominant but strategically critical distribution layer. ICSC indicates that 52% of consumers planned to use Buy Online, Pick Up In Store (BOPIS) during the 2025 holiday season. This behavior directly validates the omnichannel model: digital channels initiate demand while physical stores complete fulfillment. As per our research, 186.9 million consumers were expected to shop during the Thanksgiving-to-Cyber Monday period in 2025, demonstrating the scale of integrated online-to-offline shopping flows that department stores must support to remain competitive.
Key Market Segments
By Store Format
- Full-Line Department Stores
- Discount Department Stores
- Luxury Department Stores
- Specialty Department Stores
By Product Category
- Apparel and Fashion
- Beauty and Personal Care
- Home and Living
- Electronics
- Others
By Ownership Type
- Chain Department Stores
- Independent Department Stores
By Consumer Type
- Mass Market Consumers
- Premium Consumers
By Gender
- Female Consumers
- Male Consumers
- Unisex/Family Shoppers
By Age Group
- 25 to 44 Years
- 18 to 24 Years
- 45 to 64 Years
- 65 and above Years
By Distribution Channel
- Offline Stores
- Online Channels (Omnichannel)
Regional Analysis
Asia-Pacific Dominates the Department Stores Market with a Market Share of 36.90%, Valued at USD 48.8 Billion
Asia-Pacific leads the global Department Stores Market with a 36.90% share valued at USD 48.8 Billion and holds the fastest-growing regional position. The region benefits from a concession-driven store model that insulates operators from inventory risk while generating EBIT margins of 6 to 10% on luxury floorspace. Rising middle-class spending across India, Indonesia, Thailand, and a recovering China reinforces this structural advantage.
North America represents the largest mature market within the global department store landscape. According to NRF, Black Friday 2025 attracted 80.3 million in-store shoppers, and actual participation during the 2025 Thanksgiving holiday weekend reached 202.9 million shoppers, a new operational demand record. In March 2026, Dillard’s opened a new department store at Fairfield Commons in Ohio, occupying a former Macy’s location and signaling selective physical expansion in underserved suburban markets.
Europe maintains a substantial department store presence anchored by flagship retail destinations in major capital cities. Western European operators face sustained structural headwinds from e-commerce displacement and high commercial real estate costs. By contrast, premium and luxury department store formats in the UK, France, and Germany continue to attract international tourism spending, which partially offsets declining domestic footfall in traditional full-line store configurations.
Key Regions and Countries
North America
- US
- Canada
Europe
- Germany
- France
- The UK
- Spain
- Italy
- Rest of Europe
Asia Pacific
- China
- Japan
- South Korea
- India
- Australia
- Rest of APAC
Latin America
- Brazil
- Mexico
- Rest of Latin America
Middle East and Africa
- GCC
- South Africa
- Rest of MEA
Market Dynamics
Market Opportunity Analysis - Underpenetrated regions and underexploited store formats offer clear entry points for investors and new operators
Asia-Pacific holds the dominant regional position with a 36.90% share and is also the fastest-growing region, yet significant white space remains within its tier-two and tier-three urban markets. Department store density in secondary cities across India, Indonesia, and Vietnam remains far below levels seen in established metros. Operators that extend format rollouts beyond gateway cities access a structurally larger, less contested consumer pool at lower real estate costs.
Discount Department Stores represent the fastest-growing store format sub-segment yet capture a smaller share of total format revenue compared to Full-Line operators. This gap signals an undersupplied value retail layer in markets where consumer price sensitivity is intensifying. New entrants that build cost-efficient discount department store models in North America and Western Europe can absorb displaced shoppers from closing full-line locations without competing directly on luxury or brand-prestige positioning.
The 18 to 24 Years age segment is the fastest-growing consumer cohort within the department store channel but holds a smaller revenue share than the 25 to 44 Years dominant group. This gap reflects current underinvestment in store formats, product categories, and digital engagement tools tailored to younger adults. Operators that design dedicated experiences for this cohort now build loyalty before spending patterns consolidate around specialty or B2C e-commerce alternatives in later life stages.
Premium Consumers are the fastest-growing consumer type yet remain secondary in revenue contribution to Mass Market Consumers. This bifurcation creates a targeted opportunity in mid-market stores that can selectively upgrade category mix and in-store service levels to migrate existing mass market shoppers toward premium tiers. Stores in Latin America and the Middle East and Africa regions carry the highest potential for this upward migration given their younger, aspirationally oriented consumer demographics.
Technology and Innovation Landscape - AI, omnichannel fulfillment, and data infrastructure define the next competitive divide in department store retail
AI-driven demand forecasting is the most commercially impactful technology available to department store operators today. Early adopters report markdown depth reductions of 15 to 25% and end-of-season carryover cuts of 20 to 30%. These gains translate directly to gross margin recovery on a format where annual markdown-related leakage runs at 300 to 600 basis points. Operators that deploy these systems in the next two years create a widening performance gap over those that delay.
Omnichannel integration, specifically click-and-collect and BOPIS capability, adds a projected +1.4% to the global CAGR forecast for the department store market. This technology layer converts digital browsing intent into physical store visits, protecting footfall while expanding addressable transaction volume. Department stores that lack unified inventory visibility across online and offline channels cannot execute this model effectively and lose transaction completion to competitors who can.
Retail media networks represent a data monetization opportunity that requires investment in smart retail infrastructure including in-store sensors, loyalty data platforms, and unified customer identity systems. Department stores hold a structural advantage in this space because their physical footfall generates first-party behavioral data at a scale that pure-play e-commerce competitors cannot replicate. Operators that build retail media capabilities convert existing traffic into incremental advertising revenue streams with near-zero marginal cost.
AI-driven personalization and dynamic loyalty program adoption carry a +0.6% CAGR contribution for the global department store market. Personalization engines use purchase history, browsing behavior, and demographic signals to serve individualized offers at scale. This technology reduces customer acquisition costs and increases repeat visit frequency, directly improving the lifetime value of the loyal shopper base that full-line department stores depend on for their revenue stability.
Drivers
Asia-Pacific luxury and premium retail expansion is the most active near-term revenue driver for department stores globally. Mainland China is projected to record 13% luxury spending growth in 2026, while India is forecast to expand at 20%. Indonesia and Thailand each post double-digit luxury consumption growth simultaneously, generating material incremental demand for the premium-floor categories that contribute 40 to 60% of gross margin in full-line stores.
Omnichannel integration and AI-driven personalization are reshaping how department stores acquire and retain customers. Experiential retail transformation, including in-store events, services, and food and beverage offerings, adds a further +1.1% to the CAGR forecast. Private label and exclusive brand portfolios expand margins in North America, Europe, and India, while rising middle-class spending across Southeast Asia and Latin America extends the addressable consumer base for the format.
| Driver | (~) % Impact on CAGR Forecast | Geographic Relevance | Impact Timeline |
|---|---|---|---|
| Asia-Pacific Luxury & Premium Retail Expansion Driving Department Store Revenue | +1.8% | China, India, Japan, South Korea, Southeast Asia | Short term (≤ 2 years) |
| Omnichannel Integration & Click-and-Collect Capability Enhancing Store Relevance | +1.4% | North America, Western Europe, East Asia | Short term (≤ 2 years) |
| Experiential Retail Transformation (In-Store Events, Services, F&B) | +1.1% | Global, led by North America, UK, Japan, Gulf Cooperation Council | Medium term (2–4 years) |
| Private Label & Exclusive Brand Portfolio Margin Expansion | +0.9% | North America, Europe, India | Medium term (2–4 years) |
| Rising Middle-Class & Urban Consumer Spending in Emerging Markets | +0.7% | India, Southeast Asia, Middle East & Africa, Latin America | Medium term (2–4 years) |
| AI-Driven Personalization & Dynamic Loyalty Program Adoption | +0.6% | North America, Western Europe, East Asia | Short term (≤ 2 years) |
Restraints
The structural contraction of department stores in the United States and Western Europe directly suppresses global growth. IBISWorld data shows the U.S. department store sector contracted at a CAGR of -0.3% between 2021 and 2026, with a further -0.5% dip projected for 2026 alone. The total number of full-line department store operating businesses in the U.S. has contracted to approximately 49 entities as of 2026. This negative revenue mass in mature markets offsets growth from Asia-Pacific and emerging regions.
U.S. tariff-driven merchandise cost inflation and high commercial real estate burdens compound this structural pressure. Profit as a percentage of revenue has stabilized at approximately 6.0% in 2026, compressed by markdown cycles and rising state-level wage floors now at $15 to $20 per hour across key retail states. Consumer migration to specialty e-commerce and direct-to-consumer channels removes the remaining discretionary spend share. Retail shrinkage and organized retail crime add a further -0.6% CAGR friction drag across the U.S., UK, and Canada.
| Restraint | (~) % Impact on CAGR Forecast | Geographic Relevance | Impact Timeline |
|---|---|---|---|
| Structural Decline of U.S. & European Department Store Footfall & Revenue | -2.0% | United States, United Kingdom, Germany, France | Short term (≤ 2 years) |
| U.S. Tariff-Driven Merchandise Cost Inflation Eroding Consumer Purchasing Power | -1.4% | United States, Canada | Short term (≤ 2 years) |
| High Commercial Real Estate & Lease Cost Burden on Legacy Store Portfolios | -1.0% | North America, Western Europe, Japan | Medium term (2–4 years) |
| Consumer Shift to Specialty E-Commerce & Direct-to-Consumer Brand Channels | -0.8% | Global, most acute in North America & Western Europe | Short term (≤ 2 years) |
| Retail Shrinkage & Organized Retail Crime Margin Impact | -0.6% | United States, UK, Canada | Short term (≤ 2 years) |
Challenges
Chronic inventory mismanagement is the most pervasive operational drag across the department store format globally. A full-line department store may manage between 50,000 and 200,000 active SKUs concurrently. Seasonal apparel, which accounts for 35 to 45% of total SKU count, carries the most acute markdown exposure, with end-of-season clearance discounts averaging 40 to 60% off original price and estimated gross margin leakage of 300 to 600 basis points annually for operators without AI-driven replenishment systems.
Tariff-driven merchandise cost inflation of 6 to 10% on apparel import categories worsens markdown consequences in 2025 and 2026. Early-adopter operators that deploy AI-native demand forecasting report markdown depth reductions of 15 to 25% and end-of-season carryover cuts of 20 to 30%. This creates a performance gap between technology-enabled operators and those still relying on manual planning. Workforce retention, legacy IT modernization, and sustainability compliance add further friction across North America, Europe, and Asia-Pacific.
| Challenge | (~) % CAGR Friction Drag | Geographic Relevance | Mitigation Horizon |
|---|---|---|---|
| Inventory Management & Markdown Cycle Drag | -1.5% | Global, most acute in North America & Europe | Medium term (2–4 years) |
| Workforce Retention & Skilled Retail Talent Deficit | -1.1% | North America, Western Europe, Japan | Long term (≥ 4 years) |
| Brand Concession Dependency & Negotiation Power Erosion | -0.9% | Global, particularly Asia-Pacific concession-model operators | Medium term (2–4 years) |
| Legacy IT & Data Infrastructure Modernization Lag | -0.8% | North America, Europe, legacy-format Asia operators | Long term (≥ 4 years) |
| Sustainability & Circular Retail Compliance Friction | -0.6% | European Union, UK, California, Australia | Medium term (2–4 years) |
Opportunities
The store-within-a-store model remains substantially unexploited as a deliberate revenue stream across the global department store estate. Fewer than 20 to 25% of U.S. full-line department store locations had formalized third-party branded shop-in-shop programs as of 2025. Under a revenue-share arrangement, operators generate 20 to 30% commission on brand-managed sales with minimal markdown exposure. This model converts underperforming floorspace into near-zero-inventory-risk rental income of $80 to $200 per square foot annually from premium tenants.
Retail media networks, resale and pre-owned luxury integration, and Gulf and South Asian luxury rollouts each offer incremental CAGR upside of +1.5%, +1.2%, and +1.0% respectively. Dark store repurposing of underperforming U.S., UK, Canadian, and Australian locations adds a further +0.7% potential. Operators that execute across multiple opportunity vectors in the next 24 to 36 months build compounding structural advantages before rivals establish equivalent platform capabilities.
| Opportunity | (~) % Potential CAGR Upside | Geographic Relevance | Execution Window |
|---|---|---|---|
| Store-Within-a-Store & Third-Party Brand Rental Monetization | +1.9% | North America, Europe, Asia-Pacific | Short term (≤ 2 years) |
| Retail Media Network & In-Store Data Monetization | +1.5% | North America, Western Europe, Japan, South Korea | Medium term (2–4 years) |
| Resale & Pre-Owned Luxury Integration Within Store Floors | +1.2% | North America, Europe, Japan, South Korea | Medium term (2–4 years) |
| Underpenetrated Gulf & South Asian Luxury Department Store Roll-Out | +1.0% | Saudi Arabia, UAE, India, Vietnam, Indonesia | Medium term (2–4 years) |
| Dark Store & Fulfillment Hub Repurposing of Underperforming Locations | +0.7% | United States, United Kingdom, Canada, Australia | Short term (≤ 2 years) |
Key Company Insights
Macy’s operates as the largest full-line department store chain in the United States. Its scale provides procurement leverage and national brand recognition that smaller competitors cannot replicate. However, sustained store closure activity and declining sales volumes in its core U.S. footprint limit its ability to reinvest in omnichannel infrastructure at the pace required to close the gap with digitally native retail competitors.
Kohl’s demonstrates a disciplined cost management posture that distinguishes it within the challenged U.S. department store landscape. According to SEC filings, Kohl’s operated 1,153 stores as of August 2, 2025, improved gross margin to 39.9% in Q2 2025, a 28-basis-point increase year over year, and reduced SG&A expenses by 4.1% year over year, lowering operating costs to approximately $1.2 Billion. As per our research, planned holiday spending per consumer declined 1.3% versus the prior year, making Kohl’s margin efficiency a competitive shield in a tightening spending environment.
Key Players
- Macy’s
- Kohl’s
- Nordstrom
- Dillard’s
- Saks Fifth Avenue
- Bloomingdale’s
- Selfridges
- Harrods
- Galeries Lafayette
- El Corte Inglés
- Hudson’s Bay
- Marks and Spencer
- David Jones
- Myer
- Lifestyle International Pvt Ltd
Recent Developments
- May 2025 – Nordstrom, Inc. was officially taken private through a $6.25 Billion acquisition led by the Nordstrom family and Liverpool, ending its status as a publicly traded company and enabling long-term strategic restructuring outside public market reporting constraints.
Report Scope
| Report Features | Description |
|---|---|
| Market Value (2025) | USD 132.3 Billion |
| Forecast Revenue (2035) | USD 219.6 Billion |
| CAGR (2026-2035) | 5.2% |
| Base Year for Estimation | 2025 |
| Historic Period | 2020-2024 |
| Forecast Period | 2026-2035 |
| Report Coverage | Revenue Forecast, Market Dynamics, Market Opportunity Analysis, Technology and Innovation Landscape, Competitive Landscape, Recent Developments |
| Segments Covered | By Store Format (Full-Line Department Stores, Discount Department Stores, Luxury Department Stores, Specialty Department Stores); By Product Category (Apparel and Fashion, Beauty and Personal Care, Home and Living, Electronics, Others); By Ownership Type (Chain Department Stores, Independent Department Stores); By Consumer Type (Mass Market Consumers, Premium Consumers); By Gender (Female Consumers, Male Consumers, Unisex/Family Shoppers); By Age Group (25 to 44 Years, 18 to 24 Years, 45 to 64 Years, 65 and above Years); By Distribution Channel (Offline Stores, Online Channels (Omnichannel)) |
| Regional Analysis | North America (US and Canada), Europe (Germany, France, The UK, Spain, Italy, and Rest of Europe), Asia Pacific (China, Japan, South Korea, India, Australia, and Rest of APAC), Latin America (Brazil, Mexico, and Rest of Latin America), Middle East and Africa (GCC, South Africa, and Rest of MEA) |
| Competitive Landscape | Macy’s, Kohl’s, Nordstrom, Dillard’s, Saks Fifth Avenue, Bloomingdale’s, Selfridges, Harrods, Galeries Lafayette, El Corte Inglés, Hudson’s Bay, Marks and Spencer, David Jones, Myer, Lifestyle International Pvt Ltd |
| Customization Scope | Customization for segments, region/country-level will be provided. Additional customization can be done based on requirements. |
| Purchase Options | We have three licenses to opt for: Single User License, Multi-User License (Up to 5 Users), Corporate Use License (Unlimited User and Printable PDF) |





































