


Report Overview
Global Functional Fitness Equipment Market size is expected to be worth around USD 17.8 Billion by 2035 from USD 8.5 Billion in 2025, growing at a CAGR of 7.7% during the forecast period 2026 to 2035. This growth reflects a durable shift in how gyms, homes, and institutions equip training spaces. This means equipment makers can plan long product cycles with confidence in sustained buyer demand.
Functional fitness equipment covers tools that train natural, multi-joint movement patterns rather than single muscles. The market groups products into bars and plates, benches, medballs, rowing machines, squat racks, kettlebells and dumbbells, and accessories. Buyers span corporate offices, health clubs, homes, hospitals, and hotels. This structure spreads demand across many end users. This creates stable revenue channels for vendors serving both commercial fleets and residential setups.
Key Takeaways
- Global market size reached USD 8.5 Billion in 2025 and will hit USD 17.8 Billion by 2035 at a CAGR of 7.7%.
- Kettlebells and Dumbbells led the By Product Type segment with a 28.4% share.
- Health Clubs dominated the By Application segment with a 47.0% share.
- Online Retail led the By Distribution Channel segment with a 28.6% share.
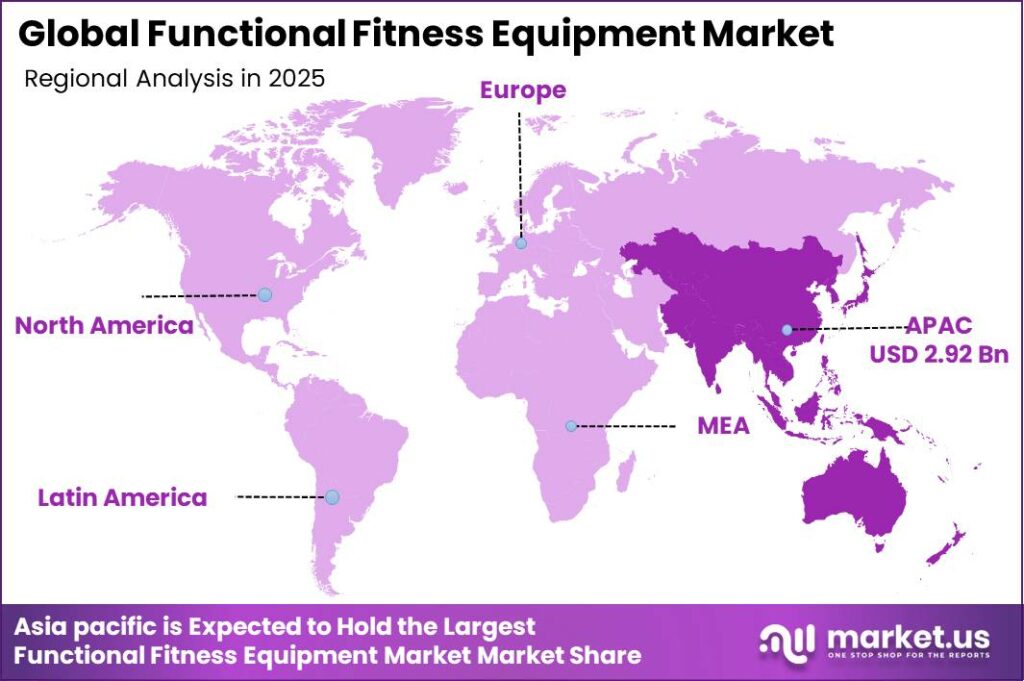
- Asia-Pacific dominated regionally with a 34.5% share, valued at USD 2.92 Billion.
Exercise Equipment Market demand feeds directly into functional training investment across every buyer group. Government health policy now shapes procurement at scale. The WHO Global Action Plan on Physical Activity sets a target to cut inactivity, pushing public and institutional gym buildouts. This means suppliers gain a policy-backed demand floor. Vendors aligned with public wellness programs can win multi-year institutional contracts ahead of competitors.
![[Functional Fitness Equipment Market ] Market Size Revenue Outlook Chart](https://market.us/wp-content/uploads/2024/10/Functional-Fitness-Equipment-Market-Market-Size-Revenue-Outlook-Chart-1024x538.jpg)
Fitness trend authority reinforces this momentum. According to ACSM, Functional Fitness Training ranked #9 among the Top 20 Worldwide Fitness Trends for 2025. This ranking signals mainstream adoption rather than a passing fad. This creates a reliable demand base that lets manufacturers commit capital to functional product lines with lower market risk.
Trend longevity strengthens the case further. Data from ACSM shows Functional Fitness Training has appeared in the Worldwide Top 20 every year since 2007. Consequently, buyers treat functional equipment as core infrastructure, not experimental gear. This means vendors can price for durability and long service life rather than fast obsolescence, protecting margins across replacement cycles.
Digital habits amplify equipment demand too. As reported by ACSM, Mobile Exercise Apps ranked #2 in 2025, supported by roughly 850 million fitness app downloads across nearly 370 million users in 2023. This app-driven engagement pushes users toward connected equipment. Therefore, makers who pair hardware with app ecosystems can capture recurring software revenue beyond the initial sale.
Product Type Analysis
Kettlebells and Dumbbells dominates with 28.4% due to versatile low-cost full-body training.
In 2025, Kettlebells and Dumbbells held a dominant market position in the By Product Type segment of Functional Fitness Equipment Market, with a 28.4% share. UN Comtrade HS code 950691 recorded global exports of weight and gym articles exceeding USD 2.4 Billion in 2023. This means high trade volume keeps unit costs low for buyers. Vendors that scale free-weight production can defend share against cheaper imports through brand and durability positioning.
Bars and Plates serve as the structural backbone of strength training floors across commercial gyms. China Customs data show fitness equipment exports under HS 9506 grew double digits annually through 2023. This means steady supply keeps racks and barbell setups affordable. Suppliers offering calibrated, competition-grade plates can command premiums over generic cast iron in serious training facilities.
Rowing Machines and Squat Racks anchor mid-format functional zones in health clubs and studios. ITC Trade Map figures show top exporters shipped over USD 1.1 Billion in fitness apparatus components in 2023. This means installation-ready equipment reaches operators reliably. Vendors bundling racks with attachments raise per-unit value and lock in accessory reorders. Flat Bench, Medballs, and Accessories together hold the remaining share as supporting category products.
Application Analysis
Health Clubs dominates with 47.0% due to high-traffic multi-user equipment fleets.
In 2025, Health Clubs held a dominant market position in the By Application segment of Functional Fitness Equipment Market, with a 47.0% share. The Health and Fitness Association reported over 64 million US gym members by 2024. This means clubs need large, durable equipment fleets to serve heavy daily use. Vendors supplying commercial-grade rigs gain repeat orders as clubs refresh floors to retain members.
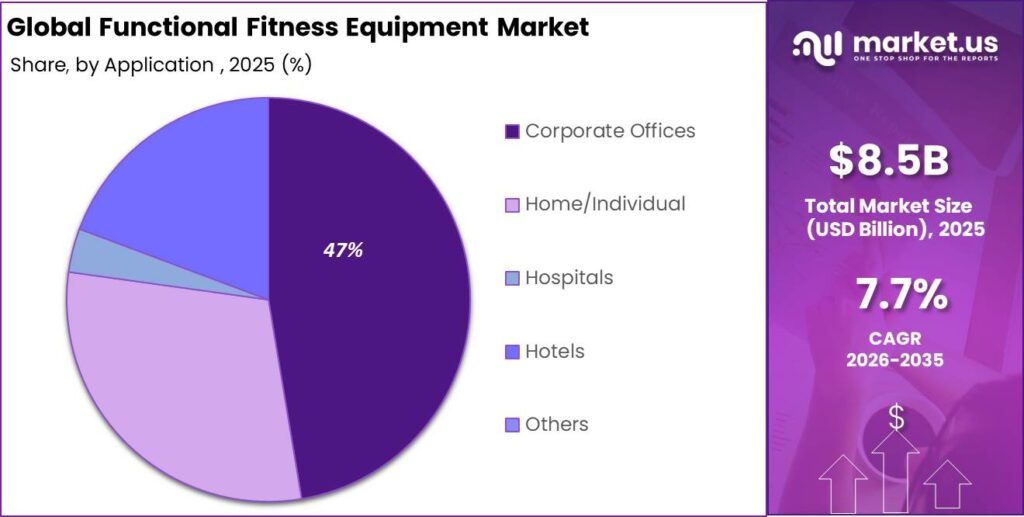
Home and Individual buyers reshaped demand after pandemic-era fitness adoption spread widely. US Census Bureau retail data tracks fitness equipment under NAICS 459130 across thousands of retailers. This means residential demand stays measurable even after peak cycles. Vendors targeting home setups with compact functional gear can rebuild volume as replacement cycles mature. In March 2025, amp Fitness installed its first 10,000 AI-powered strength systems across four US states, signaling strong home deployment potential.
Corporate Offices, Hospitals, and Hotels expand institutional demand through wellness and rehabilitation use. World Bank health expenditure data show sustained public and private wellness spending growth across major economies. This means institutional budgets support functional equipment procurement. Vendors serving B2B channels gain predictable multi-year contracts. Others hold the remaining share through niche and specialty facility installations.
Distribution Channel Analysis
Online Retail dominates with 28.6% due to direct-to-consumer reach and pricing.
In 2025, Online Retail held a dominant market position in the By Distribution Channel segment of Functional Fitness Equipment Market, with a 28.6% share. UNCTAD estimated global B2C e-commerce sales surpassed USD 5.8 Trillion in 2023. This means online channels give equipment brands wide low-cost reach. Vendors with strong e-commerce logistics can undercut traditional retail markups and win price-sensitive buyers directly.
Specialty Sports Retail Stores serve buyers who want to test equipment before committing to purchase. National statistical office retail surveys track specialty sporting goods as a distinct category across major markets. This means informed buyers still value hands-on channels. Vendors placing premium demo units in specialty stores can justify higher ASPs through in-person experience.
Institutional and Direct Sales (B2B) drive bulk procurement for gyms, offices, and clinics. WTO trade statistics confirm rising cross-border flows of commercial fitness apparatus through 2023. This means B2B channels handle large-value orders efficiently. Vendors with dedicated sales teams capture full-fleet contracts. Department Stores, Hypermarkets and Supermarkets, and Others hold the remaining share through mass-market accessory sales.
Key Market Segments
By Product Type
- Bars and Plates
- Flat Bench
- Medballs
- Rowing Machine
- Squat Rack
- Kettle-bells and Dumbbells
- Accessories
By Application
- Corporate Offices
- Health Clubs
- Home/Individual
- Hospitals
- Hotels
- Others
By Distribution Channel
- Department Stores
- Hypermarkets & Supermarkets
- Institutional/Direct Sales (B2B)
- Online Retail
- Specialty Sports Retail Stores
- Others
Regional Analysis
Asia Pacific Dominates the Functional Fitness Equipment Market with a Market Share of 34.5%, Valued at USD 2.92 Billion
Asia Pacific led the global market in 2025 with a 34.5% share, valued at USD 2.92 Billion. As per our research, rising urban gym buildouts across China, India, and Southeast Asia drive this lead. This means the region absorbs the largest share of new equipment fleets. Vendors that localize manufacturing and distribution here capture first-generation commercial gym demand before competitors scale.
North America stands as the fastest-growing region on a value basis through 2035. As per our research, dense health club networks and strong home fitness adoption sustain rapid replacement demand. This creates high-frequency reorder cycles for durable functional gear. In March 2025, amp Fitness deployed its first 10,000 AI-powered systems across California, Florida, New York, and New Jersey, signaling accelerating connected equipment demand.
Europe, Latin America, and the Middle East and Africa together hold the remaining market share. As per our research, Europe leads on aging-population rehabilitation demand while Latin America and MEA grow through first-time gym infrastructure. This means diverse regional drivers spread risk for global vendors. Suppliers with flexible regional strategies can balance mature replacement markets against high-growth emerging buildouts.
Key Regions and Countries
North America
- US
- Canada
Europe
- Germany
- France
- The UK
- Spain
- Italy
- Rest of Europe
Asia Pacific
- China
- Japan
- South Korea
- India
- Australia
- Rest of APAC
Latin America
- Brazil
- Mexico
- Rest of Latin America
Middle East and Africa
- GCC
- South Africa
- Rest of MEA
Market Dynamics
Market Opportunity Analysis - Underserved channels, home users, and emerging regions offer entry points for new players
Home and Individual buyers remain underexploited within the By Application segment, where Health Clubs hold 43.2%. As per our research, residential buyers lack tailored functional systems built for small spaces. This means a large user base stays underserved. New entrants offering compact, connected home rigs can capture this group before incumbents refocus from commercial fleets.
Specialty Sports Retail Stores stay underused against Online Retail at 28.6% in the By Distribution Channel segment. Instead of chasing crowded e-commerce, vendors can build experiential in-store demos. This means premium buyers get hands-on confidence before purchase. New players using specialty channels can justify higher ASPs and build brand trust that pure online sellers cannot match.
Asia Pacific leads regionally with 34.5%, yet first-generation gym buildouts in India and Southeast Asia stay early. As per our research, urban demand outpaces current supplier coverage. This means white space exists across fast-growing cities. Early movers establishing local distribution now can lock in commercial fleet contracts ahead of slower global competitors.
Corporate Offices and Hospitals hold minority shares within the By Application segment behind Health Clubs. Consequently, institutional wellness and rehabilitation demand stays underpenetrated. This means B2B buyers seek specialized functional solutions. New entrants building office and clinical product lines can win multi-year contracts with predictable budgets and lower discretionary volatility.
Technology and Innovation Landscape - AI coaching, connected sensors, and eco-materials redefine competitive edges
AI-enabled movement assessment now reshapes product design across the category. Technogym’s Biostrength and Biodrive systems deliver personalized resistance and real-time functional performance data. This means equipment shifts from passive tools to active coaches. Manufacturers adopting AI coaching can charge software premiums, while buyers gain measurable results that justify higher purchase prices.
Configurable all-in-one functional training rigs replace single-purpose machines across gyms and homes. Life Fitness expanded modular cable systems and SYNRGY platforms in late 2025. This means one rig now serves many training needs. Manufacturers offering modular systems raise per-unit value, while operators save floor space and cut equipment counts without losing training range.
Performance tracking sensors embedded in strength equipment turn workouts into measurable data streams. As reported by ACSM, Mobile Exercise Apps ranked #2 in 2025, showing strong appetite for connected tracking. This means sensor-equipped gear pairs naturally with apps. Manufacturers integrating sensors capture recurring subscription revenue and lock users into their ecosystems long after the hardware sale.
Eco-friendly recycled materials and low-carbon manufacturing now shape buyer choice and brand positioning. This shift responds to institutional procurement rules favoring sustainable suppliers. This means green production becomes a sales advantage. Manufacturers adopting recycled materials can win public and corporate contracts where sustainability criteria increasingly decide which vendors qualify for large orders.
Drivers
Rising global health awareness has moved fitness from a lifestyle choice to a preventive health priority. The US CDC confirmed roughly 41.9% of adults were obese in 2022, while WHO targets a 15% cut in inactivity by 2030. This means national policy now funds gym infrastructure directly. Vendors serving public and institutional buyers gain a durable, policy-backed demand base for functional equipment.
Home and commercial demand both converge on functional gear. Home setup costs rose from USD 800 to 6,000 by 2024, while US gym membership passed 64 million. Commercial functional zones cost operators USD 80,000 to 250,000 each. This means product mix shifts toward high-margin modular rigs. Vendors selling multi-user rig systems earn gross margins near 48% to 62% plus recurring accessory revenue.
| Driver | (~) % Impact on CAGR Forecast | Geographic Relevance | Impact Timeline |
|---|---|---|---|
| Rising Global Health & Preventive Wellness Consciousness Driving Commercial & Home Gym Functional Training Equipment Investment | +2.40% | United States, Europe, China, Australia, Canada, GCC, South Korea, Japan | Short term (≤ 2 years) |
| Commercial Gym & Boutique Fitness Studio Expansion Driving Institutional Functional Equipment Fleet Procurement | +1.60% | United States, United Kingdom, Germany, China, Australia, India, GCC, Brazil | Short term (≤ 2 years) |
| Corporate Wellness Programme Investment & Employer-Funded Gym Facility Buildout Driving B2B Functional Equipment Demand | +1.10% | United States, United Kingdom, Germany, Japan, Australia, Singapore, GCC | Medium term (2–4 years) |
| Ageing Population & Functional Fitness Rehabilitation Demand Driving Clinical & Senior Living Equipment Procurement | +0.85% | United States, Germany, Japan, Italy, South Korea, Australia, France, United Kingdom | Medium term (2–4 years) |
| High-Intensity Functional Training (HIFT) & CrossFit-Style Programming Adoption Driving Specialised Equipment Category Penetration | +0.72% | United States, Australia, United Kingdom, Canada, Germany, Brazil, South Korea | Short term (≤ 2 years) |
| Military, Law Enforcement & First Responder Physical Conditioning Programme Modernisation Driving Institutional Procurement | +0.42% | United States, United Kingdom, Germany, Australia, India, Israel, Canada | Medium term (2–4 years) |
Restraints
Post-pandemic demand pull-forward now suppresses residential repurchase rates. Global gym closures pushed 50 to 70 million consumers to buy home equipment inside an 18-month window. These durable items last 7 to 15 years. This means replacement demand stays near zero for years. Vendors reliant on home DTC channels face flat volume until this installed base ages out.
The correction hit US retail hardest and squeezed brand margins. US Census data showed home fitness sales fell 22% to 28% in 2022 and another 10% to 15% in 2023. Discounting cut prices 25% to 40% below peak. This means brands must pivot to B2B channels. Vendors now invest USD 2 to 8 Million yearly building commercial sales infrastructure.
| Restraint | (~) % Impact on CAGR Forecast | Geographic Relevance | Impact Timeline |
|---|---|---|---|
| Post-Pandemic Home Fitness Equipment Demand Correction & Oversupply Suppressing Near-Term Residential Replacement Purchases | -1.50% | United States, United Kingdom, Australia, Canada, Germany — high home gym penetration markets | Short term (≤ 2 years) |
| High Capital Cost of Commercial-Grade Functional Rigs & Multi-Station Systems Suppressing SME Gym & Studio Procurement | -0.85% | Global — most acute for independent boutique studio operators in emerging & mid-tier markets | Short term (≤ 2 years) |
| US Section 301 Tariffs on Chinese-Manufactured Fitness Equipment Elevating Import Cost Basis for Brands Sourcing from China | -0.65% | United States — brands with China-based manufacturing reliant on U.S. import channel | Short term (≤ 2 years) |
| Consumer Price Sensitivity & Perceived Substitutability of Low-Cost Bodyweight Training Limiting Premium Equipment ASP Realisation | -0.38% | Global — most acute in emerging markets & value-oriented consumer segments | Short term (≤ 2 years) |
Challenges
Chinese low-cost manufacturers commoditize the core product range. OEM cast iron lands at USD 0.80 to 1.50 per kg, undercutting branded gear by 40% to 65% at retail. Chinese HS 9506 exports grew 12% to 18% yearly through 2024. This means sustainable price premiums shrank to 20% to 35%. Vendors defending brands now spend USD 1.5 to 6 Million yearly on certification and endorsements.
Escaping commoditization requires a shift to software-integrated systems. Chinese OEM gaps in electronics keep a 3 to 5 year moat around connected rigs priced at USD 3,500 to 18,000. These earn margins of 52% to 68%. This means innovation creates a defensible revenue stream. Vendors investing USD 3 to 12 Million per platform can escape free-weight price wars entirely.
| Challenge | (~) % CAGR Friction Drag | Geographic Relevance | Mitigation Horizon |
|---|---|---|---|
| Chinese Low-Cost Equipment Manufacturer Competition & Platform Commoditisation | -1.10% | Global — most acute on Amazon, Alibaba, and open e-commerce marketplaces | Long term (≥ 4 years) |
| Steel & Rubber Raw Material Cost Volatility Compressing Equipment Manufacturer Margins | -0.72% | Global — most acute for manufacturers without long-term supply agreements | Medium term (2–4 years) |
| Product Safety Certification & Liability Compliance Complexity Across Fragmented Global Jurisdictions | -0.55% | European Union, United States, Australia, Canada — EN ISO 20957 & ASTM F1749 compliance markets | Long term (≥ 4 years) |
| Last-Mile Delivery & Installation Cost for Bulky Commercial Equipment Eroding Channel Margins | -0.38% | United States, Europe, Australia, GCC, India — large-format commercial equipment markets | Long term (≥ 4 years) |
| Qualified Fitness Equipment Service & Maintenance Technician Talent Gap | -0.22% | United States, Europe, GCC, India, Southeast Asia — commercial gym & institutional markets | Long term (≥ 4 years) |
Opportunities
AI-powered connected functional equipment remains open white space. Connected cardio drew over USD 4 Billion in capital through 2024, while connected functional strength drew under USD 200 Million, a 20:1 gap. This means no dominant platform exists yet. Early movers building sensor-integrated rigs can claim category leadership before larger rivals commit capital to this segment.
The unit economics now favor fast entry. Sensor modules cost USD 8 to 25 each and add USD 150 to 400 per unit in cost, enabling subscriptions of USD 20 to 55 monthly at 72% to 82% margin. This means hardware becomes a recurring revenue platform. Vendors lift per-installation lifetime value by 170% to 200% over hardware-only sales.
| Opportunity | (~) % Potential CAGR Upside | Geographic Relevance | Execution Window |
|---|---|---|---|
| AI-Powered Connected Functional Training Equipment with Real-Time Biomechanical Coaching & Performance Tracking | +1.80% | United States, United Kingdom, Germany, Australia, South Korea, Japan, GCC, Canada | Medium term (2–4 years) |
| Equipment-as-a-Service (EaaS) Subscription & Leasing Models for Commercial Gym & Corporate Wellness Operators | +1.20% | United States, Europe, Australia, GCC, Singapore, Japan | Short term (≤ 2 years) |
| Emerging Market Gym Infrastructure Buildout — India, Southeast Asia & Latin America First-Generation Commercial Gym Fleet | +0.95% | India, Indonesia, Vietnam, Brazil, Mexico, Colombia, Philippines, Egypt | Short term (≤ 2 years) |
| Senior & Rehabilitation Functional Equipment for Long-Term Care, Physiotherapy & Falls Prevention Programmes | +0.72% | United States, Germany, Japan, Italy, South Korea, Australia, France, United Kingdom | Long term (≥ 4 years) |
| Outdoor & Urban Functional Fitness Infrastructure for Municipal Park & Community Recreation Buildout | +0.42% | Europe, China, Australia, Middle East, United States, India | Medium term (2–4 years) |
Geopolitical Impact Analysis
US Section 301 tariffs directly raise the cost of Chinese-made functional equipment such as barbells, plates, and kettlebells. According to the WTO, average applied US tariffs on affected Chinese goods reached 19.3% by 2024, up from 3.1% pre-2018. This means brands sourcing from China face higher landed costs. As a result, manufacturers reroute production to Vietnam and Mexico to protect pricing on steel-heavy functional gear.
Supply chain rerouting and freight volatility now inflate logistics costs for bulky functional equipment. As reported by UNCTAD, container freight rates rose over 150% during Red Sea disruptions in early 2024, while transit times lengthened by 10 to 14 days on Asia-Europe lanes. This means heavy racks and plates cost more to ship. Consequently, vendors nearshore assembly and hold larger regional inventories to shield delivery schedules.
Key Company Insights
Technogym S.p.A. holds a structural advantage through its AI-enabled Biostrength ecosystem and connected fitness platform. In May 2025, the firm reported first-quarter revenue growth of 14.7% year-over-year to €215 Million, then surpassed €1 Billion in annual revenue for the first time in 2025. This scale funds continued R&D. As reported by ACSM, Data-Driven Training Technology jumped from #18 to #7 in 2025, validating this connected strategy and creating a widening lead over hardware-only rivals.
BowFlex Inc. positions around adjustable, space-efficient functional equipment aimed at home and residential buyers. This focus fits compact urban living and hybrid training demand. According to ACSM, Functional Fitness Training improved from #12 to #10 in the 2026 rankings, reinforcing durable home-user interest. This means BowFlex can defend residential share. However, its lighter connected-platform investment leaves a gap that software-led competitors may exploit over time.
Key Players
- BowFlex Inc.
- Brunswick Corporation
- Core Health & Fitness, LLC
- Coulter Ventures, LLC
- Eleiko Group AB
- Escape Fitness Limited
- Hampton Fitness Products LTD
- Johnson Health Tech. Co., Ltd.
- Life Fitness, LLC
- PlayCore Wisconsin, Inc.
- Precor Incorporated
- Rogue Fitness
- Technogym S.p.A.
- Torque Fitness, LLC.
Recent Developments
- January 2025: Technogym introduced its AI-powered Biostrength ecosystem, expanding its intelligent strength training portfolio with Biodrive technology for personalized resistance training and functional performance.
- April 2025: Technogym unveiled its latest wellness and functional training innovations at FIBO 2025, showcasing Precision Training, AI-powered Biostrength, and the Technogym Checkup assessment platform.
- Late 2025: Life Fitness rolled out its new Cables and Functional Strength Training portfolio, adding modular cable systems, customizable SYNRGY platforms, and inclusive strength solutions that scaled globally into early 2026.
- June 2022: Technogym introduced its AI-powered Biostrength ecosystem with Biodrive technology, which later saw major global expansions and healthcare integrations through 2025 and 2026.
Report Scope
| Report Features | Description |
|---|---|
| Market Value (2025) | USD 8.5 Billion |
| Forecast Revenue (2035) | USD 17.8 Billion |
| CAGR (2026-2035) | 7.7% |
| Base Year for Estimation | 2025 |
| Historic Period | 2020-2024 |
| Forecast Period | 2026-2035 |
| Report Coverage | Revenue Forecast, Market Dynamics, Market Opportunity Analysis, Technology and Innovation Landscape, Competitive Landscape, Recent Developments |
| Segments Covered | By Product Type (Bars and Plates, Flat Bench, Medballs, Rowing Machine, Squat Rack, Kettle-bells and Dumbbells, Accessories), By Application (Corporate Offices, Health Clubs, Home/Individual, Hospitals, Hotels, Others), By Distribution Channel (Department Stores, Hypermarkets & Supermarkets, Institutional/Direct Sales (B2B), Online Retail, Specialty Sports Retail Stores, Others) |
| Regional Analysis | North America (US and Canada), Europe (Germany, France, The UK, Spain, Italy, and Rest of Europe), Asia Pacific (China, Japan, South Korea, India, Australia, and Rest of APAC), Latin America (Brazil, Mexico, and Rest of Latin America), Middle East and Africa (GCC, South Africa, and Rest of MEA) |
| Competitive Landscape | BowFlex Inc., Brunswick Corporation, Core Health & Fitness, LLC, Coulter Ventures, LLC, Eleiko Group AB, Escape Fitness Limited, Hampton Fitness Products LTD, Johnson Health Tech. Co., Ltd., Life Fitness, LLC, PlayCore Wisconsin, Inc., Precor Incorporated, Rogue Fitness, Technogym S.p.A., Torque Fitness, LLC. |
| Customization Scope | Customization for segments, region / country-level will be provided. Additional customization can be done based on requirements. |
| Purchase Options | We have three licenses to opt for: Single User License | Multi-User License (Up to 5 Users) | Corporate Use License (Unlimited User and Printable PDF)
|





































