


Report Overview
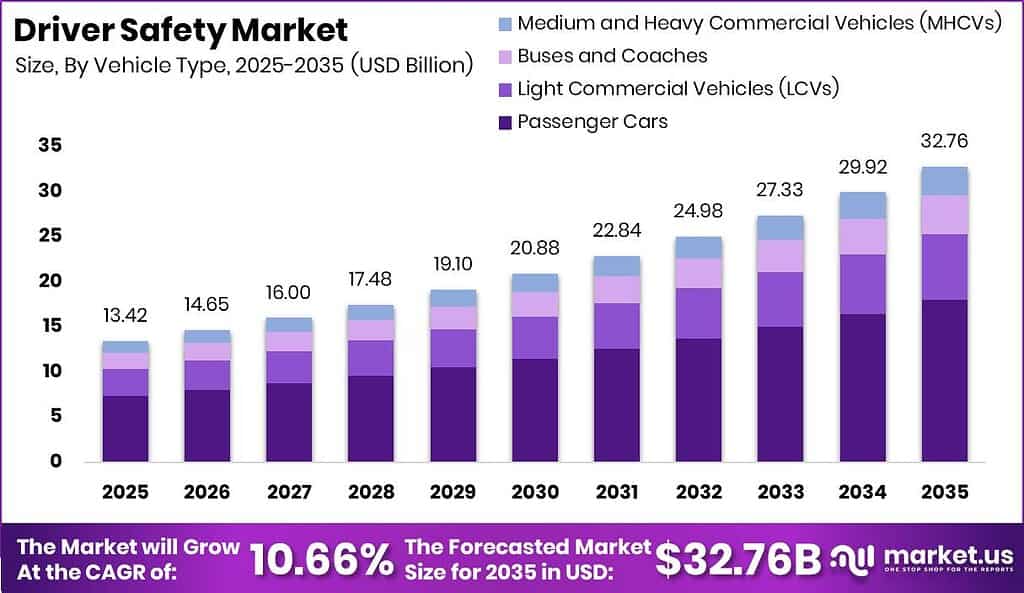
Global Driver Safety Market size is expected to be worth around USD 32.76 Billion by 2035 from USD 13.42 Billion in 2025, growing at a CAGR of 10.66% during the forecast period 2026 to 2035. Hardware, software, and sensing stacks now sit inside both new vehicles and fleet retrofits. Buyers treat crash avoidance as a cost and liability control tool rather than an optional add-on.
Therefore, the Driver Safety Market covers in-cabin and outward systems that detect distraction, drowsiness, and collision risk. The structure spans components, technology and system types, vehicle classes, and end-use channels. Commercial fleets and passenger OEMs set volume, while software layers convert sensor feeds into alerts and coaching.
Key Takeaways
- The market reaches USD 13.42 Billion in 2025 and USD 32.76 Billion by 2035 at a 10.66% CAGR.
- Cameras lead the component mix with a 43.00% share.
- Eye Tracking / Blink Monitoring leads technology types with a 40.20% share.
- Passenger Cars lead vehicle types with a 55.00% share.
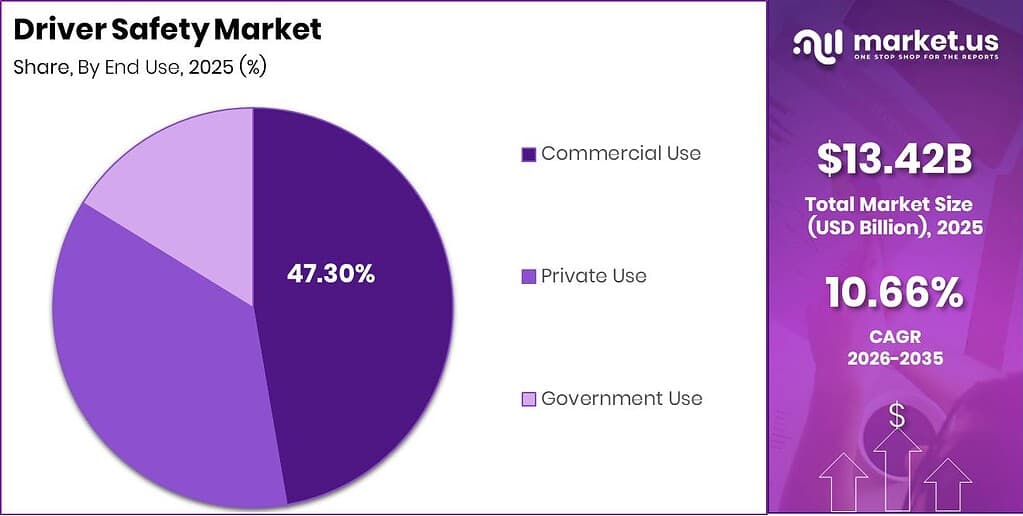
- Commercial Use leads end use with a 47.30% share.
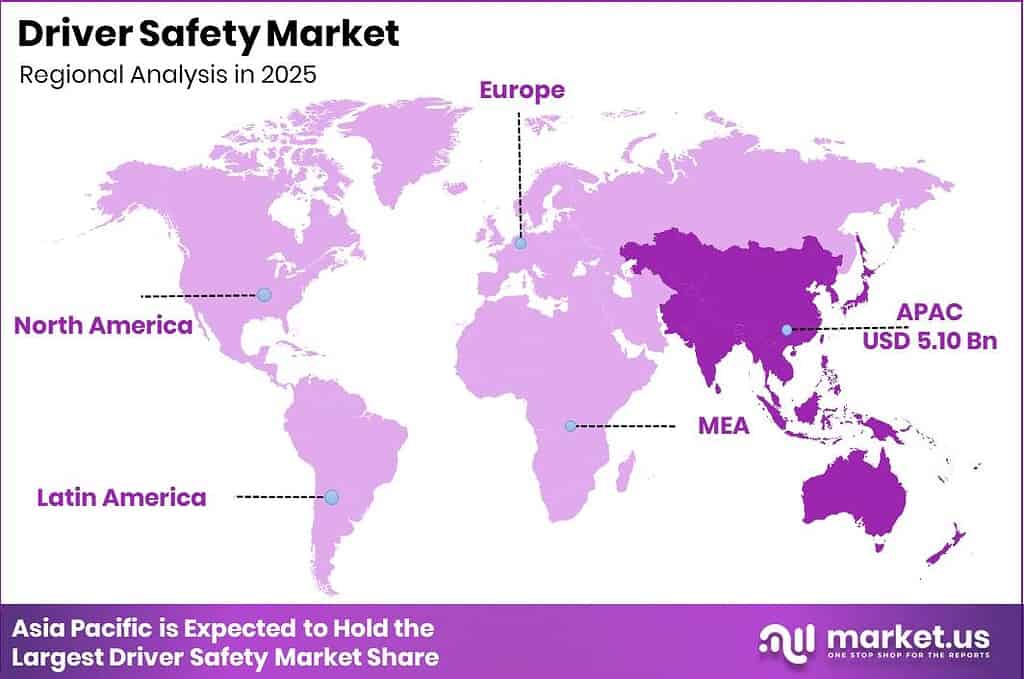
- Asia Pacific leads regions with a 38.00% share valued at USD 5.10 Billion.
Governments now treat cabin monitoring as a homologation item rather than a dealer option. EU Advanced Driver Distraction Warning rules under Regulation (EU) 2019/2144 bind new types from July 2024 and all new registrations from July 2026. This means roughly 10.5 million annual EU registrations each need cabin cameras or equivalent sensors. Suppliers shift from one-time hardware sales toward software and calibration attach revenue.
As a result, end-use fleet growth feeds product demand directly through measurable crash cuts. According to Samsara, more than 2,600 fleets using its full AI safety stack cut crash rates by 37% in six months. After 30 months the same stack delivered a 73% crash-rate cut. Operators who delay deployment leave insurance and liability savings on the table for faster rivals.
Consequently, OEM road-data programs also lift system demand. In July 2026 Mobileye partnered with Stellantis to put Road Experience Management cloud ADAS into future vehicles for lane-keeping and hands-free features. Data from Together for Safer Roads shows telematics programs cut fleet crashes by an average of 29%. Fleet and OEM channels therefore reinforce each other on the same sensing stack.
Component Analysis
Cameras dominates with 43.00% due to cabin and forward vision mandates.
In 2025, Cameras held a dominant market position in the By Component segment of Driver Safety Market, with a 43.00% share. ACEA logged about 10.6 million new EU car registrations in 2024, each increasingly needing cabin-facing imagers under distraction rules. This volume anchors camera BOM share on OEM platforms. Vendors who lock multi-year camera module contracts capture the largest unit stream before software attach expands.
Sensors feed radar, steering-angle, and biometric inputs that complete the perception stack around the camera. NHTSA estimated 36,640 U.S. traffic deaths in 2025, a 6.7% drop from 2024, while travel still rose. Fleets still buy richer sensor suites to keep cutting residual crash risk. Suppliers who bundle sensors with cameras reduce integration friction for fleet buyers.
Software is the fastest-growing component as AI coaching and risk scoring ride on installed hardware. In 2026 Mobileye agreed to acquire Mentee Robotics for about USD 900 million to deepen physical AI beyond classic auto safety. Element Fleet links telematics plus coaching to a 24% accident cut within 12 months. This creates recurring SaaS margins far above pure hardware. Radar plus remaining sensing holds the balance of component share collectively.
Technology / System Type Analysis
Eye Tracking / Blink Monitoring dominates with 40.20% due to gaze dwell time rules.
In 2025, Eye Tracking / Blink Monitoring held a dominant market position in the By Technology / System Type segment of Driver Safety Market, with a 40.20% share. EU technical thresholds trigger alerts when gaze lingers beyond 3.5 seconds above 50 km/h. This rule set forces eye and blink sensing onto mass platforms. Tier-ones that certify gaze stacks early win homologation slots across global OEM builds.
Facial Expressions / Head Movements extend distraction detection when eyes alone miss secondary cues. Samsara reports customers cut mobile-phone-use events by 84% within six months on its AI camera stack. Head-pose models help flag phone and mirror glances that pure blink logic can miss. Fleets that add expression layers protect CSA scores and insurance renewals.
Heart-Rate Monitoring and Pressure / Angle Steering Sensor tracks give physiological and control-loop signals of fatigue. Samsara’s six-month cohort cut harsh-driving events by 48% and speeding events by 4%. Steering torque and heart-rate fusion supports earlier coaching before a crash forms. Suppliers who fuse these channels raise alert precision and cut false positives.
Lane Departure Warning System, Off-Highway Vehicle Safety Systems as the fastest-growing line, Driver Alertness Detection System, Vehicle-to-Vehicle Communication, Electronic Stability Control, and Others hold the remaining technology share collectively. IIHS 2025 front crash tests score alerts only when given at least 2.1 seconds before impact at 31, 37, and 43 mph. Off-highway and V2V niches reward specialists who meet those timing bars in harsh environments.
Vehicle Type Analysis
Passenger Cars dominates with 55.00% due to high OEM fitment volumes.
In 2025, Passenger Cars held a dominant market position in the By Vehicle Type segment of Driver Safety Market, with a 55.00% share. NHTSA chose 37 model-year 2025 vehicles for 5-Star testing covering about 87% of the U.S. new-vehicle fleet. Safety ratings push carmakers to standard fit driver monitoring and AEB-linked stacks. Component makers who win passenger-car platforms secure the deepest volume curve.
Light Commercial Vehicles carry dense urban mileage and high stop-start exposure. Together for Safer Roads cites a 29% average fleet crash cut from telematics programs. LCV operators convert those savings into faster retrofit payback. Vendors who price LCV kits for multi-stop routes gain share outside pure passenger channels.
Buses and Coaches form the fastest-growing vehicle class as public and private operators face duty-of-care pressure. Samsara fleets with at least 175 vehicles saw a 43% unsafe-driving CSA score gain and a 57% hours-of-service compliance gain after 30 months. Coach and bus buyers prize those compliance lifts. Medium and Heavy Commercial Vehicles hold the remaining vehicle-type share and favor ruggedized cameras and long-haul coaching.
End Use Analysis
Commercial Use dominates with 47.30% due to fleet liability and insurance pressure.
In 2025, Commercial Use held a dominant market position in the By End Use segment of Driver Safety Market, with a 47.30% share. Larger Samsara fleets with 500 or more vehicles cut harsh events by 84%, speeding by 23%, and mobile use by 98% after 30 months. Those outcomes justify multi-year safety subscriptions. Fleet CFOs treat the stack as a controllable loss line, not a discretionary gadget.
Private Use buyers adopt systems mainly through OEM standard fit rather than aftermarket kits. U.S. vehicle travel rose about 29.8 billion miles, or roughly 0.9%, in 2025 while deaths still fell. Private owners benefit when factory DMS and AEB ship by default. Suppliers who win carmaker RFQs reach private users without retail install cost.
Government Use is the fastest-growing end-use line as public fleets and regulated transport raise duty-of-care standards. First-half 2025 U.S. deaths fell to 17,140, an 8.2% drop, while the fatality rate moved from 1.16 to 1.06 per 100 million VMT. Agencies that publish safety KPIs accelerate camera and coaching tenders. Vendors with public-sector compliance tooling capture this channel early.
Key Market Segments
By Component
- Cameras
- Sensors
- Software
- Radar
By Technology / System Type
- Eye Tracking / Blink Monitoring
- Facial Expressions / Head Movements
- Heart-Rate Monitoring
- Pressure / Angle Steering Sensor
- Lane Departure Warning System
- Off-Highway Vehicle Safety Systems
- Driver Alertness Detection System
- Vehicle-to-Vehicle Communication
- Electronic Stability Control
- Others
By Vehicle Type
- Passenger Cars
- Light Commercial Vehicles (LCVs)
- Buses and Coaches
- Medium and Heavy Commercial Vehicles (MHCVs)
By End Use
- Commercial Use
- Private Use
- Government Use
Regional Analysis
Asia Pacific Dominates the Driver Safety Market with a Market Share of 38.00%, Valued at USD 5.10 Billion
Asia Pacific leads on sheer vehicle production and rising fleet telematics spend across China, Japan, South Korea, and India. Regional OEMs standardize camera and DMS packs to serve both domestic rules and export homologation. This share of 38.00% and USD 5.10 Billion value gives local tier-ones scale on image sensors and radar. Global suppliers must localize software and support to hold APAC OEM slots.
Europe is the fastest-growing regulatory engine as distraction warning becomes mandatory on all new registrations from July 2026. In June 2025 Geotab and Vitality launched the Geotab Vitality beta in Europe with predictive collision analytics and driver behaviour scoring. ACEA’s roughly 10.6 million 2024 registrations show the addressable base. Vendors aligned to Euro NCAP Safe Driving points gain pull-through on software services.
North America combines large commercial fleets with NHTSA rating pressure, while Latin America and Middle East and Africa trail on mandate depth. U.S. fatalities fell to 36,640 in 2025 even as miles rose, which keeps fleet ROI stories credible. Insurers and duty-of-care rules still drive retrofit demand in the U.S. and Canada. Emerging regions remain longer-cycle white space for low-cost camera kits.
Key Regions and Countries
North America
- US
- Canada
Europe
- Germany
- France
- The UK
- Spain
- Italy
- Rest of Europe
Asia Pacific
- China
- Japan
- South Korea
- India
- Australia
- Rest of APAC
Latin America
- Brazil
- Mexico
- Rest of Latin America
Middle East and Africa
- GCC
- South Africa
- Rest of MEA
Market Dynamics
Market Opportunity Analysis - Software, government fleets, and off-highway niches remain under-penetrated relative to camera-led passenger volume
Software remains under-monetized next to camera hardware that already leads component share. Most installed sensors still ship without full coaching and risk-score subscriptions. This creates room for analytics vendors to raise blended margins without new camera installs. Early SaaS movers can lock fleets before hardware vendors bundle free basic apps.
Government Use is the fastest-growing end-use line yet still trails Commercial Use on absolute share. Public fleets often buy through long tenders rather than retail kits. This means specialists with compliance reporting and open APIs can win city and agency contracts. Investors gain a channel less tied to private consumer cycles.
Buses and Coaches grow fastest among vehicle types but sit well below Passenger Cars on volume. Duty-of-care and CSA-style scoring make coach operators receptive to full AI camera stacks. Therefore niche fleet suppliers can out-serve broad OEM-focused rivals on this class. Concentrated route networks also simplify pilot-to-rollout economics.
Off-Highway Vehicle Safety Systems lead growth inside technology types while passenger eye-tracking still dominates share. Construction and agriculture cabins need rugged sensing that road DMS kits under-serve. By contrast, specialists who harden gaze and proximity stacks for dust and vibration open a parallel market. Entrants avoid head-on fights for passenger OEM slots.
Technology and Innovation Landscape - AI cameras, timed AEB alerts, and cloud road data redefine safety stacks
AI camera platforms now classify more than 30 risk categories spanning driver behavior, blind spots, weather, and road conditions. That breadth turns a single imager into a multi-risk coach rather than a simple recorder. Fleets cut training cost when one device covers distraction and environment hazards. Vendors who keep model libraries current defend subscription renewals.
IIHS 2025 front crash-prevention tests score forward-collision warning and automatic emergency braking at 31, 37, and 43 mph. Credit requires alerts at least 2.1 seconds before projected impact. This timing bar forces tighter sensor fusion and lower latency on edge chips. Suppliers who miss the window lose OEM rating support.
Cloud road-experience systems such as Mobileye REM turn fleet-generated lane data into hands-free and lane-keeping features. Map freshness improves without pure HD survey fleets. OEMs that adopt shared road graphs cut mapping cost per vehicle. This shifts value toward data network effects over one-time sensor ASP.
NHTSA’s 2025 5-Star program tested 37 vehicles covering about 87% of the U.S. new fleet. Rating visibility pushes factory fitment of monitoring and crash-prevention tech. Component makers aligned to those test protocols secure default content. Delay on protocol alignment risks exclusion from high-volume trims.
Drivers
The European Union Advanced Driver Distraction Warning rule under Regulation (EU) 2019/2144 binds all new vehicle types from July 2024 and all new registrations from July 2026. ACEA logs roughly 10.5 million annual registrations that now need cabin cameras or equal sensors. Alerts fire when gaze lingers beyond 3.5 seconds above 50 km/h. This compulsion turns optional safety into a homologation line item for cars, vans, trucks, and buses.
As a result, suppliers move from one-time hardware sales to embedded software, over-the-air calibration, and Euro NCAP support worth up to 25 points in the 2026 Safe Driving protocol. Global OEMs prefer one compliant platform, so the EU rule spills into other WP.29 markets. Investors should favor firms with recurring software attach over pure camera module vendors.
| Driver | (~) % Impact on CAGR Forecast | Geographic Relevance | Impact Timeline |
|---|---|---|---|
| EU driver distraction warning mandate | +2.9% | Europe, spillover to global OEM platforms | Short term (2 years or less) |
| Fleet telematics & video safety adoption | +2.4% | North America, Europe, developed APAC | Short term (2 years or less) |
| Insurer usage-based premium incentives | +1.7% | North America, UK, Western Europe | Medium term (2 to 4 years) |
| ADAS cost curve & sensor commoditization | +1.5% | Global | Medium term (2 to 4 years) |
| Corporate duty-of-care liability exposure | +1.1% | North America, Europe, ANZ | Medium term (2 to 4 years) |
| Rising road fatality policy pressure | +0.8% | Emerging APAC, Latin America, Africa | Long term (4 years or more) |
Restraints
High capital costs freeze discretionary fleet safety spend when policy rates stay above the pre-2022 baseline on IMF and World Bank lending measures. American Trucking Associations data show carrier operating ratios near 95%, so margins leave little room for hardware plus subscriptions. Multi-thousand-unit rollouts push payback past typical 24-month budget cycles. Order pipelines shrink until vendors offer zero-CapEx subscription models.
This means small and mid-size fleets, the bulk of unpenetrated units, delay installs even when crash ROI is clear. Federal Reserve loan officer surveys show tighter commercial credit that hits these buyers hardest. Sellers who cannot finance hardware risk losing share to pure SaaS rivals. Investors should stress-test demand under prolonged high rates.
| Restraint | (~) % Impact on CAGR Forecast | Geographic Relevance | Impact Timeline |
|---|---|---|---|
| High interest rates freezing fleet CapEx | -2.1% | North America, Europe, emerging markets | Short term (2 years or less) |
| Upfront retrofit & hardware cost barrier | -1.6% | SMB fleets, emerging markets | Short term (2 years or less) |
| Privacy & in-cabin surveillance pushback | -1.2% | Europe, North America | Medium term (2 to 4 years) |
| Driver acceptance & opt-out resistance | -0.9% | North America, Europe | Short term (2 years or less) |
| Absence of mandates outside regulated blocs | -0.7% | Non-EU emerging markets, UK | Medium term (2 to 4 years) |
Challenges
Automotive semiconductor volatility still hits camera processors, radar MMICs, and edge inference SoCs. SIA-linked shortage years stretched chip lead times from 3-4 months to 10-12 months and removed about 19.6 million vehicles from global output. WSTS views automotive-grade capacity as still tight while safety silicon per vehicle rises. Spot spikes inflate bill-of-materials and delay fleet and OEM shipments.
This creates a revenue path for vendors who dual-qualify foundries and hold safety stock. Working capital rises, yet delivery reliability becomes a sales weapon against allocation shocks. U.S. Department of Commerce supply assessments still flag residual disruption risk. Firms that fund resilience now protect 2026 to 2030 program awards.
| Challenge | (~) % CAGR Friction Drag | Geographic Relevance | Mitigation Horizon |
|---|---|---|---|
| Semiconductor supply chain volatility | -1.4% | Global, concentrated in Asia foundries | Medium term (2 to 4 years) |
| AI & vision engineering talent deficit | -1.1% | North America, Europe | Long term (4 years or more) |
| Fragmented data interoperability standards | -0.9% | Global | Medium term (2 to 4 years) |
| False-positive alert fatigue | -0.7% | Global | Medium term (2 to 4 years) |
| Cybersecurity & OTA attack surface | -0.6% | Global | Long term (4 years or more) |
Opportunities
Safety-data monetization and analytics SaaS form the largest upside white space on hardware already in the field. Standalone hardware often runs 25% to 35% gross margin, while software and analytics layers clear 70% to 80% in fleet SaaS models. Gaze, braking, and near-miss streams still sit underused. Packaging them as coaching and risk scores lifts lifetime value on sunk acquisition cost.
This signals early movers who build the data platform before the white space commoditizes. ACEA volumes plus EU in-cabin mandates widen the instrumented vehicle pool. Insurers show rising telematics appetite in ABI and NAIC-type filings and buy anonymized risk data. Investors should weight recurring analytics revenue over one-time camera ASP.
| Opportunity | (~) % Potential CAGR Upside | Geographic Relevance | Execution Window |
|---|---|---|---|
| Safety-data monetization & analytics SaaS | +2.2% | North America, Europe, developed APAC | Medium term (2 to 4 years) |
| Emerging market fleet white space | +1.8% | India, Southeast Asia, Latin America, Africa | Long term (4 years or more) |
| Insurer-vendor risk-sharing partnerships | +1.5% | North America, UK, Western Europe | Medium term (2 to 4 years) |
| Fragmented vendor M&A roll-up | +1.2% | Global | Medium term (2 to 4 years) |
| Micromobility & two-wheeler adjacency | +1.0% | Asia, Europe urban centers | Long term (4 years or more) |
Key Company Insights
Continental AG anchors driver safety through integrated ADAS and cabin sensing sold into global OEM platforms. Scale across cameras, radar, and control units supports single-stack bids that smaller pure-plays cannot match. This breadth lowers OEM integration risk and locks long program cycles. However, hardware-heavy mix can lag pure software margin expansion if attach rates stay low.
Robert Bosch GmbH competes with deep sensor, ECU, and software reach across passenger and commercial lines. Vertical control of perception and control electronics supports tight calibration and over-the-air updates. This creates stickiness once vehicles ship with Bosch stacks. Margin risk rises if price pressure on commoditizing sensors outruns software attach growth.
Key Players
- Continental AG
- Robert Bosch GmbH
- Denso Corporation
- Seeing Machines
- Smart Eye AB
- TRW Automotive Holdings Corp.
- Takata Corp.
- Toyoda Gosei Co., Ltd.
- Autoliv Inc.
- Tokai Rika Co., Ltd.
- Delphi Automotive LLP
- Hyundai Mobis
- Nihon Plast Co., Ltd.
- Raytheon Co.
- FLIR Systems Inc.
- HELLA KGaA Hueck & Co.
- East Joy Long Motor Airbag Co., Ltd.
- Infineon Technologies AG
- ZF Friedrichshafen AG
- Valeo
- Magna International
- Mobileye
- Aptiv PLC
Recent Developments
- January 2025: Netradyne raised USD 90 million in Series D funding led by Point72 Private Investments, with Qualcomm Ventures and Pavilion Capital, to accelerate R&D and global expansion of its AI powered Driver i fleet safety platform.
- February 2025: Geotab and Vitality established a data driven behavioural science joint venture combining Geotab telematics data and AI powered collision risk analytics with Vitality driver behaviour programs for safer commercial fleets.
- May 2026: Netradyne acquired Moove Connected Mobility to strengthen European presence by combining Netradyne AI based fleet safety technology with Moove connected mobility and fleet intelligence capabilities.
Geopolitical Impact Analysis
According to WTO dispute communications, India sought consultations after U.S. 25% ad valorem tariffs on certain auto components and vehicles took effect May 3, 2025 for an unlimited duration. Driver safety cameras, radar modules, and ECUs that cross that corridor face higher landed cost. This means fleets and OEMs may reroute sourcing toward non-tariff origins. Suppliers with multi-country assembly protect pricing better than single-country plants.
As reported by industry briefings tied to WTO process, the March 2026 expiry of the long-running moratorium on customs duties on electronic transmissions lets members tax digital flows that support semiconductor supply chains. Global semiconductor sales reached about USD 791.7 Billion in 2025 on SIA figures, underlining exposure. Edge AI models and OTA calibration for driver monitoring ride those data pipes. Vendors should dual-path software delivery and inventory critical chips against new digital duty risk.
Report Scope
| Report Features | Description |
|---|---|
| Market Value (2025) | USD 13.42 Billion |
| Forecast Revenue (2035) | USD 32.76 Billion |
| CAGR (2026-2035) | 10.66% |
| Base Year for Estimation | 2025 |
| Historic Period | 2020-2024 |
| Forecast Period | 2026-2035 |
| Report Coverage | Revenue Forecast, Market Dynamics, Market Opportunity Analysis, Technology and Innovation Landscape, Competitive Landscape, Recent Developments |
| Segments Covered | By Component (Cameras, Sensors, Software, Radar), By Technology / System Type (Eye Tracking / Blink Monitoring, Facial Expressions / Head Movements, Heart-Rate Monitoring, Pressure / Angle Steering Sensor, Lane Departure Warning System, Off-Highway Vehicle Safety Systems, Driver Alertness Detection System, Vehicle-to-Vehicle Communication, Electronic Stability Control, Others), By Vehicle Type (Passenger Cars, Light Commercial Vehicles (LCVs), Buses and Coaches, Medium and Heavy Commercial Vehicles (MHCVs)), By End Use (Commercial Use, Private Use, Government Use) |
| Regional Analysis | North America (US and Canada), Europe (Germany, France, The UK, Spain, Italy, and Rest of Europe), Asia Pacific (China, Japan, South Korea, India, Australia, and Rest of APAC), Latin America (Brazil, Mexico, and Rest of Latin America), Middle East and Africa (GCC, South Africa, and Rest of MEA) |
| Competitive Landscape | Continental AG, Robert Bosch GmbH, Denso Corporation, Seeing Machines, Smart Eye AB, TRW Automotive Holdings Corp., Takata Corp., Toyoda Gosei Co., Ltd., Autoliv Inc., Tokai Rika Co., Ltd., Delphi Automotive LLP, Hyundai Mobis, Nihon Plast Co., Ltd., Raytheon Co., FLIR Systems Inc., HELLA KGaA Hueck & Co., East Joy Long Motor Airbag Co., Ltd., Infineon Technologies AG, ZF Friedrichshafen AG, Valeo, Magna International, Mobileye, Aptiv PLC |
| Customization Scope | Customization for segments, region / country-level will be provided. Additional customization can be done based on requirements. |
| Purchase Options | We have three licenses to opt for: Single User License | Multi-User License (Up to 5 Users) | Corporate Use License (Unlimited User and Printable PDF) |





































