


Market Overview
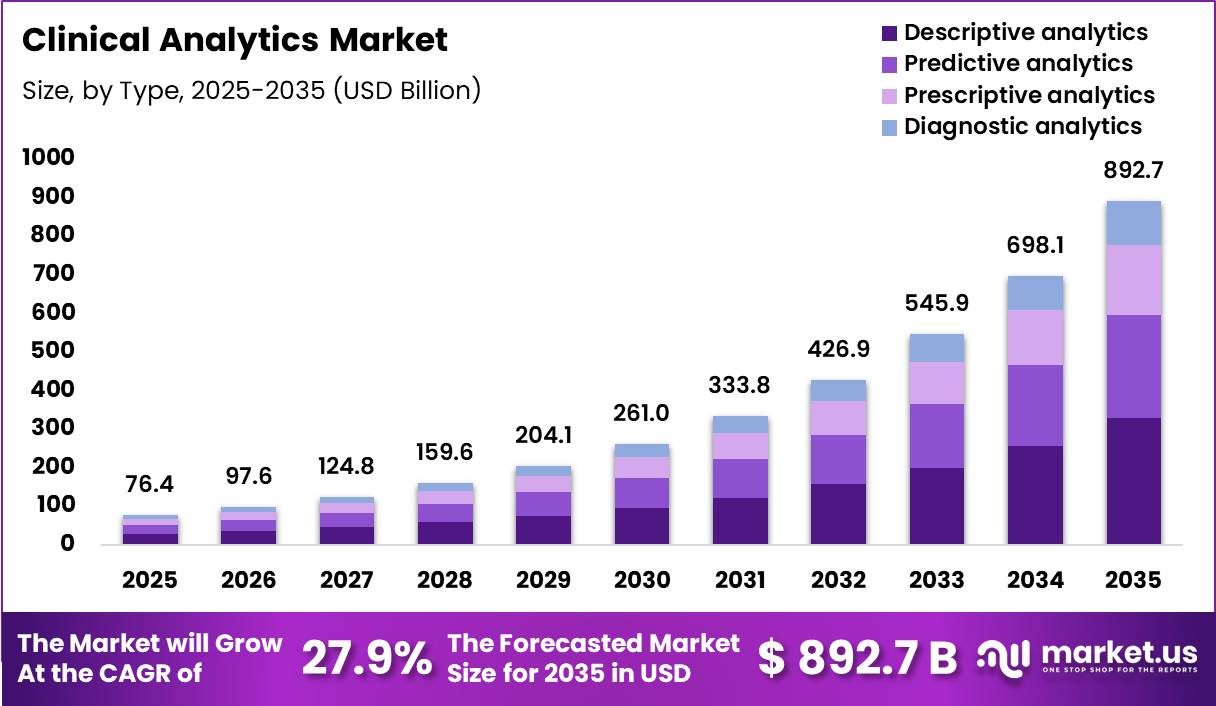
Global Clinical Analytics Market size is expected to be worth around US$ 892.7 Billion by 2035 from US$ 76.4 Billion in 2025, growing at a CAGR of 27.9% during the forecast period from 2026 to 2035. In 2025, North America led the market, achieving over 44.7% share with a revenue of US$ 34.1 Billion.
Clinical Analytics Market represents the expanding use of data-driven technologies in healthcare systems, enabling hospitals and public health agencies to improve clinical outcomes through real-time insights. According to the World Health Organization (WHO), digital health transformation is accelerating globally, supporting stronger disease surveillance and patient management systems.
The U.S. Office of the National Coordinator for Health Information Technology (ONC) reports that over 96% of non-federal acute care hospitals have adopted certified electronic health record (EHR) systems, forming a strong foundation for clinical analytics.
Clinical analytics tools help process large volumes of patient data generated from EHRs, imaging systems, and laboratory platforms, improving decision-making efficiency and reducing diagnostic errors. Increasing adoption of AI-powered analytics is also supporting predictive healthcare models, enabling early detection of chronic diseases and reducing hospitalization rates. Governments worldwide are investing in digital health infrastructure to enhance interoperability and data security, ensuring compliance with privacy regulations.
With increasing emphasis on value-based care, clinical analytics is becoming essential for optimizing healthcare delivery and improving population health outcomes. The market continues to expand as healthcare providers prioritize data-driven decision making and integrated digital ecosystems across clinical workflows.
This shift supports improved patient safety and operational efficiency across hospitals, clinics and public health organizations while enabling faster evidence-based decisions in clinical practice and research environments globally worldwide adoption.
Key Takeaways
- Market Size: Global Clinical Analytics Market size is expected to be worth around US$ 892.7 Billion by 2035 from US$ 76.4 Billion in 2025.
- Market Share: The market is growing at a CAGR of 27.9% during the forecast period from 2026 to 2035.
- Type: The Clinical Analytics Market by type is led by Descriptive analytics, which accounted for 36.7% of the global market share in 2025.
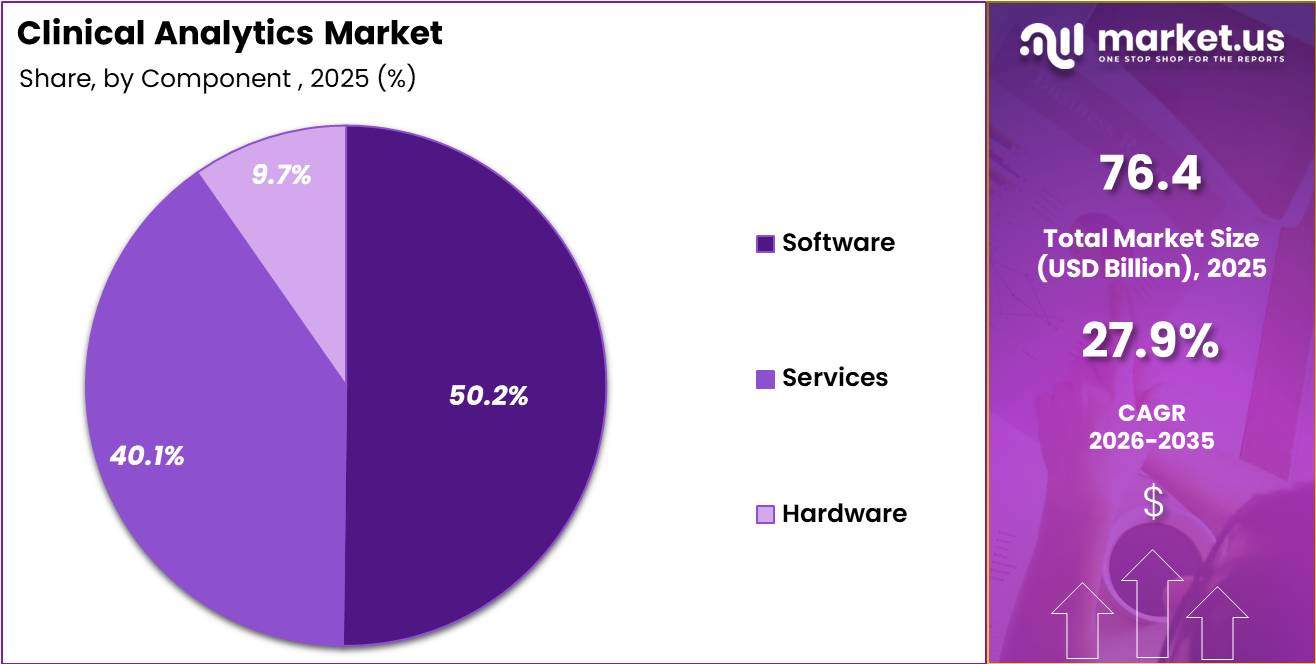
- Component: The software segment dominates the clinical analytics market with a 50.2% share in 2025.
- Deployment Mode: The Cloud-based deployment segment dominated the Clinical Analytics Market, accounting for 45.2% of total market revenue in 2025.
- Application: Clinical data and outcomes analytics dominates the application segment with a 35.2% share in 2025.
- End-user : Healthcare providers dominate the end-user segment with a 50.3% share in 2025.
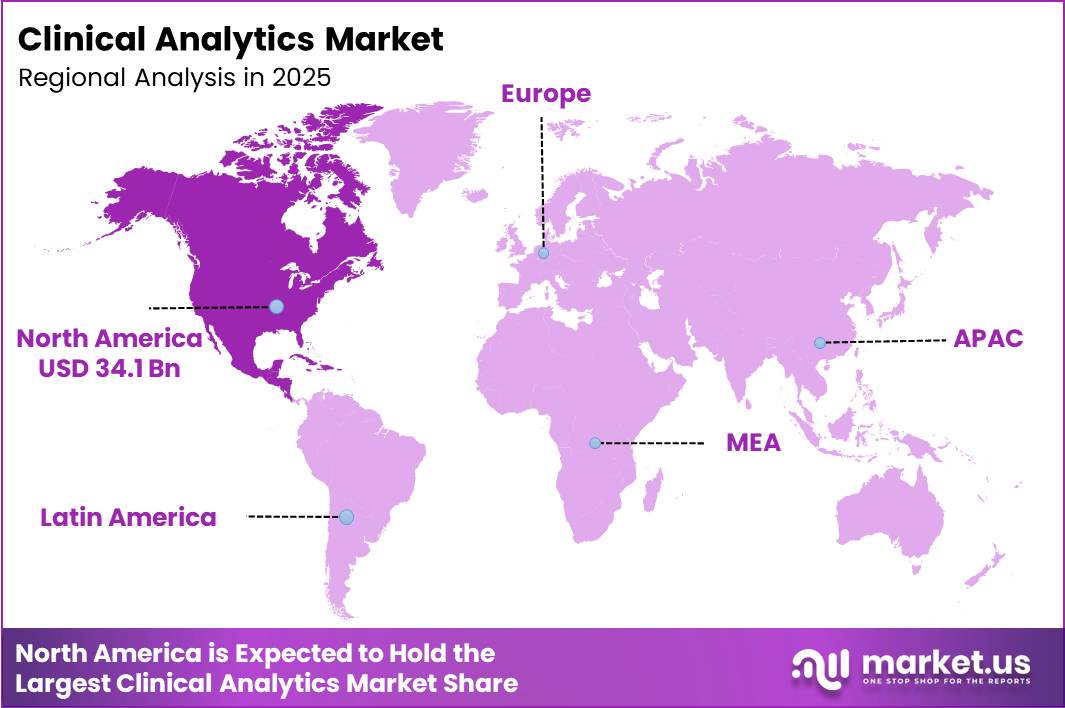
- Regional Analysis: In 2025, North America led the market, achieving over 44.7% share with a revenue of US$ 34.1 Billion.
Type Analysis
Descriptive Analytics Leads Clinical Analytics Market with Strong Foundation in Healthcare Decision Support.
Descriptive analytics holds the dominant position in the clinical analytics market, accounting for 36.7% of the total market share in 2025. This segment leads due to its widespread use in summarizing historical healthcare data, generating routine reports, and improving operational visibility across healthcare systems.
Hospitals and healthcare providers heavily rely on descriptive analytics to track patient outcomes, resource utilization, and clinical performance metrics in real time. Predictive analytics follows with a 30.1% share, driven by its growing application in forecasting disease progression, patient admission rates, and potential readmission risks using AI and machine learning models.
Prescriptive analytics, holding 20.3%, is gaining traction as healthcare organizations increasingly adopt decision-support systems that recommend optimized treatment paths and resource allocation strategies. Meanwhile, diagnostic analytics accounts for 12.9%, playing a crucial role in identifying root causes of clinical outcomes and treatment inefficiencies.
The overall type segmentation reflects a gradual shift from traditional reporting tools toward advanced analytics capabilities. However, descriptive analytics continues to dominate due to its ease of implementation, lower cost, and strong integration with existing electronic health record systems.
The market is expected to see increased convergence of all analytics types as healthcare providers move toward value-based care models and data-driven clinical decision-making environments.
Component Analysis
Software Segment Dominates Clinical Analytics Market Driven by AI Integration and Cloud Adoption.
In the clinical analytics market, the software segment dominates with a 50.2% market share in 2025, driven by the rising adoption of advanced analytics platforms, AI-enabled clinical decision support systems, and electronic health record integration tools.
Healthcare organizations increasingly depend on software solutions to manage large volumes of structured and unstructured clinical data efficiently. These platforms enable real-time insights, predictive modeling, and performance tracking across care delivery systems.
The services segment follows closely, accounting for 40.1% of the market, supported by growing demand for implementation support, system integration, consulting, and maintenance services. As healthcare IT environments become more complex, organizations are relying heavily on service providers to ensure smooth deployment and optimization of analytics solutions.
The hardware segment holds a comparatively smaller share of 9.7%, primarily consisting of servers, storage systems, and networking infrastructure required to support analytics workloads. Although its share is limited, hardware remains essential for ensuring data processing speed and system reliability, especially in large hospital networks and research institutions.
Overall, the component segmentation highlights a strong software-driven ecosystem, complemented by expanding service requirements, while hardware continues to play a foundational but less dominant role in enabling clinical analytics infrastructure across healthcare systems globally.
Deployment Mode Analysis
Cloud-Based Deployment Emerges as Leading Model in Clinical Analytics Ecosystem.
Cloud-based deployment dominates the clinical analytics market with a 45.2% share in 2025, primarily due to its scalability, cost efficiency, and ability to support real-time data access across multiple healthcare facilities.
Hospitals and healthcare systems are increasingly shifting toward cloud platforms to manage large volumes of patient data while ensuring interoperability between departments and external care providers. Cloud-based solutions also support advanced analytics capabilities such as AI-driven predictions and remote monitoring, making them highly suitable for modern digital healthcare ecosystems.
On-premise deployment continues to remain relevant, particularly among large hospitals and government healthcare institutions that prioritize data security, regulatory compliance, and direct control over sensitive patient information. Despite its advantages, on-premise systems face limitations in scalability and higher infrastructure costs.
Web-hosted solutions represent another segment, offering simplified access to analytics tools through browser-based platforms without extensive infrastructure requirements. This model is particularly attractive for smaller healthcare providers and clinics seeking affordable analytics capabilities.
Overall, the deployment mode segmentation reflects a clear industry shift toward cloud adoption, driven by digital transformation initiatives, increased data volumes, and the growing need for integrated healthcare delivery systems. However, hybrid approaches combining cloud and on-premise systems are also emerging to balance flexibility with security requirements.
Application Analysis
Clinical Data and Outcomes Analytics Holds Largest Share in Clinical Analytics Market Applications.
Clinical data and outcomes analytics dominates the application segment of the clinical analytics market, holding a 35.2% share in 2025. This dominance is attributed to the growing emphasis on improving patient outcomes, reducing treatment variability, and enhancing overall care quality through data-driven insights.
Healthcare providers extensively use this application to evaluate treatment effectiveness and monitor clinical performance metrics. Population health and risk analytics is another key segment, driven by the increasing need to manage chronic diseases, predict disease outbreaks, and improve public health planning.
This segment is gaining traction as healthcare systems shift toward preventive care models. Precision medicine and decision support applications are also expanding rapidly, supported by advancements in genomics, AI, and personalized treatment approaches that enable clinicians to tailor therapies based on individual patient profiles.
Research and clinical trial analytics play a crucial role in accelerating drug development, optimizing trial design, and improving patient recruitment efficiency in the pharmaceutical and biotech sectors. Overall, the application segmentation highlights a strong movement toward outcome-driven healthcare systems, where analytics is increasingly used not only for operational efficiency but also for clinical innovation, personalized treatment strategies, and evidence-based decision-making across healthcare ecosystems.
End-User Analysis
Healthcare Providers Dominate Clinical Analytics Market End-User Segment Due to Rising Data-Driven Care Adoption.
Healthcare providers dominate the end-user segment of the clinical analytics market with a 50.3% share in 2025, reflecting their central role in generating and utilizing clinical data for patient care optimization. Hospitals, clinics, and integrated healthcare systems are increasingly adopting analytics solutions to improve diagnostic accuracy, enhance operational efficiency, and reduce healthcare costs.
Healthcare payers represent a significant secondary segment, using clinical analytics to manage claims processing, detect fraud, and evaluate treatment cost-effectiveness while ensuring better risk management and policy planning.
Life sciences and pharmaceutical/biotech companies also form an important end-user group, leveraging analytics for drug discovery, clinical trial optimization, and real-world evidence generation to support regulatory approvals and market access strategies.
The growing adoption across these end-user categories is driven by the increasing availability of digital health records, rising healthcare expenditures, and the global shift toward value-based care models. While healthcare providers remain the primary adopters, payers and life sciences organizations are rapidly expanding their analytics capabilities to enhance decision-making and improve overall healthcare outcomes.
The end-user segmentation clearly indicates a broadening ecosystem where clinical analytics is no longer limited to hospitals but is becoming a critical tool across the entire healthcare value chain.
Key Market Segments
By Type
- Descriptive analytics
- Predictive analytics
- Prescriptive analytics
- Diagnostic analytics
By Component
- Software
- Services
- Hardware
By Deployment Mode
- Cloud‑based
- On‑premise
- Web‑hosted
By Application
- Clinical data and outcomes analytics
- Population health and risk analytics
- Precision medicine and decision support
- Research and clinical trial analytics
By End-user
- Healthcare providers
- Healthcare payers
- Life sciences and pharma/biotech
Challenges
Interoperability remediation burden.
Clinical analytics vendors and enterprise buyers in 2026 still face a heavy normalization burden because regulatory progress has raised the floor for exchange standards without eliminating local data-model divergence, legacy interface debt, or inconsistent semantic mapping across EHR, imaging, lab, claims, and care-management systems.
ONC’s HTI-1 rule moved the U.S. baseline to USCDI v3 and FHIR US Core 6.1.0 from January 2026 while payer-side CMS interoperability deadlines also began compressing API readiness windows, which means hospitals are not merely buying analytics modules but funding parallel remediation layers for vocabulary mapping, master-patient-index tuning, and API orchestration.
In practical terms, a multi-hospital deployment can still require 6 to 12 source-system interfaces, 9 to 18 months of data model harmonization, and 15% to 30% extra services spend above software contract value before models stabilize enough for longitudinal risk scoring, which is why this friction plausibly removes about 1.8 % points from the market’s attainable CAGR versus a fully standardized environment.
The strategic response is prolonged rather than immediate: vendors must pre-build certified connectors and terminology services, buyers must budget for phased lakehouse architectures and data quality governance, and both sides must treat interoperability engineering as recurring product infrastructure rather than one-time implementation labor.
| Challenge | (~) % CAGR Friction Drag | Geographic Relevance | Mitigation Horizon |
|---|---|---|---|
| Interoperability remediation burden | -1.8% | North America core, EU regulatory hubs, advanced APAC provider systems | Medium term (2-4 years) |
| Cyber-resilience operating strain | -1.6% | North America core, UK, EU hospital networks, digitally mature APAC markets | Medium term (2-4 years) |
| Clinical AI validation debt | -1.3% | U.S. certified health IT stack, EU compliance markets, tertiary-care hubs globally | Long term (≥ 4 years) |
| Analytics talent bottleneck | -1.2% | Global, strongest in LMIC systems, mid-tier hospitals, public health networks | Long term (≥ 4 years) |
| Data governance fragmentation | -1.1% | EU, Asia-Pacific localization markets, multinational life-science programs | Long term (≥ 4 years) |
| Workflow adoption and trust drag | -0.9% | Provider enterprises in U.S., UK, EU, Gulf, and advanced APAC systems | Short term (≤ 2 years) |
Opportunity
Specialty care episode analytics.
A opportunity is to build verticalized analytics modules around high-cost specialty episodes such as orthopedics, oncology infusion, cardiovascular recovery, and post-acute transitions, because the current baseline largely reflects generic enterprise analytics adoption while mandatory bundled-accountability programs create room for premium workflow-specific products.
In the U.S., CMS’s TEAM model began in 2026 and runs through 2030 for selected acute care hospitals, creating a commercial opening for surgical episode analytics that goes beyond dashboards into physician-level variation control, referral leakage management, and 30-day post-discharge orchestration.
Vendors that shift from broad population tools to episode-specific products can plausibly raise ACV by 20% to 40%, improve implementation speed by 25% through templated data models, and lift retention by 5 to 8 points because ROI is tied to direct gainshare and penalty avoidance.
This is an opportunity because value-based care itself is already embedded in baseline growth, but monetizing narrow specialty use cases with contract structures pegged to episode savings, quality-score improvement, or reconciliation accuracy represents a new pricing and product architecture that could add roughly $ 300,000 to $ 1.2 million annual revenue per health-system client and widen EBITDA margins by 3% to 6% once reusable specialty content is scaled across multi-hospital networks.
| Opportunity | (~) % Potential CAGR Upside | Geographic Relevance | Execution Window |
|---|---|---|---|
| Trial-grade RWD analytics | +2.4% | North America core, EU, Japan | Medium term |
| Specialty care episode analytics | +2.1% | North America core, EU | Short term |
| SME hospital SaaS tiering | +1.8% | APAC emerging, LATAM, MEA | Medium term |
| Genomics-clinical fusion | +2.7% | US, EU, China, Gulf | Long term |
| EHDS secondary-use platforms | +2.0% | EU | Medium term |
| AI device evidence ops | +1.9% | US, EU, developed APAC | Short term |
Drivers
Ambient AI and clinical workflow automation.
Ambient AI has moved from pilot to scaled operational tool, with nearly two-thirds of U.S. hospitals on Epic reportedly using ambient AI tools in 2025 and adoption rising to 64.7% in metropolitan hospitals versus 54.3% in nonmetropolitan facilities, indicating that workflow AI is no longer experimental in the most digitized provider environments.
This matters for clinical analytics because ambient documentation does not just save transcription time; it creates a larger, more structured clinical data exhaust that can be mined for coding optimization, quality measure abstraction, risk adjustment, physician productivity, and next-best-action prompts, shifting vendors from selling dashboards to selling embedded workflow intelligence.
The unit economics improve when clinicians generate cleaner encounter data at source, reducing abstraction labor and denial risk while increasing downstream utility across CDI, utilization review, and longitudinal care pathways; with 6,100 hospitals in the U.S. market and clear diffusion advantages among larger, financially stronger systems. T
he monetization path favors enterprise SaaS, per-seat copilots, and analytics bundles rather than one-time software licenses, justifying roughly +2.1 percentage points of CAGR support over the forecast base
| Driver | (~) % Impact on CAGR Forecast | Geographic Relevance | Impact Timeline |
|---|---|---|---|
| Interoperability compliance and FHIR data liquidity | +2.4% | North America core, EU follow-through, APAC digital corridors | Short term (≤ 2 years) |
| Ambient AI and clinical workflow automation | +2.1% | North America core, UK & Nordics, Australia, advanced APAC systems | Short term (≤ 2 years) |
| Value-based care and payer-provider integration | +1.9% | U.S. core, Canada, Western Europe spill-over, GCC pilots | Medium term (2-4 years) |
| Chronic disease burden and population-risk stratification | +1.7% | U.S., EU5, Japan, urban China, Gulf states | Medium term (2-4 years) |
| Real-world evidence and precision medicine analytics | +1.5% | U.S., EU, Japan, South Korea, Singapore | Medium term (2-4 years) |
| Cloud-native platform migration and multi-site scale economics | +1.3% | North America, EU, India, Southeast Asia, Latin America spill-over | Long term (≥ 4 years) |
Retstraints
Clinical data quality fragmentation.
Even where data-sharing rails exist, the analytic signal is often weak because source data remain inconsistent, incomplete, and biased across ambulatory settings, community hospitals, labs, imaging providers, and emerging-market care networks.
Real-world deployment teams routinely face missing fields, unstructured clinician notes, irregular update frequency, and nonstandard coding across facilities, which can force 20-40% of implementation effort into data cleansing, labeling, lineage tracing, and feature engineering before models are production-ready, while weak representativeness can impair external validity and bias outcomes in underserved populations.
This is especially restrictive in APAC, Latin America, and lower-digitized regional systems where fragmented provider landscapes limit scalable longitudinal records; the strategic effect is lower model accuracy, more false alerts, reduced clinician trust, and slower enterprise rollouts, making data quality a persistent long-tail drag worth about 1.7 percentage points on sector growth.
| Restraint | (~) % Impact on CAGR Forecast | Geographic Relevance | Impact Timeline |
|---|---|---|---|
| Interoperability retrofit cost | -2.1% | North America core, EU, Japan, ANZ | Medium term (2-4 years) |
| Data privacy and secondary-use limits | -1.8% | EU, UK, U.S. regulated segments | Medium term (2-4 years) |
| Cybersecurity compliance inflation | -1.6% | U.S. core, EU, GCC, advanced APAC | Short term (≤ 2 years) |
| AI validation and explainability burden | -1.5% | U.S., EU, Canada, mature APAC | Medium term (2-4 years) |
| Clinical data quality fragmentation | -1.7% | APAC corridors, LATAM, U.S. community care, CEE | Long term (≥ 4 years) |
| Procurement and budget compression | -1.3% | Europe, U.S. provider market, selective APAC public systems | Short term (≤ 2 years) |
Regional Analysis
North America Dominates the Clinical Analytics Market with Strong Digital Healthcare Adoption.
In 2025, North America dominated the clinical analytics market, accounting for over 44.7% share and generating revenue of US$ 34.1 Billion, driven by advanced healthcare IT infrastructure, widespread adoption of electronic health records, and strong presence of major healthcare analytics providers.
The region benefits from high digitalization across hospitals, integrated data systems, and supportive regulatory frameworks that encourage data-driven clinical decision-making. The United States remains the primary contributor, with significant investments in AI-enabled analytics, population health management, and value-based care initiatives.
Canada also contributes steadily through expanding hospital digitization and government-backed health data programs. Europe holds the second-largest share, supported by increasing adoption of interoperable health systems, growing emphasis on patient-centric care, and rising investments in healthcare AI solutions, particularly in Germany, the United Kingdom, and France.
Asia-Pacific is expected to witness the fastest growth due to rapid healthcare infrastructure development, increasing patient volumes, and expanding government initiatives for digital health transformation in countries such as China, India, and Japan.
Meanwhile, Latin America and the Middle East & Africa are gradually adopting clinical analytics solutions, supported by healthcare modernization efforts and improving IT connectivity across healthcare facilities. Overall, digital transformation continues to reshape regional healthcare analytics adoption patterns significantly worldwide.
Key Regions and Countries
North America
- The US
- Canada
Europe
- Germany
- France
- The U.K.
- Italy
- Spain
- Russia & CIS
- Rest of Europe
Asia Pacific
- China
- India
- Japan
- South Korea
- ASEAN
- Australia & New Zealand
- Rest of Asia Pacific
Middle East & Africa
- GCC
- South Africa
- Rest of Middle East & Africa
Latin America
- Brazil
- Mexico
- Rest of Latin America
Key Player Analysis
The clinical analytics market is moderately consolidated, characterized by strong competition among a few dominant global healthcare IT ecosystems alongside several specialized analytics vendors. Competitive dynamics are shaped by accelerating adoption of AI-driven clinical decision support, expanding electronic health record (EHR) integration, and rising demand for real-time, interoperable healthcare data platforms.
Innovation remains highly concentrated on predictive analytics, cloud-native architectures, and advanced data interoperability that enhances clinical efficiency and patient outcomes. Market participants are increasingly focused on embedding analytics directly into clinical workflows, reducing operational complexity while improving decision accuracy.
Key players such as IBM (IBM Watson Health / Merative), Oracle Health (including Cerner), SAS Institute, and Optum (UnitedHealth Group) are strengthening their positions through sustained investment in artificial intelligence, machine learning models, and large-scale data analytics platforms.
These companies emphasize ecosystem-driven strategies, forming strategic collaborations with hospitals, payers, and research institutions to expand data accessibility and improve population health insights. Similarly, Epic Systems, McKesson Corporation, and GE HealthCare are focusing on deep EHR integration, operational analytics, and hospital workflow optimization.
Siemens Healthineers and Koninklijke Philips are advancing imaging-based analytics and connected care solutions, while IQVIA and Flatiron Health (Roche) are enhancing real-world evidence generation and oncology-focused analytics.
Meanwhile, Veradigm (ex-Allscripts analytics), MedeAnalytics, and Health Catalyst are driving niche innovation through agile, cloud-based analytics platforms tailored for mid-sized healthcare providers. The “Others” segment continues to support market diversification with specialized regional and use-case-specific solutions.
Top Key Players
- IBM (IBM Watson Health / Merative)
- Oracle Health (incl. Cerner)
- SAS Institute
- Optum (UnitedHealth Group)
- McKesson Corporation
- Epic Systems
- Veradigm (ex‑Allscripts analytics)
- GE HealthCare
- Siemens Healthineers
- Koninklijke Philips
- IQVIA
- Flatiron Health (Roche)
- Change Healthcare
- MedeAnalytics
- Health Catalyst
- Others
Recent Developments
- In January 2025, Health Catalyst announced the acquisition of Upfront Healthcare Services to expand its healthcare analytics capabilities with patient engagement and personalization solutions. The acquisition strengthened Health Catalyst’s ability to combine clinical data insights with patient activation tools, supporting more connected care management and improved healthcare outcomes.
- In May 2025, IBM announced a collaboration with API Holdings to implement IBM Instana’s AI-driven observability platform across its digital healthcare technology infrastructure. The deployment helped improve real-time monitoring and operational performance, achieving up to 30% reduction in mean time to resolution (MTTR) for application-related issues.
- In January 2026, Oracle launched the Oracle Life Sciences AI Data Platform, combining generative AI capabilities with healthcare real-world data analytics. The platform integrates more than 129 million de-identified longitudinal Oracle Health Real-World Data records, enabling faster clinical research, evidence generation, and advanced healthcare analytics applications.
Report Scope
| Report Features | Description |
|---|---|
| Market Value (2025) | US$ 76.4 Billion |
| Forecast Revenue (2035) | US$ 892.7 Billion |
| CAGR (2026-2035) | 27.9% |
| Base Year for Estimation | 2025 |
| Historic Period | 2020-2024 |
| Forecast Period | 2026-2035 |
| Report Coverage | Revenue Forecast, Market Dynamics, Competitive Landscape, Recent Developments |
| Segments Covered | By Type (Descriptive analytics, Predictive analytics, Prescriptive analytics, Diagnostic analytics), By Component (Software, Services, Hardware), By Deployment Mode (Cloud-based, On-premise, Web-hosted), By Application (Clinical data and outcomes analytics, Population health and risk analytics, Precision medicine and decision support, Research and clinical trial analytics), By End-user (Healthcare providers, Healthcare payers, Life sciences and pharma/biotech) |
| Regional Analysis | North America – The US, Canada; Europe – Germany, France, U.K., Italy, Spain, Russia & CIS, Rest of Europe; Asia Pacific – China, India, Japan, South Korea, ASEAN, Australia & New Zealand, Rest of Asia Pacific; Middle East & Africa – GCC, South Africa, Rest of Middle East & Africa; Latin America – Brazil, Mexico, Rest of Latin America |
| Competitive Landscape | IBM (IBM Watson Health / Merative), Oracle Health (incl. Cerner), SAS Institute, Optum (UnitedHealth Group), McKesson Corporation, Epic Systems, Veradigm (ex‑Allscripts analytics), GE HealthCare, Siemens Healthineers, Koninklijke Philips, IQVIA, Flatiron Health (Roche), Change Healthcare, MedeAnalytics, Health Catalyst, Others |
| Customization Scope | Customization for segments, region/country-level will be provided. Moreover, additional customization can be done based on the requirements. |
| Purchase Options | We have three licenses to opt for: Single User License, Multi-User License (Up to 5 Users), Corporate Use License (Unlimited User and Printable PDF) |





































