


Market Overview
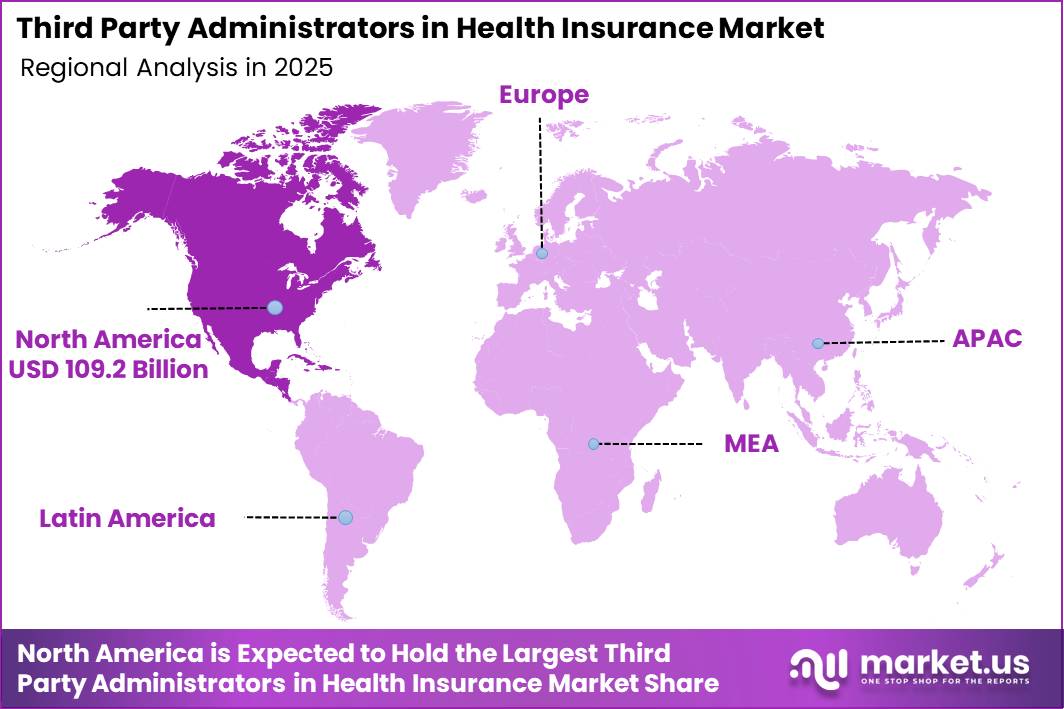
Global Third Party Administrators in Health Insurance Market size is expected to be worth around US$ 915.2 Billion by 2035 from US$ 261.3 Billion in 2025, growing at a CAGR of 13.4% during the forecast period from 2026 to 2035. In 2025, North America led the market, achieving over 41.8% share with a revenue of US$ 109.2 Billion.
The Third Party Administrators (TPAs) in health insurance market is expanding as insurers, employers, and public health programs increasingly outsource claims processing, policy administration, provider network management, and customer support.
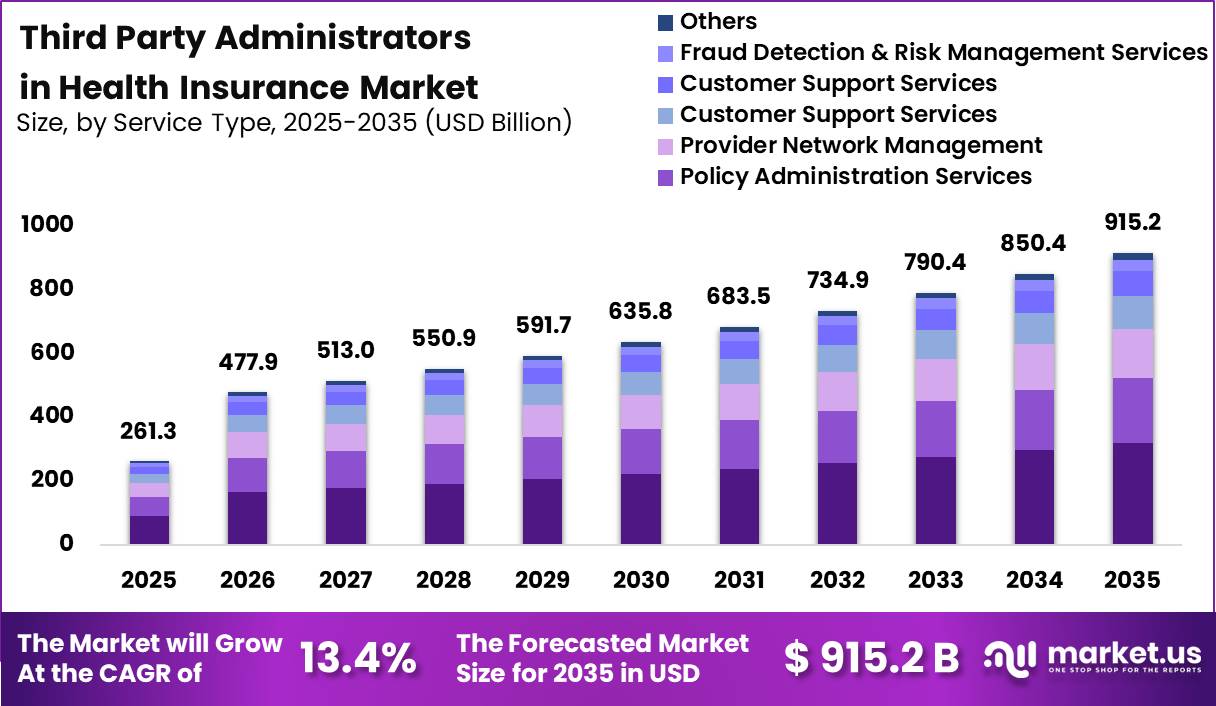
Rising health insurance enrollment, digital claims processing, and stricter regulatory requirements are encouraging greater use of specialized administrative service providers. TPAs also help reduce administrative burden, improve claim accuracy, enhance fraud detection, and accelerate reimbursement cycles, making them an essential part of modern healthcare financing systems.
Healthcare spending continues to rise globally, creating greater demand for efficient insurance administration. According to the U.S. Centers for Medicare & Medicaid Services (CMS), national health expenditure reached US$ 5.3 trillion in 2024, increasing 7.2% from the previous year and representing 18.0% of U.S. GDP.
Private health insurance spending alone totaled US$ 1.64 trillion, accounting for 31% of all healthcare expenditures, while Medicare spending reached US$ 1.12 trillion and Medicaid spending totaled US$ 931.7 billion.
CMS also projects that total U.S. healthcare spending will grow by an average 5.4% annually during 2025–2034, reflecting continued expansion in insurance administration activities.
Government initiatives supporting standardized electronic healthcare transactions are further strengthening the role of TPAs. Under the Health Insurance Portability and Accountability Act (HIPAA), CMS Administrative Simplification regulations require standardized electronic claims, eligibility verification, payment processing, and remittance transactions across healthcare providers, insurers, and clearinghouses.
These standards improve interoperability, reduce paperwork, lower administrative costs, and support faster claims settlement, creating favorable conditions for advanced third-party administration platforms and digital claims management solutions.
Insurance enrollment continues to expand across public and private programs, increasing administrative workloads handled by TPAs. CMS regularly reports growth in Medicare enrollment and Health Insurance Exchange participation, while federal datasets continue to monitor millions of beneficiaries across Medicare, Medicaid, Medicare Advantage, and Part D programs.
The increasing volume of insured individuals requires scalable claims processing, customer service, utilization management, and provider network administration, all of which are core functions performed by third-party administrators.
Key Takeaways
- Market Size : Third Party Administrators in Health Insurance Market size is expected to be worth around US$ 915.2 Billion by 2035 from US$ 261.3 Billion in 2025.
- Market Share : The market is growing at a CAGR of 13.4% during the forecast period from 2026 to 2035.
- Service Type Analysis : The Claims Management Services segment dominated the Third Party Administrators (TPAs) in Health Insurance market, accounting for 34.8% of the market share in 2025.
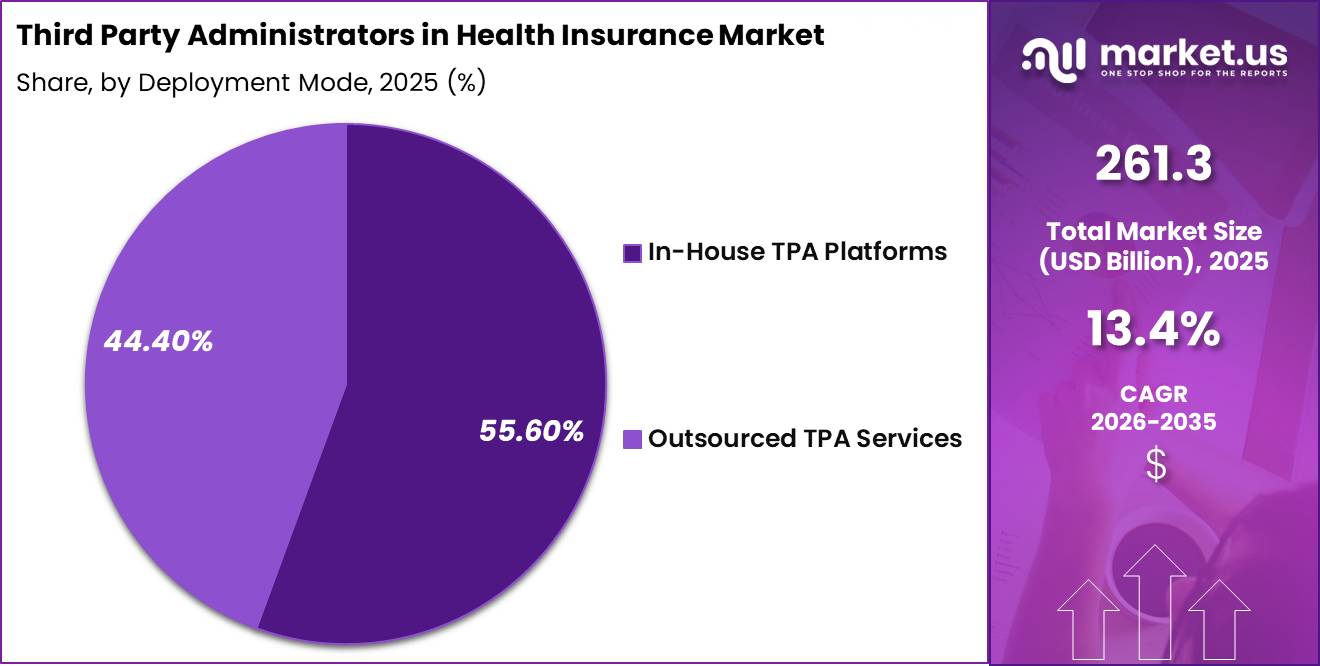
- Deployment Mode Analysis : The In-House TPA Platforms segment held the largest share of the Third Party Administrators in Health Insurance market, capturing 55.6% in 2025.
- Application Analysis : The Claims Processing segment dominated the Third Party Administrators in Health Insurance market with 23.5% of the market share in 2025.
- End User Analysis : The Health Insurance Companies segment dominated the Third Party Administrators in Health Insurance market, accounting for 42.6% of the market share in 2025.
- Regional Analysis : In 2025, North America led the market, achieving over 41.8% share with a revenue of US$ 109.2 Billion.
Service Type Analysis
The Claims Management Services segment dominated the Third Party Administrators (TPAs) in Health Insurance market, accounting for 34.8% of the market share in 2025. This leadership is driven by the growing volume of health insurance claims, increasing demand for faster settlements, and the need to reduce administrative costs for insurers and employers.
TPAs play a vital role in claim verification, cashless authorization, reimbursement processing, and coordination with hospitals and healthcare providers. Regulatory requirements, including Medicare Coordination of Benefits and standardized electronic claims transactions, continue to strengthen demand for professional claims administration services.
Policy Administration Services held 22.4% of the market as insurers increasingly outsource policy issuance, renewals, premium administration, and member record management to improve operational efficiency.
Provider Network Management accounted for 16.7%, supported by the expansion of hospital and physician networks to improve access to care. Customer Support Services represented 11.5%, driven by rising expectations for digital assistance and 24/7 member support.
Care Management Services captured 8.3%, reflecting growing emphasis on chronic disease management and utilization review. Fraud Detection & Risk Management Services contributed 4.1%, benefiting from greater adoption of AI-based fraud analytics and compliance tools, while the Others segment represented the remaining 2.2%, including reporting, wellness, and specialized administrative services.
Deployment Mode Analysis
The In-House TPA Platforms segment held the largest share of the Third Party Administrators in Health Insurance market, capturing 55.6% in 2025. Large insurers and healthcare organizations increasingly invest in proprietary administrative platforms to maintain greater control over claims processing, member data, regulatory compliance, and operational performance.
Internal platforms also allow organizations to integrate advanced technologies such as automation, artificial intelligence, and analytics while ensuring compliance with HIPAA electronic transaction standards and secure data management requirements.
The Outsourced TPA Services segment accounted for 44.4% of the market and continues to grow as insurers, employers, and government health programs seek specialized expertise without significant infrastructure investments.
Outsourcing enables organizations to improve claims turnaround time, manage provider networks efficiently, reduce operating costs, and access scalable administrative capabilities during periods of rising insurance enrollment.
Independent TPAs also offer flexibility by delivering customized benefit administration, customer support, fraud detection, and care management services. As healthcare systems become increasingly digital and regulatory requirements continue to evolve, both deployment models remain essential, with organizations selecting the approach that best aligns with their operational strategy, compliance needs, and long-term technology investments.
Application Analysis
The Claims Processing segment dominated the Third Party Administrators in Health Insurance market with 23.5% of the market share in 2025. Increasing insurance enrollment, higher claim volumes, and the need for faster reimbursements continue to drive demand for efficient claims administration.
TPAs streamline claim validation, pre-authorization, settlement, and coordination between insurers, employers, providers, and beneficiaries. Regulatory initiatives promoting standardized electronic claims and coordination of benefits further strengthen this segment’s leadership.
Benefits Administration remained another important application as organizations increasingly outsource employee health benefit management to improve efficiency and reduce administrative costs.
Enrollment & Eligibility Management continued to expand with growing health insurance participation and digital enrollment platforms. Medical Cost Management gained traction through utilization review, case management, and cost containment programs that help insurers manage rising healthcare expenses.
Provider Network Administration remained essential for maintaining hospital partnerships, negotiating reimbursement arrangements, and ensuring access to quality healthcare services.
Regulatory Compliance Management also experienced strong demand as insurers comply with evolving healthcare regulations, reporting standards, and privacy requirements.
The Others category includes analytics, member engagement, wellness program administration, and customized healthcare support services, further broadening the role of TPAs across the health insurance ecosystem.
End User Analysis
The Health Insurance Companies segment dominated the Third Party Administrators in Health Insurance market, accounting for 42.6% of the market share in 2025. Health insurers increasingly rely on TPAs to manage claims administration, customer support, provider networks, utilization review, and regulatory compliance while improving operational efficiency and reducing administrative costs.
The expansion of digital claims processing, electronic transactions, and value-based healthcare models continues to strengthen outsourcing demand among insurers.
Self-Insured Employers represented the second-largest end-user group as organizations increasingly outsource benefit administration and claims management to reduce costs while offering competitive employee healthcare benefits.
Government Health Programs also contributed significantly through Medicare, Medicaid, and other publicly funded insurance programs that require efficient coordination of benefits and claims administration.
Healthcare Providers increasingly utilize TPA services to improve reimbursement management, eligibility verification, and payment coordination with insurers. Corporate Organizations continue adopting TPA services to manage employee healthcare plans, wellness initiatives, and compliance requirements more effectively.
The Others segment includes labor unions, educational institutions, and specialized health plans that rely on third-party administrators for customized insurance administration, reporting, and healthcare support services.
Market Segmentations
Service Type
- Claims Management Services
- Policy Administration Services
- Provider Network Management
- Customer Support Services
- Care Management Services
- Fraud Detection & Risk Management Services
- Others
Deployment Mode
- In-House TPA Platforms
- Outsourced TPA Services
Application
- Claims Processing
- Benefits Administration
- Enrollment & Eligibility Management
- Medical Cost Management
- Provider Network Administration
- Regulatory Compliance Management
- Others
End User
- Health Insurance Companies
- Self-Insured Employers
- Government Health Programs
- Healthcare Providers
- Corporate Organizations
- Others
Driver
Diabetes Complexity Drives Chronic Care Claims Administration Growth
Chronic disease prevalence is enlarging the volume and intensity of claims administration, care navigation, and eligibility verification tasks that TPAs monetize.
CDC reports 40.1 million people in the United States had diabetes in 2023, about 1 in 8 people, and more than 1 in 4 adults with diabetes were unaware they had it; NIDDK also notes 97.6 million adults had prediabetes in 2021, creating a large forward pipeline of monitoring, diagnostics, pharmacy, and complication related claims activity.
Globally, WHO states the number of people living with diabetes rose from 200 million in 1990 to 830 million in 2022, which reinforces the structural direction of higher chronic care administration across payer systems.
For TPAs, this is not just a volume story diabetes pushes recurring claims across labs, devices, outpatient visits, renal/cardiovascular complications, and medication adherence programs, so administrators with disease specific edit rules, fraud waste abuse triggers, and case routing logic gain pricing power through lower avoidable denials and better claims accuracy.
The resulting revenue uplift usually appears through higher per member per month administrative intensity, more nurse review and utilization management add ons, and stronger retention among self insured employers seeking tighter control of high frequency chronic care spend.
| Driver | (~) % Impact on CAGR Forecast | Geographic Relevance | Impact Timeline |
|---|---|---|---|
| Prior-auth automation under CMS rules | +2.4% | North America core, U.S. Medicare Advantage, Medicaid managed care, FFE-linked admin spill-over | Short term (≤ 2 years) |
| Diabetes and chronic-care claims complexity | +1.9% | U.S. core, high-burden counties, global analogues in mature payer systems | Medium term (2-4 years) |
| API-led interoperability and data exchange | +1.7% | North America core, EU digital-health parallels, APAC selective corridors | Medium term (2-4 years) |
| Compliance outsourcing from Section 1557 and audit pressure | +1.3% | U.S. core, federal-program exposed entities, multilingual urban markets | Short term (≤ 2 years) |
| PBM scrutiny and pharmacy-benefit administration redesign | +1.2% | U.S. core, employer plans, Medicare/Medicaid-adjacent programs | Medium term (2-4 years) |
| Prevention, value-based care, and population stratification | +1.0% | U.S. core, employer-sponsored plans, state Medicaid innovation zones | Long term (≥ 4 years) |
Challenge
Legacy Claims Platforms Limit TPA Market Growth and Efficiency Gains
A substantial share of TPAs continue to run mission critical operations on legacy claims administration platforms, often >10–15 years old, with monolithic architectures and limited real time capabilities, introducing structural latency, integration cost, and change risk that together impose an estimated 1.0 percentage point drag on achievable CAGR despite strong outsourcing demand.
These platforms typically process transactions in overnight batches, support only limited configurability for benefit designs, and rely on custom coded adapters for interoperability with modern provider EMRs and payer digital front ends; in practice, this means configuration changes for new employer groups or regulatory updates can take 4–8 weeks instead of 1–2, and any significant change program carries a non trivial risk of claims disruption events affecting tens of thousands of members.
As a result, some insurers retain a portion of administration in house or use multiple TPAs to hedge, fragmenting volumes and reducing economies of scale that would otherwise allow TPAs to bring admin costs per member per month down by 15–25%.
Modern, cloud native claims cores promise straight through processing rates above 80% and support real time adjudication for telehealth and retail clinic encounters, but migrations frequently run over budget by 20–40% and over schedule by 6–12 months because of complex benefit designs and the need to reconcile legacy data structures.
Over 2026–2030, TPAs will need to allocate 3–5% of annual revenue to platform transformation, rationalize application portfolios, and embed AI powered rules engines; until completion, they experience dual run costs, redundant teams, and elevated error risks that blunt the net growth contribution of new contracts and markets for at least a 2–4 year medium term window.
| Challenge | (~) % CAGR Friction Drag | Geographic Relevance | Mitigation Horizon |
|---|---|---|---|
| Fragmented payer–data plumbing | -1.4% | US MA/ACA, EU, India urban | Long term (≥ 4 years) |
| Clinical workforce & coding gaps | -1.2% | US, EU, GCC, India tier-2 | Long term (≥ 4 years) |
| Regulatory volatility & audits load | -0.9% | US MA/Exchange, EU, LATAM | Medium term (2-4 years) |
| Legacy claims platforms drag | -1.0% | North America core, EU, APAC | Medium term (2-4 years) |
| Hospital–TPA trust & denial friction | -0.8% | India, SE Asia, MENA | Medium term (2-4 years) |
| Cybersecurity & PHI breach exposure | -0.7% | Global, esp. US/EU hubs | Long term (≥ 4 years) |
Restraints
Health Data Privacy Enforcement Challenges TPA Digital Growth
Intensifying health data privacy enforcement, particularly coordinated actions by HHS and the FTC on digital health tracking technologies, is creating a materially higher compliance risk envelope for TPAs that operate as data processors across claims, eligibility, and member portals, with enforcement examples since 2023 demonstrating regulatory willingness to pursue civil penalties and consent decrees for health data misuse.
The root cause lies in complex data flows, cookies, pixels, and third party analytics embedded in portals and apps, that can expose sensitive health information to non covered entities; joint FTC HHS communications have targeted at least 130 hospital and telehealth organizations, signalling that administrators of digital benefits ecosystems are next in line for scrutiny.
As a result, TPAs are being forced to accelerate privacy by design remediation, including full audits of tracking technologies across thousands of client branded sites, revising consent flows, and re architecting data warehouses; this can increase compliance and IT security spend by 20–30%, with US$ 3–5 million incremental outlay for mid size TPAs and upwards of US$ 25–40 million for large multi regional players over a 2–3 year window.
Operationally, privacy risk pushes TPAs to throttle or reconfigure advanced analytics and marketing integrations, slowing deployment of member engagement tools and digital upsell programs that typically deliver 2–4% revenue uplift, while simultaneously increasing legal reserves and cyber insurance premiums by double digit percentages.
Strategically, this enforcement overhang leads to conservative product roadmaps, longer sales cycles as employers scrutinize data handling, and higher barriers to entering high margin digital health administration segments, collectively trimming an estimated 1.2 percentage points from CAGR as compliance becomes a significant drag on innovation velocity and monetization of health data analytics.
| Restraint | (~) % Impact on CAGR Forecast | Geographic Relevance | Impact Timeline |
|---|---|---|---|
| Escalating medical cost trend compressing admin margins | -1.8% | U.S., Canada, Western Europe core | Medium term (2–4 years) |
| Intensifying health data privacy & tracking-tech enforcement | -1.2% | U.S., EU, U.K., digital APAC corridors | Short–Medium term (≤ 3 years) |
| Complex Medicare/Medicaid and multi-payer compliance burden | -1.0% | U.S. core, selective OECD markets | Long term (≥ 4 years) |
| Adverse selection in self-funded plans and claims volatility | -0.9% | U.S. employer-sponsored, select LATAM/APAC | Medium term (2–4 years) |
| Talent, technology, and AI infrastructure cost overhang | -0.8% | Global Tier-1 TPAs, urban hubs | Long term (≥ 4 years) |
| Fragmented regulatory regimes for TPAs across jurisdictions | -0.7% | U.S., India, MENA, emerging APAC | Long term (≥ 4 years) |
Opportunity
APAC Hybrid TPA Networks Create Integrated Healthcare Opportunities
In many APAC emerging markets, growing health expenditure as a share of GDP and rapid digital adoption coexist with fragmented provider ecosystems and immature claims infrastructure, creating space for hybrid TPA models that combine administration with curated provider networks and pseudo managed care capabilities, an approach that is not yet embedded in baseline TPA scenarios.
Health spending in several BRICS and emerging Asian economies is projected to increase steadily through 2035, both in absolute per capita terms and as a percentage of GDP, yet payers and governments struggle with hospital overutilization, variable quality of care and cash based outpatient markets, particularly for chronic and noncommunicable diseases.
A TPA that builds narrow or tiered networks with contracted hospitals and clinics, implements digital pre authorization, and introduces case based bundled payments for common procedures can reduce average claims costs by 10–15% and shrink claims cycle times from weeks to days, while commanding 3–5% higher admin fees or per episode coordination fees from insurers.
Given APAC’s forecasted fastest global growth in insurance TPA services, with some estimates putting regional TPA or related service markets at double digit CAGRs through early 2030s, hybrid TPA provider models that capture even 10–15% of incremental health insurance premium growth could translate into multi billion dollar incremental revenue pools by 2035.
Because most TPAs in the region still act as pure processors without contracting leverage or clinical governance, this integrated network management role represents a genuine white space and could add roughly +2.7 percentage points to global TPA market CAGR if scaled across major APAC markets, especially India, Indonesia, Vietnam and the Philippines.
| Opportunity | (~) % Potential CAGR Upside | Geographic Relevance | Execution Window |
|---|---|---|---|
| Chronic care outcome-based TPA platforms | +2.2% | North America, Western Europe | Medium term |
| Integrated digital TPA for self-funded employers | +1.9% | North America core | Short term |
| APAC hybrid TPA-provider networks | +2.7% | APAC emerging markets | Medium term |
| Data-as-a-service & risk analytics monetization | +1.5% | North America, EU, select APAC | Medium term |
| Government program TPA partnerships | +1.3% | North America, LATAM, Asia public schemes | Long term |
| Embedded TPA services in digital health ecosystems | +1.8% | Global urban, digitally mature markets | Medium term |
Regional Analysis
North America dominated the Third Party Administrators (TPAs) in Health Insurance market in 2025, accounting for 41.8% of global revenue, supported by its mature health insurance ecosystem, high insurance penetration, and widespread adoption of outsourced claims management services.
The United States remains the largest contributor, where TPAs support commercial insurers, employer-sponsored health plans, Medicare Advantage, Medicaid managed care, and Affordable Care Act (ACA) Marketplace plans.
A key indicator of the region’s expanding insurance landscape is that 24.2 million consumers selected ACA Marketplace health plans for 2025 coverage, including 3.9 million new enrollees, marking a record level of enrollment according to the U.S. Centers for Medicare & Medicaid Services (CMS).
The continued growth in insured populations is increasing demand for claims administration, customer support, provider network management, and utilization review services provided by TPAs.
Europe represented the second-largest regional market, supported by universal healthcare systems, compulsory health insurance schemes, and ongoing digital transformation in healthcare administration.
According to the OECD, government and compulsory health insurance programs finance approximately three-quarters of total healthcare expenditure across member countries, supporting sustained demand for efficient insurance administration solutions.
Asia-Pacific is expected to witness the fastest growth, driven by expanding health insurance coverage, government healthcare reforms, digital insurance platforms, and rising healthcare spending across China, India, Japan, and Southeast Asia.
Meanwhile, Latin America and the Middle East & Africa are steadily advancing through broader insurance penetration, healthcare infrastructure modernization, and government initiatives aimed at improving healthcare access, creating new opportunities for third-party administrators as insurance enrollment continues to rise.
Key Regions and Countries
North America
- The US
- Canada
Europe
- Germany
- France
- The U.K.
- Italy
- Spain
- Russia & CIS
- Rest of Europe
Asia Pacific
- China
- India
- Japan
- South Korea
- ASEAN
- Australia & New Zealand
- Rest of Asia Pacific
Middle East & Africa
- GCC
- South Africa
- Rest of Middle East & Africa
Latin America
- Brazil
- Mexico
- Rest of Latin America
Key Player Analysis
The Third Party Administrators (TPAs) in Health Insurance market is characterized by a mix of global insurers and specialized benefit administration companies that focus on improving claims efficiency, cost management, and member experience.
Sedgwick is a global leader in claims and benefits administration, serving organizations in more than 80 countries through AI-enabled claims management solutions. UnitedHealth Group offers integrated healthcare and insurance services through its UnitedHealthcare and Optum businesses, strengthening administrative efficiency and care coordination.
Aetna (CVS Health) combines health insurance with pharmacy and care delivery services to simplify benefits administration, while Cigna leverages its extensive provider network and digital health capabilities to deliver integrated employer and health plan solutions.
Anthem Blue Cross (Elevance Health) continues to strengthen its health plan administration through broad provider networks and digital member services. Mercer Health & Benefits provides employee benefits consulting, health plan design, and administrative solutions for employers globally.
HealthSmart focuses on flexible provider networks, claims administration, and cost-containment services for self-funded health plans. MedCost delivers third-party administration and regional provider network solutions that help employers manage healthcare costs, while CoreSource specializes in customized claims administration and benefit management for self-funded organizations.
BenefitMall supports employers and brokers with employee benefits administration, enrollment, and payroll-related services, helping simplify benefit management for businesses.
Allied Benefit Systems, one of the largest independent TPAs in the United States, provides customized self-funded health plan administration, medical management, compliance support, and digital benefit tools, serving more than 14,500 self-insured employers through flexible and data-driven healthcare solutions.
Top Key Players
- Sedgwick
- UnitedHealth Group
- Aetna (CVS Health)
- Cigna
- Anthem Blue Cross
- Mercer Health & Benefits
- HealthSmart
- MedCost
- CoreSource
- BenefitMall
- Allied Benefit Systems
- EBMS
- UMR (UnitedHealthcare)
- Key Benefit Administrators
- HMA (Healthcare Management Administrators)
- Other Key Players
Recent Developments
- In April 2026, UnitedHealthcare (UnitedHealth Group) partnered with healthcare providers to streamline prior authorization, introducing standardized electronic submission requirements to reduce administrative burden, speed approvals, and improve the provider experience. This initiative directly supports more efficient health plan administration and claims processing.
- In December 2025, Aetna (CVS Health) expanded its provider simplification strategy by combining medical and pharmacy prior authorization processes and integrating generative AI features into the Aetna Health app, helping reduce administrative complexity for providers and members.
- In March 2025, The Cigna Group completed the US$3.7 billion sale of its Medicare Advantage, Medicare Part D, Supplemental Benefits, and CareAllies businesses to Health Care Service Corporation (HCSC), allowing the company to focus on its core Evernorth Health Services and employer health benefits businesses.
- In January 2025 – Elevance Health (Anthem Blue Cross) completed the acquisition of Indiana University Health Plans, expanding its commercial and Medicare Advantage business in Indiana and strengthening its regional health plan administration capabilities.
Report Scope
| Report Features | Description |
|---|---|
| Market Value (2025) | US$ 261.3 Billion |
| Forecast Revenue (2035) | US$ 915.2 Billion |
| CAGR (2026-2035) | 13.4% |
| Base Year for Estimation | 2025 |
| Historic Period | 2020-2024 |
| Forecast Period | 2026-2035 |
| Report Coverage | Revenue Forecast, Market Dynamics, Competitive Landscape, Recent Developments |
| Segments Covered | Service Type (Claims Management Services, Policy Administration Services, Provider Network Management, Customer Support Services, Care Management Services, Fraud Detection & Risk Management Services, Others), Deployment Mode (In-House TPA Platforms, Outsourced TPA Services), Application (Claims Processing, Benefits Administration, Enrollment & Eligibility Management, Medical Cost Management, Provider Network Administration, Regulatory Compliance Management, Others), End User (Health Insurance Companies, Self-Insured Employers, Government Health Programs, Healthcare Providers, Corporate Organizations, Others) |
| Regional Analysis | North America – The US, Canada; Europe – Germany, France, U.K., Italy, Spain, Russia & CIS, Rest of Europe; Asia Pacific – China, India, Japan, South Korea, ASEAN, Australia & New Zealand, Rest of Asia Pacific; Middle East & Africa – GCC, South Africa, Rest of Middle East & Africa; Latin America – Brazil, Mexico, Rest of Latin America |
| Competitive Landscape | Sedgwick, UnitedHealth Group, Aetna (CVS Health), Cigna, Anthem Blue Cross, Mercer Health & Benefits, HealthSmart, MedCost, CoreSource, BenefitMall, Allied Benefit Systems, EBMS, UMR (UnitedHealthcare), Key Benefit Administrators, HMA (Healthcare Management Administrators), Other Key Players |
| Customization Scope | Customization for segments, region/country-level will be provided. Moreover, additional customization can be done based on the requirements. |
| Purchase Options | We have three licenses to opt for: Single User License, Multi-User License (Up to 5 Users), Corporate Use License (Unlimited User and Printable PDF) |





































