


Report Overview
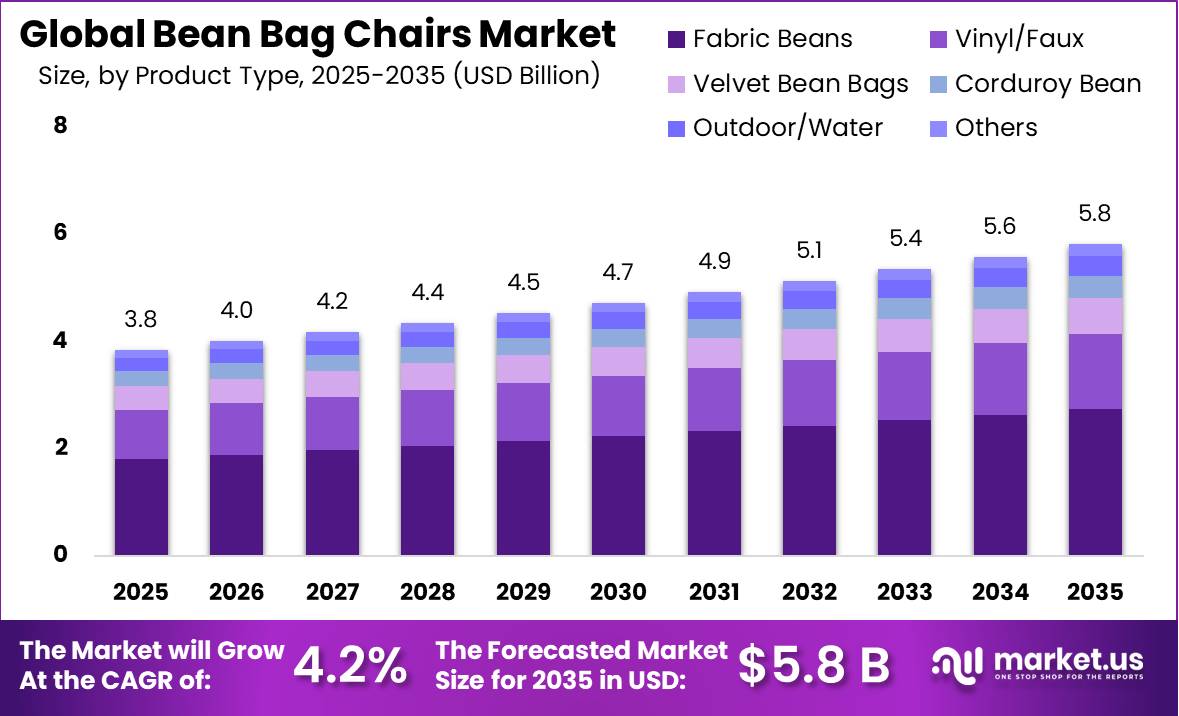
Global Bean Bag Chairs Market size is expected to be worth around USD 5.8 Billion by 2035 from USD 3.8 Billion in 2025, growing at a CAGR of 4.2% during the forecast period 2026 to 2035. This trajectory reflects sustained consumer preference for affordable, portable, and versatile casual seating across residential and commercial applications worldwide.
The bean bag chairs market encompasses a broad range of flexible, fill-based seating products designed for home, commercial, and recreational use. Product lines span fabric, vinyl, velvet, corduroy, and outdoor-resistant constructions, filled primarily with EPS beads, shredded foam, or memory foam. Residential Furniture buyers represent the core demand base, while commercial buyers in hospitality, education, and co-working drive incremental volume globally.
Key Takeaways
- The global Bean Bag Chairs Market was valued at USD 3.8 Billion in 2025 and is forecast to reach USD 5.8 Billion by 2035.
- The market advances at a CAGR of 4.2% from 2026 to 2035.
- By Product Type, Fabric Bean Bags dominate with a 47.3% share in 2025.
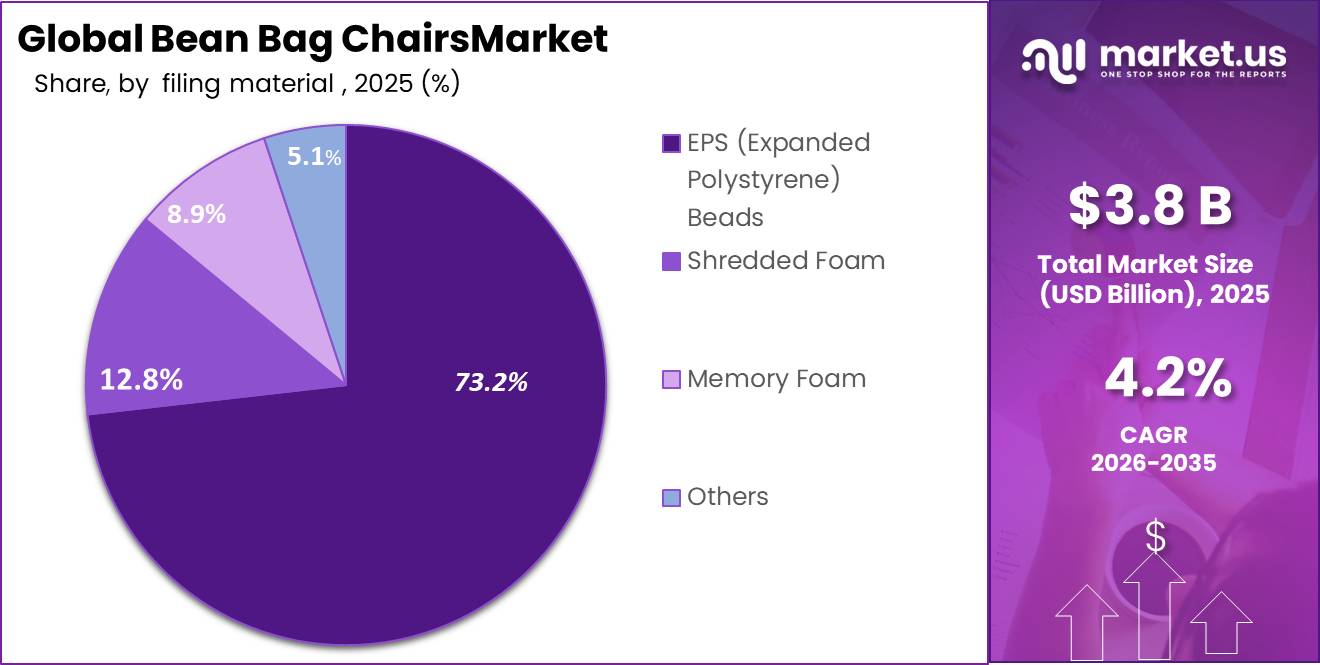
- By Filling Material, EPS (Expanded Polystyrene) Beads hold a dominant 73.2% share.
- By Size, Medium (Single Adult) leads with a 41.5% share.
- By Shape, Round/Pear Shaped holds the highest share at 43.7%.
- By Age Group, Adults (20-59) dominate with a 56.2% share.
- By Application, Residential holds a commanding 84.2% share.
- By Price Range, Mid-Range ($50 to $150) leads with a 48.5% share.
- By Distribution Channel, Online holds a 56.3% share.
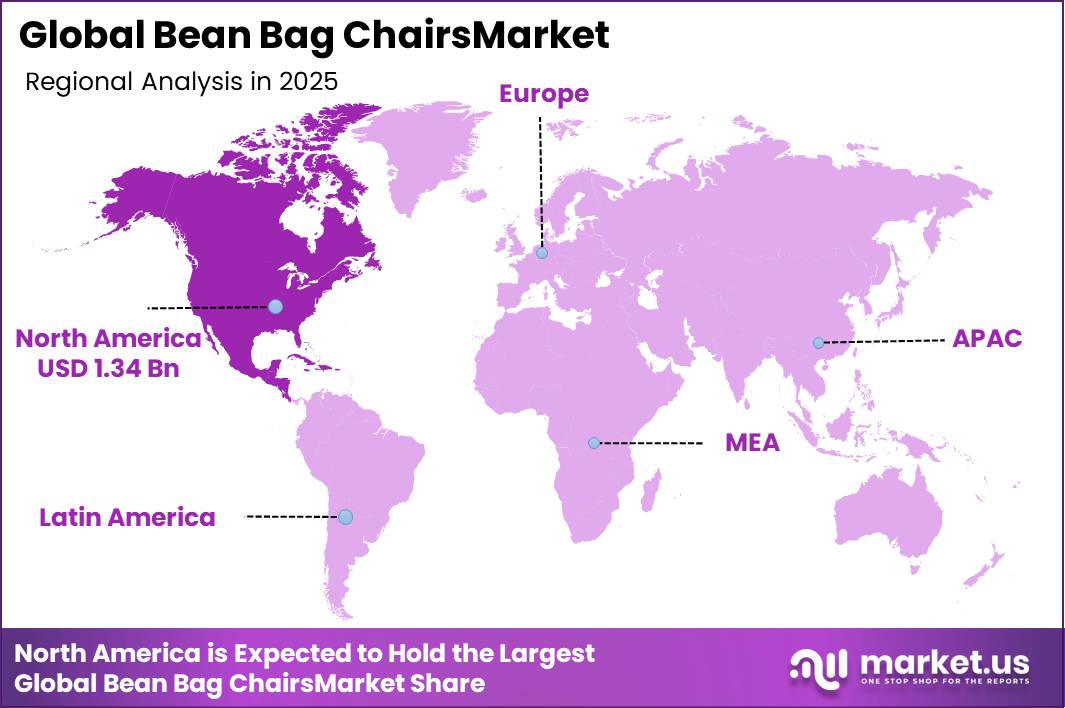
- North America is the dominant region with a 34.8% share, valued at USD 1.34 Billion in 2025.
Government housing and urban development policies directly shape bean bag chair demand. The U.S. Census Bureau found that 36.2% of occupied housing units were renter-occupied in 2023. Renter households consistently favor portable, lightweight furniture that moves with them. This structural renter base locks in a reliable repeat-purchase cycle for affordable bean bag seating. In February 2025, Yogibo launched its J.LEAGUE EDITION collection with officially licensed designs from 23 Japanese football clubs, signaling that licensed and lifestyle-themed bean bag products now reach mainstream retail at scale.
Government housing policies directly shape bean bag chair demand. The U.S. Census Bureau found that 36.2% of occupied housing units were renter-occupied in 2023. Renter households consistently favor portable, lightweight furniture. This structural renter base locks in a reliable repeat-purchase cycle for affordable casual seating products.
Average new apartment size in the United States reached approximately 908 square feet in 2024, reflecting continued growth in compact living environments. Smaller floor plans push buyers toward space-efficient, movable seating rather than fixed upholstered furniture. As a result, bean bag chairs capture discretionary spend that larger furniture categories cannot access in dense urban markets. In February 2025, Yogibo launched a licensed J.LEAGUE EDITION collection featuring designs from 23 Japanese football clubs, signaling that sports and lifestyle co-branding now serve as viable retail growth levers for bean bag manufacturers.
Average new apartment size in the United States reached approximately 908 square feet in 2024, reflecting continued growth in compact living environments. Smaller floor plans push buyers toward space-efficient, movable seating rather than fixed upholstered furniture. As a result, bean bag chairs capture discretionary spend that larger furniture categories cannot access in dense urban markets.
As reported by nypost.com, average new apartment size in the United States reached approximately 908 square feet in 2024, reflecting continued growth in compact living environments. Smaller floor plans push buyers toward space-efficient seating rather than fixed upholstered furniture. As a result, bean bag chairs capture discretionary spend that larger furniture categories cannot access in dense urban markets.
Product Type Analysis
Fabric Bean Bags dominates with 47.3% due to affordability, washability, and broad color availability.
In 2025, Fabric Bean Bags held a dominant market position in the By Product Type segment of the Bean Bag Chairs Market, with a 47.3% share. Fabric covers appeal to the widest buyer demographic because they combine low cost with practical maintenance features. According to the American Pet Products Association, around 66% of U.S. households owned a pet in 2024, reinforcing demand for washable and durable fabric upholstery in home seating products.
Vinyl/Faux Leather Bean Bags hold a 23.8% share, primarily driven by commercial and high-traffic residential buyers. Vinyl surfaces resist stains and moisture more effectively than woven fabrics. This makes Vinyl/Faux Leather the default choice for hospitality venues, children’s spaces, and co-working environments where cleaning frequency and durability requirements are higher.
Velvet Bean Bags account for 11.5% of the market, targeting premium residential buyers who prioritize interior aesthetics. Velvet constructions command higher price points than standard fabric alternatives. Vendors who position velvet bean bags within the Home Decor segment can access a customer base willing to pay above mid-range price thresholds for visual differentiation.
Corduroy Bean Bags hold a 7.2% share, and Outdoor/Water-Resistant Bean Bags capture 6.4%, together with Others at 3.8%, representing a combined niche of buyers seeking textured or weather-durable options. These sub-segments support upsell strategies in hospitality and outdoor living categories, where functional performance justifies premium pricing above standard indoor products.
Filling Material Analysis
EPS (Expanded Polystyrene) Beads dominates with 73.2% due to cost efficiency, lightweight properties, and wide supply availability.
In 2025, EPS (Expanded Polystyrene) Beads held a dominant market position in the By Filling Material segment of the Bean Bag Chairs Market, with a 73.2% share. EPS beads remain the default fill material because they offer low material cost, easy compression for shipping, and a well-established global supply chain. The European Environment Agency reports that furniture consumption in Europe generated approximately 10 million tonnes of CO₂-equivalent emissions annually, putting pressure on manufacturers to develop lower-emission fill alternatives alongside continued EPS use.
Shredded Foam holds a 12.8% share, typically used in entry-level and budget-priced bean bag products. Shredded foam provides firmer seating support than EPS beads but breaks down faster under daily use. Buyers in the economy and mid-range price segments frequently select shredded foam products as functional, short-cycle replacements rather than long-term seating investments.
Memory Foam accounts for an 8.9% share and anchors the premium fill segment. Architectural Digest identified memory-foam filling among the most requested features in premium bean bag chair purchases. This consumer signal confirms that memory foam commands a price premium and that manufacturers supplying it access a higher-margin, quality-driven buyer base less sensitive to cost fluctuations. Others account for the remaining 5.1%.
Size Analysis
Medium (Single Adult) dominates with 41.5% due to fit for solo adult use in standard-sized rooms.
In 2025, Medium (Single Adult) held a dominant market position in the By Size segment of the Bean Bag Chairs Market, with a 41.5% share. The U.S. Census Bureau reports that one-person households accounted for 29% of all U.S. households in 2023. This concentration of solo dwellers creates a structural base of buyers who need single-occupant seating that fits compact living spaces without excess bulk.
Shape Analysis
Round/Pear Shaped dominates with 43.7% due to classic ergonomic form preferred across all age groups.
In 2025, Round/Pear Shaped held a dominant market position in the By Shape segment of the Bean Bag Chairs Market, with a 43.7% share. Better Homes and Gardens reported renewed consumer interest in oversized bean bags as adult-oriented home décor products during 2025. This trend reinforces the round form factor as the primary design benchmark for manufacturers targeting the premium residential buyer segment.
Age Group Analysis
Adults (20-59) dominates with 56.2% due to largest active consumer base with purchasing power.
In 2025, Adults (20-59) held a dominant market position in the By Age Group segment of the Bean Bag Chairs Market, with a 56.2% share. Research from Arizona State University found that flexible seating arrangements increased classroom engagement and collaborative interactions compared with fixed seating layouts. This finding extends beyond education: adult buyers who associate flexible seating with productivity and comfort drive residential adoption among the working-age population.
Application Analysis
Residential dominates with 84.2% due to primary use in home living, gaming, and entertainment spaces.
In 2025, Residential held a dominant market position in the By Application segment of the Bean Bag Chairs Market, with a 84.2% share. The U.S. Department of Housing and Urban Development reported over 45 million renter households in the United States in 2023, supporting demand for portable seating. The Energy Information Administration reports around 80% of U.S. households used at least one television daily, reinforcing the link between home entertainment habits and casual seating demand.
Commercial applications represent the remaining share, encompassing hospitality, education, and co-working environments. The Energy Information Administration reports around 80% of U.S. households used at least one television daily, reinforcing that home entertainment drives residential dominance. Commercial buyers remain a strategic growth segment because contract volume and repeat orders deliver higher per-account revenue than individual residential purchases. In 2025–2026, leading manufacturers focused increasingly on oversized loungers and lifestyle collaborations to serve both residential and commercial channels.
Price Range Analysis
Mid-Range ($50 – $150) dominates with 48.5% due to best value-to-comfort ratio for mainstream buyers.
In 2025, Mid-Range ($50 to $150) held a dominant market position in the By Price Range segment of the Bean Bag Chairs Market, with a 48.5% share. This price band captures the largest share because it sits above impulse-buy thresholds while remaining accessible to renters and young adult buyers. Vendors who anchor their core product lines in this band build the broadest distribution reach across online and offline retail channels.
Distribution Channel Analysis
Online dominates with 56.3% due to convenience, price comparison ease, and home delivery infrastructure.
In 2025, Online held a dominant market position in the By Distribution Channel segment of the Bean Bag Chairs Market, with a 56.3% share. The National Retail Federation reports online sales represented 22.7% of total retail during the 2024 holiday season. This holiday-period momentum confirms that digital channels now anchor furniture purchase decisions, giving online-first bean bag brands a structural conversion advantage over brick-and-mortar competitors.
Offline channels retain the remaining share, serving buyers who prefer in-store tactile evaluation before purchase. According to the U.S. Census Bureau, U.S. e-commerce sales reached approximately USD 1.19 Trillion in 2024. This scale confirms that offline retailers face structural pressure to differentiate through experiential display formats and curated selections rather than competing on breadth or price alone. In December 2025, Lovesac reported progress in sustainability-focused U.S. Sac manufacturing, reflecting how even offline-anchored brands now embed sustainability credentials into their product stories.
Key Market Segments
By Product Type
- Fabric Bean Bags
- Vinyl/Faux Leather Bean Bags
- Velvet Bean Bags
- Corduroy Bean Bags
- Outdoor/Water-Resistant Bean Bags
- Others
By Filling Material
- EPS (Expanded Polystyrene) Beads
- Shredded Foam
- Memory Foam
- Others
By Size
- Small (Kids/Teens)
- Medium (Single Adult)
- Large (Oversized/Adult)
- Extra Large
By Shape
- Round/Pear Shaped
- Chair Shaped
- Oval/Lounger
- Square/Bean Shaped
- Others
By Age Group
- Kids (Under 12)
- Teens (13-19)
- Adults (20-59)
- Seniors (60+)
By Application
- Residential
- Commercial
By Price Range
- Economy (Under $50)
- Mid-Range ($50 – $150)
- Premium ($150 – $300)
- Luxury (Above $300)
By Distribution Channel
- Online
- Offline
Regional Analysis
North America Dominates the Bean Bag Chairs Market with a Market Share of 34.8%, Valued at USD 1.34 Billion
North America commands the largest regional share at 34.8%, valued at USD 1.34 Billion in 2025. The region’s dominance reflects a combination of high e-commerce penetration, strong renter household density, and well-established direct-to-consumer furniture brands. Retailers here benefit from compressed supply chains, high consumer spending on home furnishing products, and a digital-first shopping culture that directly favors online bean bag sales.
Europe represents the second-largest regional market, supported by both urban density and tightening sustainability requirements. Figures from Eurostat show more than 70% of European Union citizens live in urban areas, creating structural demand for compact and adaptable furniture. European buyers also respond to sustainability credentials, giving manufacturers with recycled-fill or eco-certified products a clear pricing and positioning advantage in this region.
Asia Pacific is the fastest-growing regional market, driven by urbanization, a large youth population, and e-commerce infrastructure expansion across China, India, and Southeast Asia. In March 2026, Yogibo announced participation in the Wonderia Yokohama immersive entertainment facility, reflecting how bean bag brands are using experiential retail to build awareness in high-density Asian urban markets. This approach accelerates category trial among first-time buyers.
Latin America and the Middle East and Africa represent emerging demand regions where urban co-living, hospitality investment, and youth demographics create incremental volume. In December 2025, Yogibo deployed a creator-led Christmas campaign featuring Ryan Suzuki, demonstrating that influencer-driven seasonal campaigns now serve as a scalable consumer engagement model for bean bag brands operating across diverse regional markets.
Key Regions and Countries
North America
- US
- Canada
Europe
- Germany
- France
- The UK
- Spain
- Italy
- Rest of Europe
Asia Pacific
- China
- Japan
- South Korea
- India
- Australia
- Rest of APAC
Latin America
- Brazil
- Mexico
- Rest of Latin America
Middle East and Africa
- GCC
- South Africa
- Rest of MEA
Market Dynamics
Market Opportunity Analysis - Underserved commercial, premium, and emerging regional segments offer scalable entry points for new players
The Commercial application segment holds the smallest share in the By Application breakdown but represents the highest-margin expansion path for bean bag chair manufacturers. Hospitality, co-working, and educational buyers purchase in contract volumes that individual residential customers cannot match. New entrants who target commercial procurement channels with weather-resistant, easily cleaned, and stackable formats will differentiate on function rather than price.
The Bedroom Furniture and premium seating sub-segments within the By Price Range breakdown remain underpenetrated relative to their addressable consumer base. Premium ($150 to $300) and Luxury (Above $300) tiers together sit below the Mid-Range’s 48.5% dominance, indicating that consumer willingness to spend more exists but brands have not yet built sufficient conviction at those price points. Investors backing brands with a clear premium product story and design differentiation will access the highest-margin buyer cohorts in the market.
The Outdoor/Water-Resistant Bean Bags sub-type holds only a 6.4% share despite the structural growth of hospitality and resort markets globally. This gap signals a category that buyers want but that manufacturers have not yet scaled effectively. By contrast, brands that invest in UV-resistant, quick-dry materials and commercial-grade durability ratings can capture both consumer and B2B outdoor seating budgets that no incumbent currently dominates.
Asia Pacific’s emerging markets, including India, Southeast Asia, and second-tier Chinese cities, represent the lowest-penetrated geography relative to urban population density and youth demographics. E-commerce infrastructure in these markets now supports direct-to-consumer bean bag sales at scale. New entrants offering localized sizing, culturally relevant designs, and price points calibrated to regional income levels will build durable first-mover positions before established Western brands complete their regional rollouts.
The premium and Bedroom Furniture seating sub-segments within the By Price Range breakdown remain underpenetrated relative to their addressable base. Premium ($150 to $300) and Luxury (Above $300) tiers sit below the Mid-Range’s 48.5% share, indicating that consumer willingness to spend more exists but brands have not yet built conviction at those price points. Investors backing brands with clear premium positioning access the highest-margin buyer cohorts in the market.
Premium ($150 to $300) and Luxury (Above $300) price tiers sit well below the Mid-Range’s 48.5% dominance, signaling an underpenetrated high-margin opportunity. Consumer willingness to spend more exists, but existing brands have not built sufficient product conviction at those price points. Investors backing brands with clear premium positioning will access the highest-margin buyer cohorts the market currently underserves.
Technology and Innovation Landscape - Microbead fill systems, washable covers, and smart product integration define the next competitive frontier
High-density microbead fill technology represents the most commercially validated innovation in the bean bag chairs market. Moon Pod’s proprietary microbead system delivers body-contouring support that standard EPS bead products cannot replicate. This technical gap gives microbead specialists a defensible margin advantage in the premium segment, as buyers who experience microbead seating rarely return to conventional EPS alternatives.
Washable, removable, and pet-friendly upholstery systems have moved from a feature request to a purchase prerequisite in premium residential segments. Architectural Digest identified removable covers and washable fabrics among the most requested features in premium bean bag purchases. Manufacturers who engineer detachable cover systems with machine-washable performance fabrics reduce returns, extend product lifecycle, and create an accessories upsell stream through replacement cover sales.
Memory foam fill integration is reshaping the upper end of the By Filling Material segment. Memory foam’s pressure-distributing properties align with orthopedic and neurodiverse use cases, opening a medically adjacent market beyond standard home entertainment seating. Brands that obtain orthopedic endorsements or clinical validation for memory-foam bean bags will access healthcare and special needs procurement budgets that commodity competitors cannot reach.
Embedded connectivity, heating, and cooling functions represent the next-generation product direction for the Furniture Fixtures Equipment category. Smart bean bags with IoT-enabled features can generate data on usage patterns, fill compression, and product lifecycle, creating service revenue models beyond one-time sales. Brands that invest in smart connectivity now will build product ecosystems that lock in repeat buyers through software updates, refill tracking, and subscription cover services.
Washable, removable, and pet-friendly upholstery systems have moved from optional features to purchase prerequisites in premium residential segments. Manufacturers who engineer detachable cover systems with machine-washable performance fabrics reduce product returns and extend lifecycle. This technical investment also creates an accessories upsell stream through replacement cover sales, converting a one-time purchase into a recurring revenue relationship with the buyer.
Drivers
Flexible, multi-use seating demand reshapes the bean bag chairs market as consumers increasingly favor furniture that transitions across gaming, reading, streaming, and guest overflow without occupying fixed floor space. U.S. new home sales ran at a 622,000 annualized pace in April 2026, with median new-home pricing at USD 422,500 and inventory at 489,000 units. Lower-ticket, movable seating captures spend that large furniture purchases miss under affordability pressure.
This driver carries greatest force in urban and high-density markets where floor-plan efficiency matters most. Brands that offer modular sizing, washable outer shells, and room-specific merchandising bundles align directly with how buyers furnish compact homes today. E-commerce reach for compressible seating adds an estimated +1.4 percentage-point uplift to CAGR, while casual multi-use living trends add approximately +1.1 percentage points over the medium term.
| Driver | (~) % Impact on CAGR Forecast | Geographic Relevance | Impact Timeline |
|---|---|---|---|
| E-commerce reach for compressible seating | +1.4% | North America core, UK, EU urban, India metros, ASEAN cities | Short term (≤ 2 years) |
| Casual multi-use living and small-space furniture mix | +1.1% | North America, Western Europe, Japan, South Korea, Tier-1 APAC cities | Medium term (2-4 years) |
| Sustainable covers and refillable fill systems | +0.9% | EU core, UK, North America premium, Australia | Medium term (2-4 years) |
| Hospitality, co-working and event lounge adoption | +0.8% | GCC, Southeast Asia, North America, Southern Europe | Short term (≤ 2 years) |
| Gaming, youth rooms and creator-led demand | +0.7% | US, Canada, UK, Germany, India, Brazil | Short term (≤ 2 years) |
| Safety compliance and premiumization shift | +0.5% | North America core, EU, Australia | Long term (≥ 4 years) |
Restraints
Trade policy directly restrains the bean bag chairs market through layered U.S. tariff structures. Import rates on furniture can reach up to 25% depending on origin, with China-linked sourcing facing especially high effective burdens. A supplier with a pre-tariff landed cost of USD 28 to USD 32 per unit can absorb import-cost inflation of USD 2.8 to USD 8.0 before warehouse and retail markups apply.
This cost inflation forces either 10% to 20% shelf-price resets or margin sacrifice. E-commerce conversion drops sharply once casual furniture crosses key price thresholds such as USD 49, USD 79, or USD 99. Tariff-led import inflation creates an estimated 0.9-point drag on near-term CAGR in North America-centric demand models, slowing replenishment cycles and delaying investment in new product development.
| Restraint | (~) % Impact on CAGR Forecast | Geographic Relevance | Impact Timeline |
|---|---|---|---|
| EPS/fabric cost volatility | -1.1% | APAC supply base, EU, North America | Short term (≤ 2 years) |
| Tariff-led import inflation | -0.9% | North America core, China-linked lanes | Short term (≤ 2 years) |
| Soft discretionary demand | -1.0% | North America core, EU, urban APAC | Medium term (2-4 years) |
| Compliance cost escalation | -0.7% | EU, UK, India, premium export corridors | Medium term (2-4 years) |
| Freight and replenishment risk | -0.5% | APAC corridors, EU importers, US importers | Short term (≤ 2 years) |
| Low durability and replacement drag | -0.8% | Global mass market | Long term (≥ 4 years) |
Challenges
Furniture logistics volatility persistently challenges bean bag manufacturers because the category depends on transporting bulky, low-density products whose shipping costs fluctuate sharply with ocean and inland freight rates. In mid-2026, global container freight benchmarks remained above 3,100 points and more than 40% higher than a month earlier. Key Asia-Europe routes such as Shanghai to Rotterdam recorded spot-rate increases of approximately 15% week-on-week to over USD 4,300 per 40-foot container.
A USD 1,000 change in container costs raises landed costs by approximately 3 to 6%, reducing pricing flexibility and extending retailer reorder cycles by 2 to 3 weeks. Manufacturers improving container utilization by 10 to 20% and adopting near-shoring strategies can cut transit times by 7 to 10 days. However, ongoing freight-rate volatility reduces the market’s achievable CAGR by an estimated 1.0 percentage point.
| Challenge | (~) % CAGR Friction Drag | Geographic Relevance | Mitigation Horizon |
|---|---|---|---|
| Volatile foam inputs | -1.2% | North America, APAC manufacturing hubs | Medium term (2-4 years) |
| Furniture logistics volatility | -1.0% | Transpacific, Asia–EU corridors | Medium term (2-4 years) |
| Tight upholstery compliance | -0.8% | EU regulatory hubs, UK, Nordics | Long term (≥ 4 years) |
| Sustainability & packaging pressure | -0.9% | EU, North America core, developed APAC | Long term (≥ 4 years) |
| Fragmented e-commerce fulfillment | -0.7% | North America, Western Europe | Short term (≤ 2 years) |
| Low-skill labor and design gap | -0.6% | Emerging APAC, Latin America | Medium term (2-4 years) |
Opportunities
Circular, refillable, and smart-tracked bean bag models represent the market’s most monetizable untapped opportunity. Tightening environmental regulations and EPR schemes push furniture buyers toward refillable products rather than single-purchase replacements. Sustainable furniture products now achieve 10 to 20% price premiums, particularly in Europe and North America. Converting 15 to 25% of installed units into refill subscriptions could generate an additional USD 10 to USD 15 of recurring revenue per unit over a five-year lifecycle.
If circular models expand to 30 to 40 million active units globally by 2035, producing USD 5 to USD 8 in annual recurring revenue per unit, the result could be USD 150 to USD 320 million in additional annual revenue. This circular model translates into an estimated 0.9 percentage-point CAGR uplift beyond current forecasts. Brands that move first to commercialize refillable and smart-tracked formats will lock in customers before commodity players respond.
| Opportunity | (~) % Potential CAGR Upside | Geographic Relevance | Execution Window |
|---|---|---|---|
| Gaming & Esports Seating Ecosystems | +1.8% | North America, Europe, APAC emerging | Short–Medium term |
| Hybrid Work & Micro-Office Pods | +1.2% | North America core, EU, Urban APAC | Medium term |
| Health, Orthopedic & Neurodiverse Use Cases | +1.0% | North America, Europe, Japan | Medium–Long term |
| Hospitality, Student Housing & Co-Living Contracts | +1.5% | North America, EU, GCC, APAC metros | Short–Medium term |
| Circular, Refillable & Smart-Tracked Models | +0.9% | Europe, North America, Developed APAC | Medium–Long term |
| Kids, Teen & Gen Z Creator-Branded Lines | +1.3% | North America, Latin America, APAC urban | Short–Medium term |
Circular, refillable, and smart-tracked bean bag models represent the market’s most monetizable untapped opportunity. Tightening environmental regulations and EPR schemes push buyers toward refillable products rather than single-purchase replacements. Sustainable furniture achieves 10 to 20% price premiums in Europe and North America. Converting 15 to 25% of installed units into refill subscriptions could generate USD 10 to USD 15 of recurring revenue per unit over five years.
Key Company Insights
Lovesac holds a structural advantage in the premium bean bag and modular seating segment through its direct-to-consumer retail footprint and sustainability-focused U.S. manufacturing operations. The Bureau of Labor Statistics reports Americans spent an average of 5.3 hours per day on leisure and sports activities in 2024, a behavioral trend that directly feeds demand for Lovesac’s home comfort positioning. In December 2025, Lovesac reported progress in circular manufacturing operations, reinforcing its premium sustainability story against lower-cost competitors.
Lovesac holds a structural advantage in the premium segment through its direct-to-consumer retail model and U.S.-based sustainability-focused manufacturing. The Bureau of Labor Statistics reports Americans spent an average of 5.3 hours per day on leisure activities in 2024, feeding demand for home comfort seating. In December 2025, Lovesac reported progress in circular manufacturing, reinforcing its premium story against lower-cost import-dependent competitors.
Moon Pod competes directly in the premium segment through its proprietary high-density microbead seating technology. The EPA reports more than 9 million tons of furniture and furnishings were discarded annually in the United States, creating consumer appetite for durable, high-quality alternatives. In 2025, Moon Pod expanded media presence to reinforce its microbead technology positioning. This strategy builds brand equity that commodity EPS-fill competitors cannot replicate without significant product investment. In April 2026, Yogibo partnered with hair-care brand oggi otto on a Moon Pillow collaboration, signaling that cross-category lifestyle partnerships now define competitive differentiation at the premium end of the market.
Key Players
- Lovesac
- Fatboy USA
- Chill Sack
- CordaRoy’s
- Big Joe
- Ultimate Sack
- Moon Pod
- Yogibo
- Sofa Sack
- Sumo Lounge
- Jaxx Bean Bags
- Comfort Research
- Comfy Sacks
- Lumaland
- Ace Bayou Corporation
- Others
Recent Developments
- January 2025 – Yogibo launched the limited-edition Yogibo Medoūsa through the Makuake crowdfunding platform, introducing a statement-style bean bag design targeting lifestyle and interior décor consumers.
- July 2025 – Yogibo introduced the “Yogibo MEETS GAL” collection developed with Japanese influencers, targeting Gen Z consumers and the Y2K-inspired home décor segment.
- December 2025 – Yogibo launched its annual Lucky Bag campaign featuring bundled bean bag furniture products and promotional sales across retail and online channels.
- April 2026 – Yogibo introduced Sling Go, a new 2-way portable seating product designed to extend the brand’s flexible comfort furniture portfolio beyond traditional bean bag chairs.
Report Scope
| Report Features | Description |
|---|---|
| Market Value (2025) | USD 3.8 Billion |
| Forecast Revenue (2035) | USD 5.8 Billion |
| CAGR (2026-2035) | 4.2% |
| Base Year for Estimation | 2025 |
| Historic Period | 2020-2024 |
| Forecast Period | 2026-2035 |
| Report Coverage | Revenue Forecast, Market Dynamics, Market Opportunity Analysis, Technology and Innovation Landscape, Competitive Landscape, Recent Developments |
| Segments Covered | By Product Type (Fabric Bean Bags, Vinyl/Faux Leather Bean Bags, Velvet Bean Bags, Corduroy Bean Bags, Outdoor/Water-Resistant Bean Bags, Others), By Filling Material (EPS Beads, Shredded Foam, Memory Foam, Others), By Size (Small, Medium, Large, Extra Large), By Shape (Round/Pear Shaped, Chair Shaped, Oval/Lounger, Square/Bean Shaped, Others), By Age Group (Kids, Teens, Adults, Seniors), By Application (Residential, Commercial), By Price Range (Economy, Mid-Range, Premium, Luxury), By Distribution Channel (Online, Offline) |
| Regional Analysis | North America (US and Canada), Europe (Germany, France, The UK, Spain, Italy, and Rest of Europe), Asia Pacific (China, Japan, South Korea, India, Australia, and Rest of APAC), Latin America (Brazil, Mexico, and Rest of Latin America), Middle East and Africa (GCC, South Africa, and Rest of MEA) |
| Competitive Landscape | Lovesac, Fatboy USA, Chill Sack, CordaRoy’s, Big Joe, Ultimate Sack, Moon Pod, Yogibo, Sofa Sack, Sumo Lounge, Jaxx Bean Bags, Comfort Research, Comfy Sacks, Lumaland, Ace Bayou Corporation, Others |
| Customization Scope | Customization for segments, region/country-level will be provided. Additional customization can be done based on requirements. |
| Purchase Options | We have three licenses to opt for: Single User License, Multi-User License (Up to 5 Users), Corporate Use License (Unlimited User and Printable PDF) |





































