


Report Overview
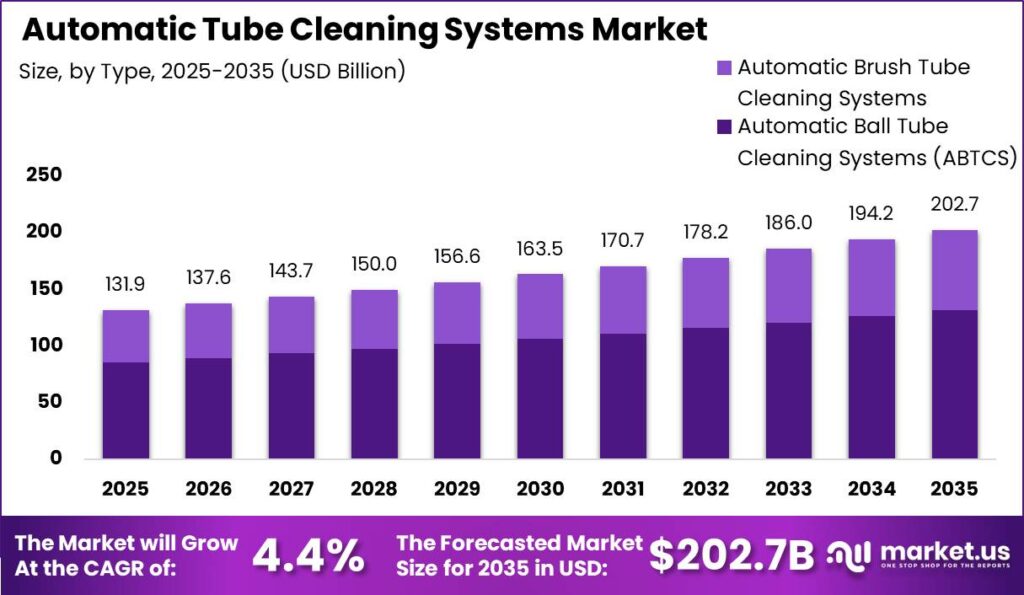
Global Automatic Tube Cleaning Systems (ATCS) Market size is expected to be worth around USD 202.7 Billion by 2035 from USD 131.9 Billion in 2025, growing at a CAGR of 4.4% during the forecast period 2026 to 2035. Steady replacement of shutdown-based cleaning with continuous online systems supports this expansion. Operators across power, HVAC, and process industries now treat fouling control as an efficiency mandate rather than a discretionary maintenance choice.
Automatic Tube Cleaning Systems keep condenser and heat exchanger tubes clean during live operation. These systems circulate sponge balls or driven brushes through tube bundles to remove scale and biofilm continuously. Therefore, plants maintain heat transfer performance without offline cleaning. The market structures around ball-based and brush-based product types, condenser and chiller applications, and end-use sectors spanning power generation, HVAC, oil and gas, marine, and food processing.
Key Takeaways
- Global ATCS market reaches USD 202.7 Billion by 2035, up from USD 131.9 Billion in 2025 at a CAGR of 4.4%.
- Automatic Ball Tube Cleaning Systems (ABTCS) lead the By Type segment with a 65.00% share.
- Condenser applications dominate the By Application segment with a 35.00% share.
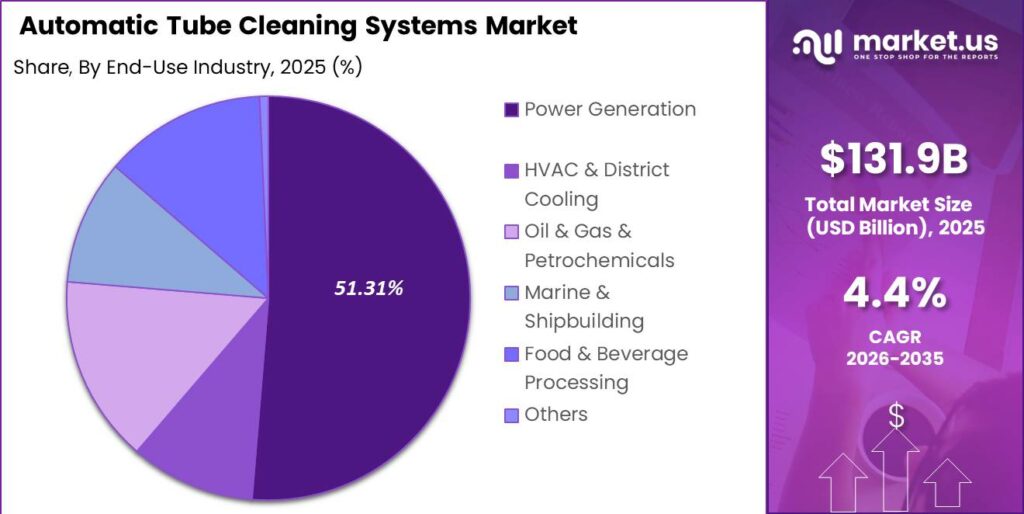
- Power Generation leads the By End-Use Industry segment with a 51.31% share.
- Direct Sales (OEM and Manufacturer Direct) leads the By Sales Channel segment with a 58.00% share.
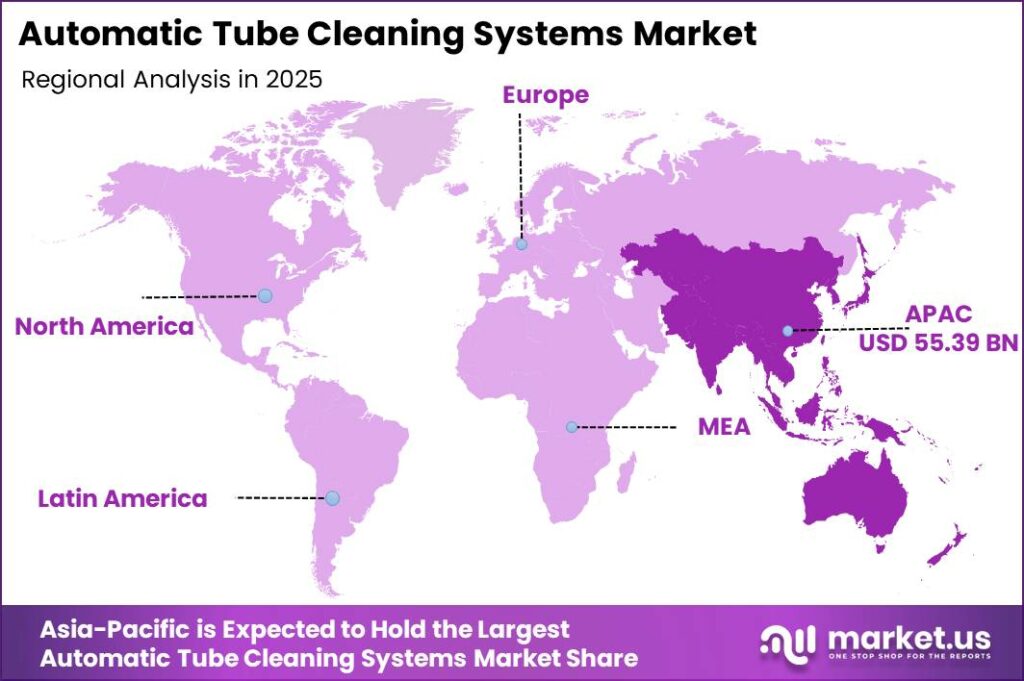
- Asia-Pacific dominates all regions with a 42.00% share, valued at USD 55.39 Billion.
Government energy rules now shape ATCS purchasing across major economies. Regulators tie condenser efficiency directly to plant emissions and compliance reporting. As a result, operators face pressure to prove measurable heat transfer performance. Continuous cleaning becomes the clearest lever to meet these targets. This creates a direct policy channel that pulls ATCS demand into compliance budgets rather than optional capital lines.
According to the U.S. Environmental Protection Agency, condenser efficiencies typically range from 50% to 95% depending on operating conditions and coolant temperature. This wide band shows how quickly fouling erodes performance. Consequently, plants that hold clean surfaces protect the top of that range and cut fuel waste. Trane found that a 1°C rise in condenser temperature raises chiller operating cost by roughly 2%. This means small fouling gains carry large annual cost penalties.
The U.S. Department of Energy OSTI indicates that automatic online tube cleaning maximizes condenser heat transfer, improves plant heat rate, and lowers greenhouse gas emissions. This links ATCS adoption to both operating savings and decarbonization goals. Therefore, vendors that quantify heat-rate gains win faster approvals from utility and industrial buyers focused on lifecycle cost.
By Type Analysis
Automatic Ball Tube Cleaning Systems dominates with 65.00% due to continuous sponge-ball recirculation reliability.
In 2025, Automatic Ball Tube Cleaning Systems held a dominant market position in the By Type segment of Automatic Tube Cleaning Systems (ATCS) Market, with a 65.00% share. According to the Electric Power Research Institute, tube deposits above 0.75 g/ft² classify tubes as dirty, which sponge-ball systems prevent during operation. This means ball-based designs protect heat transfer without shutdowns. Buyers therefore favor them for large condenser fleets running thousands of hours yearly.
Automatic Brush Tube Cleaning Systems serve tubes needing stronger mechanical abrasion for hardened scale. This type holds a 35.00% share of the By Type segment. Brush systems drive captured brushes through tubes on flow reversal cycles. The Hong Kong EMSD notes that automatic systems remove deposits continuously during chiller operation. As a result, brush units suit sites with heavy scaling water, giving vendors a defensible niche beyond ball-based fleets.
By End-Use Industry Analysis
Power Generation dominates with 51.31% due to large condenser fleets running continuously.
In 2025, Power Generation held a dominant market position in the By End-Use Industry segment of Automatic Tube Cleaning Systems (ATCS) Market, with a 51.31% share. According to the International Energy Agency, global electricity generation grew by over 1,200 TWh in 2024, a 4% annual rise. This growth adds condenser volume that must stay clean. Therefore, power operators anchor ATCS demand across thermal, nuclear, and gas fleets.
HVAC and District Cooling operators deploy ATCS to protect chiller efficiency in dense urban systems. The IEA-linked district cooling outlook reports Malaysia alone runs over 30 district cooling systems, while India could exceed 12,000,000 tons of refrigeration capacity long term. This scale creates a large maintenance base. Consequently, cooling operators adopt continuous cleaning to hold capacity during peak load without service interruptions.
Oil and Gas, Petrochemicals, Marine and Shipbuilding, and Food and Beverage Processing operators use ATCS on process condensers and seawater exchangers. These sectors face fouling from brackish and process fluids. The remaining end users, including Others, collectively hold the balance of the segment. This means vendors serving refining and marine buyers capture steady retrofit and new-build demand across corrosive-water applications.
By Sales Channel Analysis
Direct Sales dominates with 58.00% due to complex engineering and integration requirements.
In 2025, Direct Sales (OEM and Manufacturer Direct) held a dominant market position in the By Sales Channel segment of Automatic Tube Cleaning Systems (ATCS) Market, with a 58.00% share. ATCS installations require tube-specific engineering, so manufacturers sell directly to large plant operators. This means vendors control specification and commissioning quality. Direct control also builds long service relationships that lock in aftermarket and consumable revenue over multi-year contracts.
Distributors and System Integrators, alongside Others, handle the remaining share of the By Sales Channel segment. Integrators bundle ATCS into broader cooling and water treatment projects. The U.S. EIA reports data center servers reached 7% of commercial-sector electricity use in 2025, driving new cooling projects. As a result, integrators gain a channel role in fast-growing facility builds where ATCS ships inside larger system packages.
Key Market Segments
By Type
- Automatic Ball Tube Cleaning Systems (ABTCS)
- Automatic Brush Tube Cleaning Systems
By Application
- Condenser
- Chillers
- Boilers
- Cooling Towers
By End-Use Industry
- Power Generation
- HVAC & District Cooling
- Oil & Gas & Petrochemicals
- Marine & Shipbuilding
- Food & Beverage Processing
- Others
By Sales Channel
- Direct Sales (OEM & Manufacturer Direct)
- Distributors & System Integrators
- Others
Regional Analysis
Asia-Pacific Dominates the Automatic Tube Cleaning Systems (ATCS) Market with a Market Share of 42.00%, Valued at USD 55.39 Billion
Asia-Pacific leads the market with a 42.00% share worth USD 55.39 Billion. Rapid power capacity growth and dense cooling demand drive this lead. China stands as the largest district cooling market, while India shows the largest growth potential in the region. This means vendors that localize engineering and service capture the deepest installed base and the strongest new-build pipeline across Asia-Pacific.
Middle East and Africa emerges as a fast-expanding region through desalination and petrochemical cooling loads. Ovivo highlighted the commercial rollout of its integrated PFAS treatment portfolio in May 2025, strengthening industrial water offerings that complement condenser optimization. Gulf seawater condensers demand continuous cleaning against heavy biofouling. Therefore, ATCS vendors that pair mechanical cleaning with water treatment win larger scopes in this high-temperature market.
Europe, North America, and Latin America hold the remaining regional shares. Europe and North America carry large aging thermal and HVAC fleets needing retrofit cleaning. Latin America adds selective power and process demand. This creates a broad retrofit opportunity in mature markets where operators prioritize lifecycle savings over new equipment cost.
Key Regions and Countries
North America
- US
- Canada
Europe
- Germany
- France
- The UK
- Spain
- Italy
- Rest of Europe
Asia Pacific
- China
- Japan
- South Korea
- India
- Australia
- Rest of APAC
Latin America
- Brazil
- Mexico
- Rest of Latin America
Middle East and Africa
- GCC
- South Africa
- Rest of MEA
Drivers
Mandatory industrial energy efficiency rules now push ATCS from optional spending into compliance-linked operations. India’s Energy Conservation Amendment Act raises non-fossil consumption targets from 29.91% in FY2024 to 25 to 43.33% by FY2029 to 30, forcing operators to cut energy per unit of output. A fouling layer of just 0.0001 m²K/W can cut heat transfer by 10% to 25% and raise cooling energy use by 10% to 20%.
At a 100 MW plant running 8,000 hours yearly at $50 per MWh, that waste reaches $800,000 to $1,600,000 per condenser string. A continuous ATCS costing $80,000 to $250,000 pays back in 2 to 6 months. This means vendors now sell energy-savings-as-a-service, sharing verified gains and lowering the upfront barrier for smaller operators.
| Driver | (~) % Impact on CAGR Forecast | Geographic Relevance | Impact Timeline |
|---|---|---|---|
| Mandatory Industrial Energy Efficiency Regulations Driving Heat Exchanger Optimization | +1.7% | EU, India, GCC, United States, Malaysia, Japan | Short term (≤ 2 years) |
| GCC Desalination & Petrochemical Capacity Expansion Creating New ATCS Installations | +1.4% | Saudi Arabia, UAE, Qatar, Kuwait, Oman | Short term (≤ 2 years) |
| Global Power Generation Capacity Addition (Thermal, Nuclear, LNG) Increasing Condenser Volumes | +1.1% | Asia-Pacific, Middle East, Africa, South America | Medium term (2–4 years) |
| Water Scarcity & Industrial Water Reuse Mandates Increasing Cooling System Optimization Demand | +0.9% | Global, most acute in India, MENA, Southern Europe, Western United States | Short term (≤ 2 years) |
| Rising HVAC Commercial Real Estate & Data Centre Cooling Demand | +0.7% | North America, Europe, India, Southeast Asia, GCC | Medium term (2–4 years) |
| Growing Operator Awareness of Biofouling-Induced Heat Exchanger Efficiency Losses | +0.5% | Global, led by power utilities & refining sectors | Short term (≤ 2 years) |
Restraints
High capital cost limits ATCS adoption among small and emerging-market operators. A standard condenser with 500 to 2,000 tubes needs $80,000 to $350,000 in installed cost. Many SME operators instead pay $5,000 to $20,000 for periodic manual chemical cleaning. This gap makes ATCS look expensive against familiar low-cost contracts, slowing conversion in price-sensitive regions.
Emerging-market operators apply hurdle rates of 18% to 25%, so they reject payback periods of 18 to 36 months that Western utilities accept at 6% to 10%. Vendors win below 20% of SME proposals versus 55% to 70% at large accounts. Therefore, performance contracting is needed, though it requires $5 to $15 Million in financing capability per market.
| Restraint | (~) % Impact on CAGR Forecast | Geographic Relevance | Impact Timeline |
|---|---|---|---|
| High Capital Cost & Lengthy Payback Perception Among SME & Emerging Market Operators | -1.8% | India, Southeast Asia, Africa, Latin America, smaller industrial operators globally | Short term (≤ 2 years) |
| Entrenched Chemical Treatment & Manual Cleaning Incumbent Preference | -1.2% | Global, most persistent in price-sensitive industrial markets | Medium term (2–4 years) |
| Capital Expenditure Freeze in Thermal Power Sector Due to Energy Transition Uncertainty | -0.9% | Europe, United States, India, South Africa | Short term (≤ 2 years) |
| Limited Applicability to Non-Tubular (Plate & Fin) Heat Exchanger Architectures | -0.6% | Global — constrains addressable installed base in food & beverage, pharma sectors | Long term (≥ 4 years) |
| Currency Volatility & Import Duty Friction in Key Growth Markets | -0.5% | India, Brazil, GCC, Southeast Asia | Short term (≤ 2 years) |
Challenges
Biofouling resistance in warm-water systems remains the toughest operational challenge. Biofilm forms 3 to 6 times faster in seawater above 28 to 32°C, reaching thermal resistance of 0.00015 to 0.0003 m²K/W within 4 to 8 weeks. Standard sponge balls slow this but cannot fully stop it, so tropical operators face continuous performance loss.
Gulf condensers running at 32 to 38°C outpace ball cleaning by 1.5 to 2 times, forcing biocide dosing that adds $8,000 to $25,000 yearly per condenser. This weakens the chemical-free value claim. Hybrid solutions like UV-C and biocidal ball coatings add $15,000 to $50,000 per condenser. This creates a 4 to 7 year path before full tropical readiness arrives.
| Challenge | (~) % CAGR Friction Drag | Geographic Relevance | Mitigation Horizon |
|---|---|---|---|
| Biofouling Resistance in Warm Water Systems | -1.3% | GCC, Southeast Asia, India, tropical industrial sites globally | Long term (≥ 4 years) |
| Retrofit Complexity in Aging Heat Exchanger Stock | -1.1% | Global, most acute in aging thermal power fleets in North America, Europe, India | Medium term (2–4 years) |
| Skilled O&M Technician Shortage for System Upkeep | -0.7% | Africa, Southeast Asia, India, Latin America | Long term (≥ 4 years) |
| Sponge Ball Loss Rate & Consumable Reliability in High-Velocity Flow | -0.6% | Global, especially high-flow condenser applications in power plants | Medium term (2–4 years) |
| Standardization Gap Across Tube Diameters & Materials | -0.4% | Global, complicating multi-site enterprise procurement contracts | Long term (≥ 4 years) |
Opportunities
IoT-enabled smart ATCS with predictive fouling analytics offers the highest upside. Fewer than 5% to 10% of installed systems use real-time monitoring as of 2026, so most run fixed timers and capture only 70% to 80% of possible performance. Condition-based cleaning triggered when the U-value falls below 70% of clean value recovers an extra 8% to 15% of thermal efficiency.
That gain equals $50,000 to $200,000 in yearly savings per large condenser. A smart retrofit priced at $20,000 to $60,000 generates $3,000 to $8,000 in annual subscription revenue at 70% to 80% gross margin, against 30% to 45% hardware margin. This shifts vendor economics toward recurring software income and higher valuation multiples.
| Opportunity | (~) % Potential CAGR Upside | Geographic Relevance | Execution Window |
|---|---|---|---|
| IoT-Enabled Smart ATCS with Predictive Fouling Analytics & Remote Monitoring | +1.9% | Global, led by North America, Europe, GCC, India | Medium term (2–4 years) |
| Data Centre Cooling Infrastructure ATCS Penetration (Hyperscale & Edge) | +1.5% | United States, Europe, India, Southeast Asia, GCC | Medium term (2–4 years) |
| Performance Contracting & Energy-Savings-as-a-Service Monetization Models | +1.1% | India, Southeast Asia, Africa, Latin America (price-sensitive growth markets) | Medium term (2–4 years) |
| Nuclear & LNG Liquefaction Plant New-Build ATCS Standardization | +0.8% | France, UK, UAE, South Korea, United States, China | Long term (≥ 4 years) |
| Aftermarket Retrofit Opportunity in Aging Thermal Power Fleet Pre-Retirement Window | +0.6% | India, United States, Germany, Poland, South Africa | Short term (≤ 2 years) |
Key Company Insights
TAPROGGE GmbH anchors its position through sponge-ball recirculation technology built for continuous condenser cleaning. The Hong Kong EMSD notes that such systems remove deposits during operation, which supports TAPROGGE’s chemical-free positioning. This creates a durable advantage in power and HVAC fleets that value uptime. However, warm-water biofouling still pressures pure ball-based systems, leaving room for hybrid challengers to compete on tropical performance.
BEAUDREY S.A.S. strengthens its role through condenser protection and tube cleaning systems for large utility applications. The EPRI standard classifying deposits above 0.75 g/ft² as dirty tubes underlines the value BEAUDREY delivers by preventing that buildup. This aligns the company with utilities focused on heat-rate protection. Its utility-centric focus builds deep account trust, yet limits reach into smaller price-sensitive industrial buyers.
Key Players
- TAPROGGE GmbH
- BEAUDREY S.A.S.
- HydroBall Technics Holdings Pte Ltd.
- Conco Services LLC
- WesTech Engineering LLC
- WSA Engineered Systems
- Ovivo Inc.
- Innovas Technologies LLC
- Balltech Energy Ltd.
- KLUMP & KOLLER GmbH
- CET Enviro Pvt. Ltd.
- Nijhuis Saur Industries
- Tube Tech International Ltd.
- Changzhou Peide Water Treatment Equipment Co., Ltd.
- ASIA PROTECH CO., LTD.
Recent Developments
- October 2025: Innovas Technologies received a new retrofit order from the University of Virginia to expand its Helios Tube Cleaning System at the South Chiller Plant, after the existing installation delivered 4% to 8% higher efficiency over more than 3,000 operating hours.
- June 2025: Innovas Technologies commissioned its Helios Tube Cleaning System at Sub-Zero Group’s new 400,000 square foot manufacturing facility in Iowa to optimize chiller efficiency and reduce maintenance downtime.
- February 2024: Ovivo completed the acquisition of E2metrix to strengthen its PFAS treatment portfolio and accelerate commercialization of integrated PFAS destruction solutions.
Report Scope
| Report Features | Description |
|---|---|
| Market Value (2025) | USD 131.9 Billion |
| Forecast Revenue (2035) | USD 202.7 Billion |
| CAGR (2026-2035) | 4.4% |
| Base Year for Estimation | 2025 |
| Historic Period | 2020-2024 |
| Forecast Period | 2026-2035 |
| Report Coverage | Revenue Forecast, Market Dynamics, Market Opportunity Analysis, Technology and Innovation Landscape, Competitive Landscape, Recent Developments |
| Segments Covered | By Type (Automatic Ball Tube Cleaning Systems (ABTCS), Automatic Brush Tube Cleaning Systems), By Application (Condenser, Chillers, Boilers, Cooling Towers), By End-Use Industry (Power Generation, HVAC & District Cooling, Oil & Gas & Petrochemicals, Marine & Shipbuilding, Food & Beverage Processing, Others), By Sales Channel (Direct Sales (OEM & Manufacturer Direct), Distributors & System Integrators, Others) |
| Regional Analysis | North America (US and Canada), Europe (Germany, France, The UK, Spain, Italy, and Rest of Europe), Asia Pacific (China, Japan, South Korea, India, Australia, and Rest of APAC), Latin America (Brazil, Mexico, and Rest of Latin America), Middle East and Africa (GCC, South Africa, and Rest of MEA) |
| Competitive Landscape | TAPROGGE GmbH, BEAUDREY S.A.S., HydroBall Technics Holdings Pte Ltd., Conco Services LLC, WesTech Engineering LLC, WSA Engineered Systems, Ovivo Inc., Innovas Technologies LLC, Balltech Energy Ltd., KLUMP & KOLLER GmbH, CET Enviro Pvt. Ltd., Nijhuis Saur Industries, Tube Tech International Ltd., Changzhou Peide Water Treatment Equipment Co., Ltd., ASIA PROTECH CO., LTD. |
| Customization Scope | Customization for segments, region / country-level will be provided. Additional customization can be done based on requirements. |
| Purchase Options | We have three licenses to opt for: Single User License | Multi-User License (Up to 5 Users) | Corporate Use License (Unlimited User and Printable PDF) |





































