
Quick Navigation
Report Overview
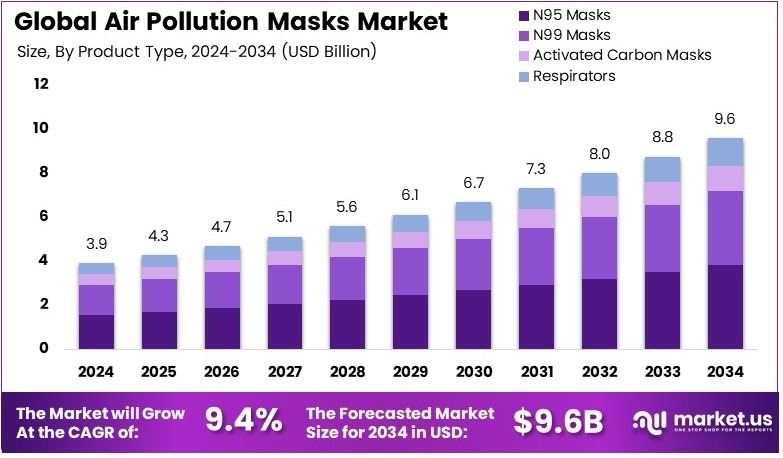
The Global Air Pollution Masks Market size is expected to be worth around USD 9.6 Billion by 2034, from USD 3.9 Billion in 2024, growing at a CAGR of 9.4% during the forecast period from 2025 to 2034.
Air pollution masks are protective coverings worn over the nose and mouth to filter out pollutants from the air, helping to decrease the inhalation of harmful particles and gases commonly found in urban environments.
The air pollution masks market refers to the industry and economic segment involved in the production, distribution, and sale of masks designed to protect individuals from air pollution. This market caters to consumer health needs worldwide.
According to recent studies and health advisories, the demand for air pollution masks is increasing significantly in response to the ongoing air quality and smog issues in urban areas like Delhi. For instance, during periods when the Air Quality Index (AQI) exceeds 400, indicating severe pollution, authorities recommend or mandate the use of N95 masks.
Furthermore, the heightened awareness of health risks associated with air pollution has led to a surge in mask usage, supported by government initiatives to improve public health.
Moreover, the air pollution masks market is also influenced by competitive dynamics and the saturation level of the market. Manufacturers are continually innovating to meet the demands for more effective and comfortable masks, highlighting the opportunity for growth in this sector.
Consequently, with 42.6% of the Indian population living in areas exceeding national air quality standards, there is a significant push towards adopting protective measures on a local scale.
In addition, the broader impact of air pollution in India cannot be overstated. In 2022, the average PM2.5 concentration was recorded at 41.4 µg/m³, a decrease from 51.3 µg/m³ in 2021 but still far above the WHO’s guideline of 5 µg/m³.
This scenario has serious health implications, as evidenced by a study published in The Lancet Planetary Health in December 2024, which attributed approximately 1.5 million premature deaths annually in India to air pollution. Therefore, the continuous need for effective air pollution masks is both a public health imperative and a market growth driver, illustrating the critical role these products play in contemporary health strategies.
Key Takeaways
- Air Pollution Masks Market was valued at USD 3.9 Billion in 2024 and is projected to reach USD 9.6 Billion by 2034 with a CAGR of 9.4%.
- In 2024, N95 Masks dominate the product segment with 45.5%, reflecting high consumer preference for superior filtration performance.
- In 2024, Disposable Masks lead the usage segment with 57.7%, driven by convenience and widespread single-use applications globally.
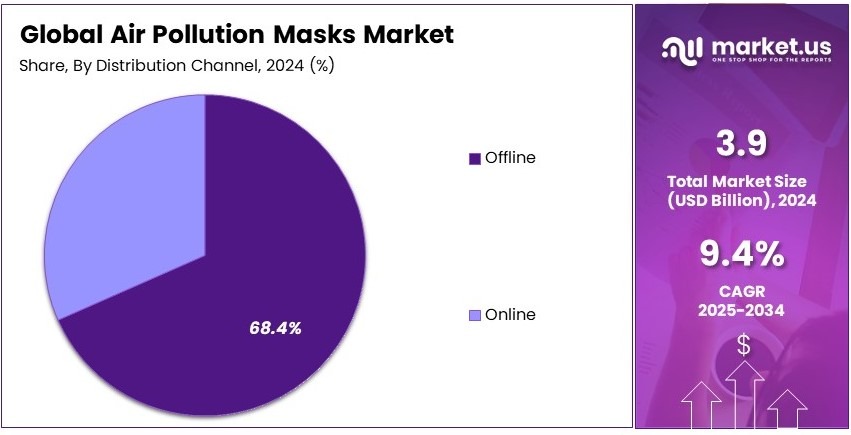
- In 2024, Offline channels dominate distribution with 68.4%, underlining robust traditional retail networks across various regions.
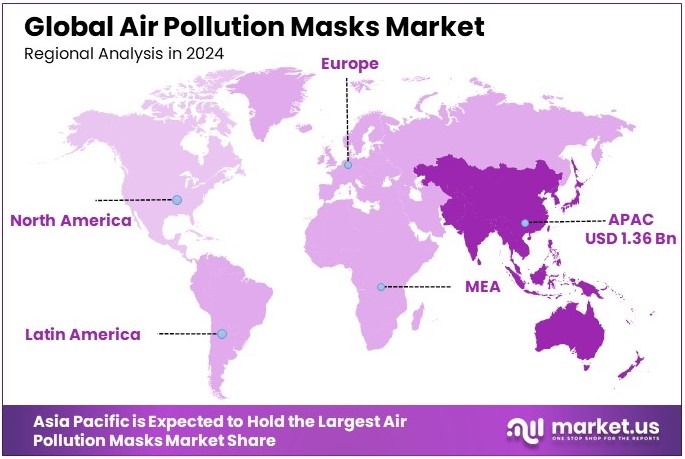
- In 2024, the APAC region leads with 34.9% market share, contributing approximately USD 1.36 Billion in revenues.
Product Type Analysis
N95 Masks dominate with 45.5% due to their widespread use in high-risk environments.
The product type segment of the air pollution masks market is diverse, comprising N95 masks, N99 masks, activated carbon masks, respirators, and other categories. N95 masks, with a dominant market share of 45.5%, have been at the forefront of air pollution protection due to their high filtration efficiency. This sub-segment is widely adopted by healthcare workers, industrial workers, and individuals in areas with severe air pollution.
The rising awareness of air quality and respiratory health concerns, particularly in regions such as Asia-Pacific and North America, has significantly boosted the demand for N95 masks. In addition, the ongoing COVID-19 pandemic further cemented their popularity due to their proven efficacy in blocking airborne particles.
N99 masks, though similar to N95, provide a higher level of filtration. However, their market share remains lower than N95 masks, making them a secondary choice for air pollution protection. Activated carbon masks, which contain a layer of carbon for filtering gases and odors, cater to individuals in areas affected by pollutants like vehicle exhaust and industrial fumes. They occupy a niche market where odor elimination is a priority.
Respirators, used primarily in industrial and construction settings, are specialized masks designed for long-term wear in environments with hazardous airborne particles. The “Others” category captures smaller sub-segments, such as face masks with additional features, but these do not yet contribute significantly to the overall market.
Usage Analysis
Disposable Mask dominates with 57.7% due to convenience and affordability.
The usage segment for disposable masks holds a major market share of 57.7%. Disposable masks are primarily favored for their convenience and lower cost. They are designed for one-time use, offering a practical solution for users who need protection without the hassle of cleaning or maintaining a reusable mask.
In countries with high pollution rates, disposable masks provide a quick and cost-effective solution, encouraging their widespread use. Furthermore, during the COVID-19 pandemic, disposable masks gained a significant market boost as they became a widely adopted protective measure.
However, reusable masks, although they represent a smaller portion of the market, are growing steadily. These masks are more eco-friendly, durable, and often designed with advanced filtration technology.
Reusable masks appeal to environmentally conscious consumers and those seeking long-term value. Despite their benefits, the higher initial cost and maintenance involved in cleaning them might limit their broader adoption compared to disposable options.
Distribution Channel Analysis
Offline dominates with 68.4% due to established retail infrastructure.
Offline distribution channels dominate the air pollution masks market with a substantial share of 68.4%. This is primarily due to the established retail infrastructure and consumer preferences for purchasing products in physical stores. In many regions, especially in emerging markets, consumers often prefer to see and try products before purchasing them.
Offline channels provide a sense of assurance regarding the product’s quality and fit, which is crucial for a product like air pollution masks, where comfort and effectiveness are key concerns. Additionally, offline channels, including supermarkets, pharmacies, and specialty stores, offer a wide reach, making masks easily accessible to consumers.
In contrast, online distribution channels have been growing, though they hold a smaller share of the market. The increase in e-commerce has made online shopping a convenient option for consumers seeking a variety of air pollution masks.
While online channels benefit from greater convenience and often offer competitive pricing, the lack of physical examination and trust issues in some regions might hinder their adoption. Despite this, the online market continues to expand as consumers become more comfortable with e-commerce and the convenience it offers.
Key Market Segments
By Product Type
- N95 Masks
- N99 Masks
- Activated Carbon Masks
- Respirators
- Others
By Usage
- Disposable Mask
- Reusable Mask
By Distribution Channel
- Offline
- Online
Driving Factors
Increased Public Awareness Drives Market Growth
As awareness of air pollution and its health risks increases, the demand for air pollution masks is also rising. With urban air quality deteriorating and the harmful effects of pollutants on respiratory health becoming more evident, consumers are becoming more proactive in protecting themselves.
This growing concern has driven the need for personal protective equipment, especially in cities where pollution levels are higher. Additionally, advancements in filtration technology have enhanced the effectiveness of these masks, making them more reliable at preventing the inhalation of harmful particles.
The combination of growing awareness and improved technology contributes significantly to the growth of the market, as consumers seek better protection for their health. Governments are also taking action by promoting air quality improvement initiatives, which further accelerates the demand for pollution masks in many regions.
Restraining Factors
High Costs and Limited Adoption Restrain Market Growth
Despite the increasing demand for air pollution masks, certain factors limit the market’s expansion. The production costs of masks with advanced filtration materials remain high, which can make them expensive for consumers.
Furthermore, the comfort and wearability of these masks can be an issue, leading to limited adoption. Many users find them uncomfortable for prolonged use, which hinders regular use, especially in daily commuting.
The availability of alternative air filtration technologies, such as air purifiers, offers additional competition, further impacting the demand for wearable pollution masks. Moreover, the lack of standardization in mask certifications creates confusion and can undermine consumer confidence in the effectiveness of certain products.
Growth Opportunities
Smart Technology and Eco-friendly Materials Provide Opportunities
Opportunities for growth in the air pollution mask market are abundant, especially with the rise of technological and environmental advancements. The development of smart masks, which incorporate sensors to monitor air quality in real time, presents an exciting avenue for market players to explore.
This technology allows users to stay informed about pollution levels and adjust mask usage accordingly. Additionally, emerging markets, especially in regions with rising pollution levels, present an opportunity for expansion, as consumers become more aware of the need for protective masks.
Customization of masks for specific industries, such as construction and healthcare, allows companies to cater to niche markets with tailored solutions. The inclusion of eco-friendly and biodegradable materials in mask production aligns with the growing global shift toward sustainability, creating a further avenue for innovation and market growth.
Emerging Trends
Fashion and Health Consciousness Are Latest Trending Factors
In recent years, the demand for fashionable and stylish pollution masks has increased. Consumers are no longer just focused on functionality; they also seek masks that fit their personal style.
This trend opens up new opportunities for mask manufacturers to introduce more aesthetically appealing designs while still providing the protection needed against air pollution. Moreover, integrating anti-viral and anti-bacterial coatings into air pollution masks is gaining traction, especially in light of the recent global health concerns.
These added features make the masks even more appealing to health-conscious consumers. As more technology companies collaborate with mask manufacturers, the integration of advanced features and enhanced user experience is becoming a key differentiator in the market.
With growing health awareness, consumers are increasingly looking for non-toxic, safe materials in the products they use, further fueling demand for high-quality, innovative masks.
Regional Analysis
Asia Pacific Dominates with 34.9% Market Share in the Air Pollution Masks Market
Asia Pacific (APAC) holds a significant 34.9% share of the global air pollution masks market, valued at USD 1.36 billion. This dominance can be attributed to rapid industrialization, high levels of urbanization, and severe air pollution in key countries such as China and India. APAC’s large population, along with rising awareness of health risks from air pollution, fuels the demand for air pollution masks in the region.
The primary drivers behind APAC’s strong market presence include the region’s high pollution levels, particularly in metropolitan cities. Countries like China and India, which suffer from severe smog and particulate matter, see widespread adoption of air pollution masks. Additionally, increased health-consciousness among consumers and government efforts to combat air pollution further boost mask sales.
Urbanization and industrial growth are contributing to greater pollution levels, which has led to a rise in respiratory diseases, thus increasing the demand for protective masks. The availability of affordable and diverse air pollution masks has made them accessible to a large population. Furthermore, the rise of online shopping platforms has made purchasing masks more convenient for consumers across the region.
Regional Mentions:
- North America: North America holds a substantial market share in the air pollution masks market due to stringent air quality regulations and increasing consumer awareness. Demand for high-quality masks, especially during wildfire seasons and pollution spikes, is contributing to growth in the region.
- Europe: Europe benefits from strict environmental policies and a growing focus on sustainability, with a rise in consumer demand for masks due to concerns about air quality in urban areas. Countries like the UK and France are seeing an increase in protective mask sales.
- Middle East & Africa: In the Middle East and Africa, rapid urbanization and desert dust storms drive the need for air pollution masks. Governments and industries are investing in air quality management systems, which contributes to the increasing market for protective masks in this region.
- Latin America: Latin America’s demand for air pollution masks is rising due to growing pollution levels in major cities like São Paulo and Mexico City. As awareness of air pollution’s health risks spreads, consumers are increasingly seeking masks to protect themselves from outdoor and indoor pollution.
Key Regions and Countries Covered in the Report
- North America
- US
- Canada
- Europe
- Germany
- France
- The UK
- Spain
- Italy
- Rest of Europe
- Asia Pacific
- China
- Japan
- South Korea
- India
- Australia
- Rest of APAC
- Latin America
- Brazil
- Mexico
- Rest of Latin America
- Middle East & Africa
- South Africa
- Saudi Arabia
- UAE
- Rest of MEA
Competitive Landscape
The air pollution masks market is highly competitive, with several prominent players driving innovation and expanding their market share. Among the top companies in this space, 3M, Honeywell International Inc., KCWW (Kimberly-Clark Worldwide, Inc.), and Totobobo Pte. Ltd. stand out due to their extensive product portfolios and technological advancements.
3M is a global leader in the air pollution masks market. Known for its advanced filtration technologies, 3M offers a wide range of personal protective equipment (PPE) products, including N95 and particulate respirators. The company’s strong brand reputation and research-driven innovation have enabled it to dominate this market, particularly in healthcare and industrial applications. 3M’s commitment to developing high-performance air masks is a key factor in its sustained growth.
Honeywell International Inc. also holds a significant share in the market, leveraging its expertise in industrial safety and environmental solutions. Honeywell’s air pollution masks are renowned for their durability and superior filtration capabilities. The company’s strong global presence, along with strategic partnerships with government agencies and businesses, has cemented its position as a leader in the air pollution masks sector.
KCWW (Kimberly-Clark Worldwide, Inc.), another major player, brings a reputation for producing high-quality consumer products. The company’s face masks, such as those under the Halyard brand, are widely used in both healthcare and consumer markets. With a focus on comfort, ease of use, and effectiveness, KCWW continues to innovate and meet the growing demand for protection against air pollutants.
Totobobo Pte. Ltd. is a key player known for its innovative mask designs. The company specializes in customizable and eco-friendly masks, using advanced filtration technologies that are adaptable to various environments. Totobobo’s focus on sustainability and user-friendly features has contributed to its growing popularity, particularly in urban areas with high pollution levels.
These companies, through their diverse product offerings and continuous technological advancements, continue to shape the future of the air pollution masks market. Their ability to cater to both industrial and consumer needs ensures their dominance in this rapidly evolving market.
Major Companies in the Market
- 3M
- Honeywell International Inc.
- KCWW (Kimberly-Clark Worldwide, Inc.)
- Totobobo Pte. Ltd.
- MSA (Mine Safety Appliances)
- RESPRO
- Ohlone Press LLC
- idMASK Co., Ltd.
- NIRVANA BEING
- Reckitt Benckiser Group plc
Recent Developments
- Honeywell International Inc.: On November 2024, Honeywell International Inc. announced its intention to sell its personal protective equipment (PPE) business to Protective Industrial Products for approximately $1.33 billion in cash. This strategic move is expected to conclude in the first half of 2025, with Honeywell retaining its gas detection portfolio.
- Molekule: On February 2024, air purification company Molekule successfully completed its Chapter 11 bankruptcy process. The company continues its operations, focusing on delivering advanced air purification solutions.
Report Scope
| Report Features | Description |
|---|---|
| Market Value (2024) | USD 3.9 Billion |
| Forecast Revenue (2034) | USD 9.6 Billion |
| CAGR (2025-2034) | 9.4% |
| Base Year for Estimation | 2024 |
| Historic Period | 2020-2023 |
| Forecast Period | 2025-2034 |
| Report Coverage | Revenue Forecast, Market Dynamics, Competitive Landscape, Recent Developments |
| Segments Covered | By Product Type (N95 Masks, N99 Masks, Activated Carbon Masks, Respirators, Others), By Usage (Disposable Mask, Reusable Mask), By Distribution Channel (Offline, Online) |
| Regional Analysis | North America – US, Canada; Europe – Germany, France, The UK, Spain, Italy, Rest of Europe; Asia Pacific – China, Japan, South Korea, India, Australia, Singapore, Rest of APAC; Latin America – Brazil, Mexico, Rest of Latin America; Middle East & Africa – South Africa, Saudi Arabia, UAE, Rest of MEA |
| Competitive Landscape | 3M, Honeywell International Inc., KCWW (Kimberly-Clark Worldwide, Inc.), Totobobo Pte. Ltd., MSA (Mine Safety Appliances), RESPRO, Ohlone Press LLC, idMASK Co., Ltd., NIRVANA BEING, Reckitt Benckiser Group plc |
| Customization Scope | Customization for segments, region/country-level will be provided. Moreover, additional customization can be done based on the requirements. |
| Purchase Options | We have three licenses to opt for: Single User License, Multi-User License (Up to 5 Users), Corporate Use License (Unlimited User and Printable PDF) |


