


Report Overview
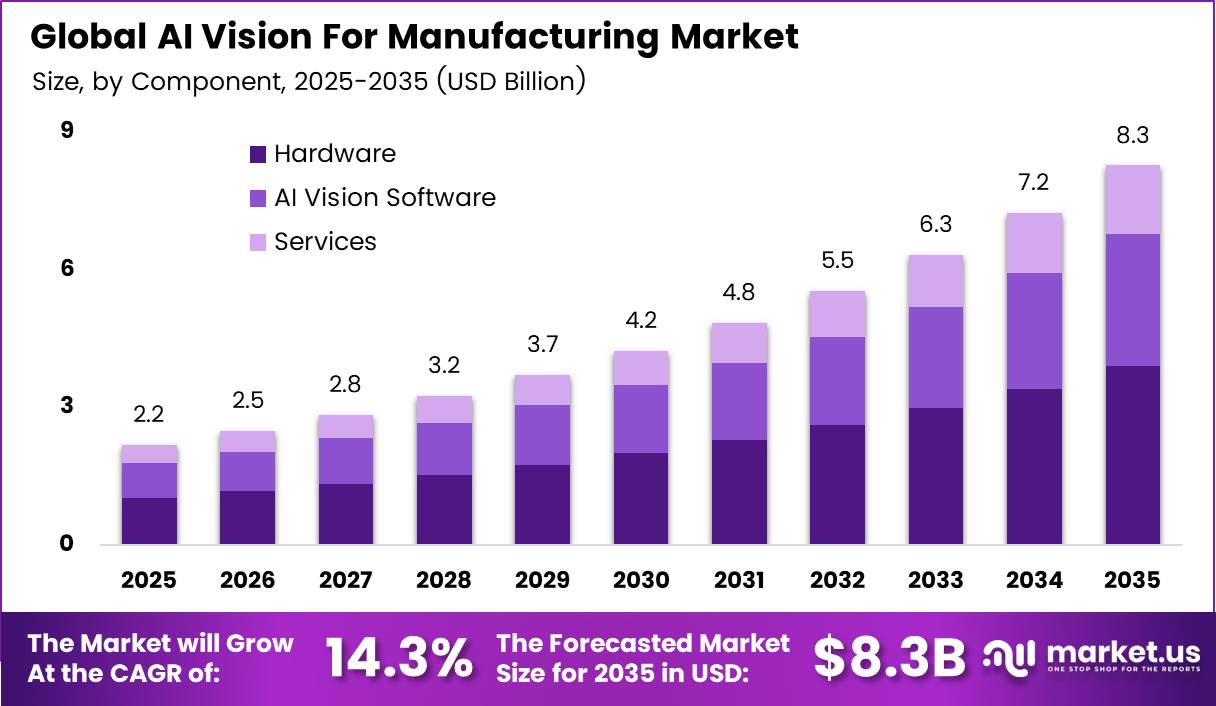
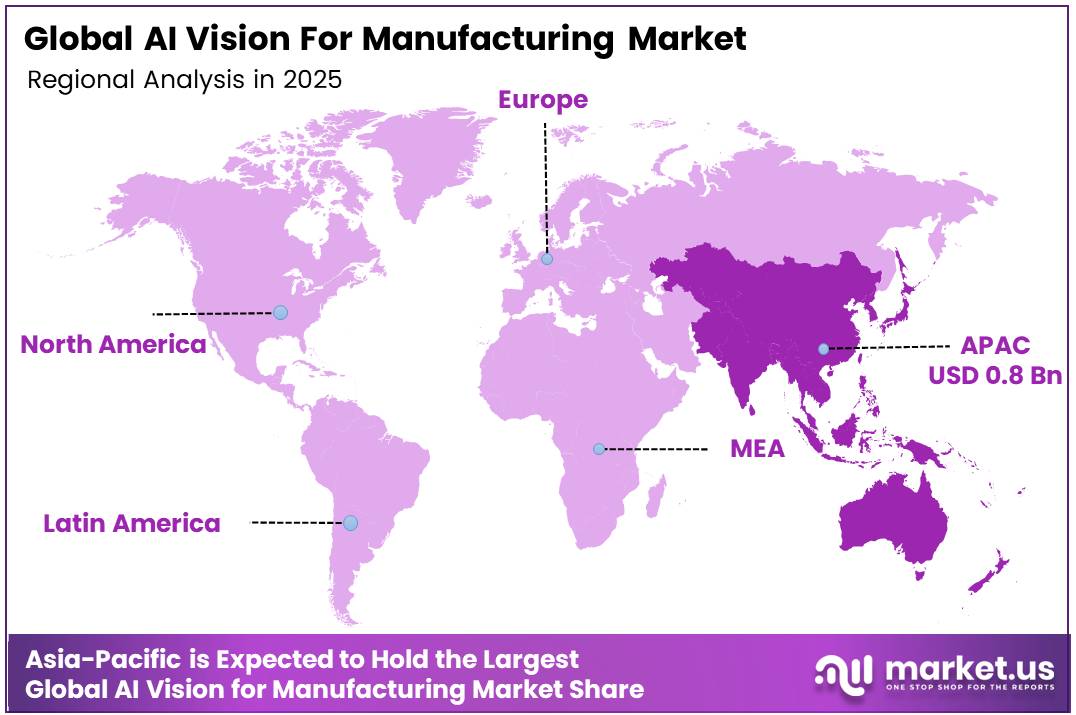
In 2025, the Global AI Vision for Manufacturing Market was valued at USD 2.2 billion. The market is projected to grow at a CAGR of 14.3% during 2026–2035, reaching approximately USD 8.3 billion by 2035. Asia-Pacific dominated the global market in 2025, accounting for more than 34.2% of the total market share and generating approximately USD 0.8 billion in revenue.
Factory automation is the main driver. Factories installed 603,000 industrial robots in 2025, up 11%, and the global operating robot stock hit a record 5 million units. Installations should rise 9% to 655,000 units in 2026 and reach 806,000 units in 2029.
Each new robot cell needs cameras and AI software to guide picks, check parts, and track output. The wider served machine vision market stands near USD 7 billion, with through-cycle growth of 10% to 11%. That steady robot growth turns directly into demand for AI vision systems on the line.
The Asia-Pacific region runs the world’s biggest factory base. Asia took 74% of all new robot deployments in 2024, while Europe took 16% and the Americas took 9%. China alone installed 295,045 units in 2024 and passed 2 million robots in operation.
Its electrical and electronics sector led demand with 83,000 units, followed by automotive with 57,200 units. These two sectors use the most vision inspection and guidance, which makes Asia-Pacific the natural center of demand.
Key Takeaways
- The Global AI Vision for Manufacturing Market was valued at USD 2.2 billion in 2025 and will reach USD 8.3 billion by 2035. grow at a CAGR of 14.3% from 2026 to 2035.
- By component, Hardware leads with a 47.5% share.
- By vision type, 2D Machine Vision leads with a 72.5% share.
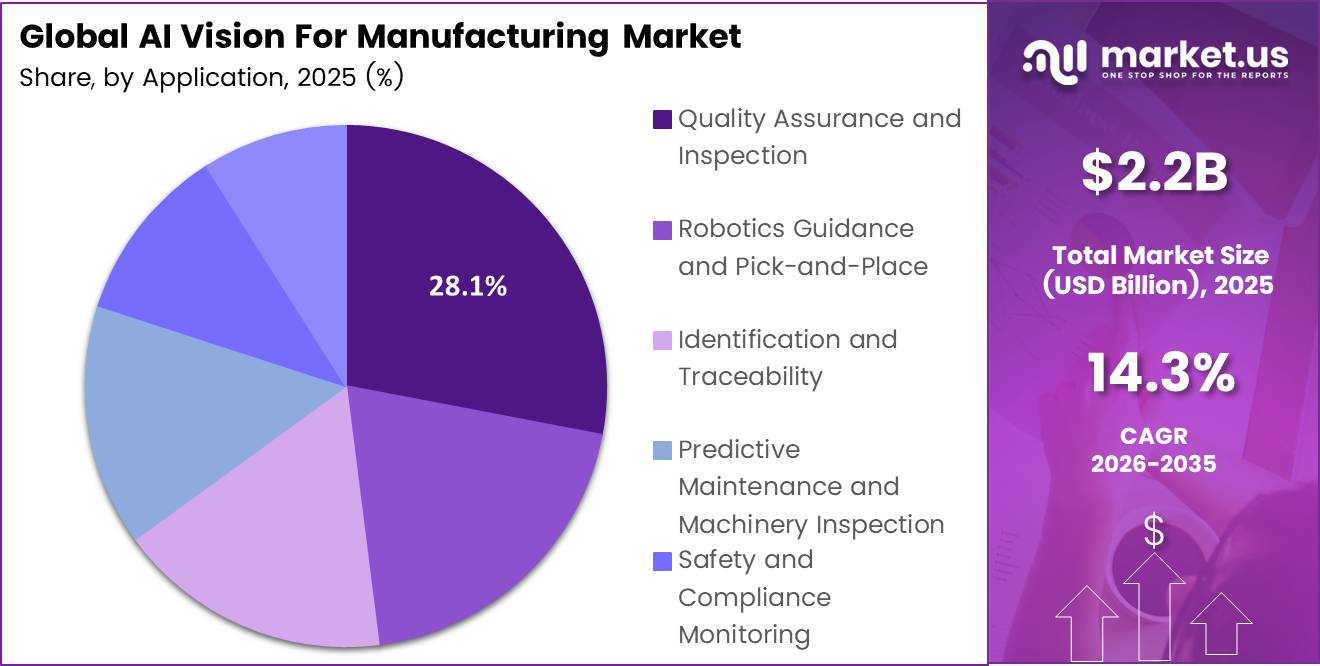
- By application, Quality Assurance and Inspection leads with a 28.1% share.
- By end-user industry, Electronics and Semiconductor Manufacturing leads with a 28.7% share.
- Asia-Pacific leads the market with a 34.2% share and USD 0.8 billion in revenue.
By Component
Hardware dominates with 47.5% due to costly cameras, sensors, and processors.
Hardware leads because every vision system needs physical parts before any software can run. Cameras, lighting, image sensors, and edge processors make up the biggest share of each system’s cost. That spending ties directly to the chip industry, which sold $791.7 billion worth of image sensors worldwide in 2025.
Chip demand keeps rising, which supports a steady flow of hardware to factory floors. Global semiconductor sales grew 25.6% over the 2024 total of $630.5 billion. Factory buyers gain from this larger supply base, since more sensor and processor choices reach them each year.
AI Vision Software is the fastest-growing part because factories now want more value from the hardware they already own. Logic chips, which run AI models, grew 39.9% to $301.9 billion and became the largest chip product category. This much compute power lets software makers ship deep-learning tools for defect detection that improve through simple updates.
By Vision Type
2D Machine Vision dominates with 72.5% due to low cost and proven setup.
2D systems hold the top spot because they solve most everyday factory tasks at a fair price. Barcode reading, label checks, surface flaws, and part presence checks all work well with flat images. Engineers trust 2D tools because plants have used them for decades, and setup takes less time and training.
The installed base of automation keeps 2D demand stable. The global stock of industrial robots in operation rose 9% to a record 5 million units in 2025. Many of these lines rely on basic 2D cameras for simple position and quality checks.
3D Machine Vision is growing fastest because modern robots must see depth, shape, and volume. Factories installed more than 600,000 new robots in 2025, an 11% jump in annual installations. Each new robot that grips mixed or loose parts needs 3D data to find exact pick points. Falling prices for structured-light and time-of-flight sensors also help small and mid-sized plants adopt 3D tools.
By Application
Quality Assurance and Inspection dominate with 28.1% due to zero-defect demands from strict buyers.
Inspection leads because one missed defect can trigger costly recalls, scrap, and lost contracts. Vision systems check every part at full line speed, which human inspectors cannot match across long shifts. Buyers in high-volume industries now demand recorded proof of quality, and camera-based inspection creates that record automatically.
Large production hubs drive steady inspection spending. China installed 354,000 industrial robots in 2025, which equals 59% of all new installations worldwide. Each new automated cell adds checkpoints where cameras confirm the output before parts move downstream.
By End-User Industry
Electronics and Semiconductor Manufacturing dominates with 28.7% due to micron-level precision on tiny components.
Electronics makers lead because their products leave almost no room for error. Chip makers and board assemblers use vision to check solder joints, wafer flaws, and part alignment at very small scales. Human eyes cannot do this work reliably, so cameras become a basic need rather than an option.
This sector also leads automation spending in the largest factory market. China’s electrical and electronics industry installed 96,400 robots in 2025, up 16% and holding a 27% share as the top customer group. Each automated line brings new vision checkpoints with it.
Automotive and Electric Vehicles is the fastest-growing end-user because EV production adds new inspection tasks. China’s automotive industry installed a record 78,900 robots, up 38%. Global electric car sales topped 20 million in 2025, and EVs now make up 25% of new car sales. Battery cells, electrode coatings, and weld seams all need close visual checks to prevent fire and safety risks.
Key Market Segments
By Component
- Hardware
- AI Vision Software
- Services
By Vision Type
- 2D Machine Vision
- 3D Machine Vision
By Application
- Quality Assurance and Inspection
- Robotics Guidance and Pick-and-Place
- Identification and Traceability
- Predictive Maintenance and Machinery Inspection
- Safety and Compliance Monitoring
- Others
By End-User Industry
- Electronics and Semiconductor Manufacturing
- Automotive and Electric Vehicles
- Pharmaceuticals and Healthcare
- Food and Beverage
- Metals and Machinery
- Aerospace and Defense
- Other
Geopolitical Impact Analysis
US trade policy now adds direct costs to vision hardware. On January 15, 2026, the US placed a 25% Section 232 duty on certain advanced chips and derivative products. For derivative goods, the duty applies to the full customs value of the finished product. A later US and EU deal caps these rates on EU semiconductors at 15%, which helps European camera makers.
Raw material controls hit sensors and optics. China restricted exports of at least 16 key minerals by May 2025. Gallium and germanium feed image sensors, infrared lenses, and laser parts. Gallium prices in Europe rose 365%, while germanium prices rose 400% as wrought germanium exports fell 60%. Rotterdam gallium reached USD 687 per kg in May 2025.
Rare earth controls raise motion system costs. European dysprosium and terbium prices reached 6 times Chinese domestic levels at peak disruption. These metals go into the magnets that drive robot arms, gimbals, and motorized lenses. Buyers now plan for lead times of 60 to 120 days on heavy rare earth magnets.
Shipping risk slows delivery. Ships that once crossed the Red Sea in days now sail for weeks around the Cape of Good Hope. The average voyage haul grew from 4,831 miles in 2018 to 5,245 miles in 2024. In 2024, seaborne volumes rose 2.2%, but ton-miles rose 5.9%. Asian cameras and lenses bound for Europe now reach buyers later and cost more to ship.
Regional Analysis
Asia-Pacific dominates the AI Vision for Manufacturing Market, holding a 34.2% share and generating USD 0.8 billion in revenue. The region builds most of the world’s electronics, batteries, and cars. Each of these lines needs fast camera checks at every step. Asia installed 457,315 robots in 2025, up 14% from the year before.
China drives this growth. It installed 354,000 robots in 2025, up 20%, and took 59% of global demand. Chinese robot makers sold 195,000 units at home and won a 55% domestic share. This local supply base pushes down system costs and speeds up adoption in small and mid-sized plants.
North America is the fastest-growing region in the AI Vision for Manufacturing Market. The US became the world’s second-largest robot market in 2025, passing Japan. It installed 38,400 units, up 12%. Canada rose 5% to almost 4,000 units. Reshoring and new EV and chip plants create greenfield demand for 3D vision and AI software. Leading vision suppliers saw Americas revenue rise 16% in 2025, led by logistics and e-commerce.
Europe holds a strong, mature position built on auto, machinery, and pharma plants. The EU installed 60,500 robots in 2025, down 11%. Germany installed 24,842 units and held 41% of the EU total, but volume fell 8%. Spain added 4,300 units. Strict quality and traceability rules keep inspection spending steady. Firms such as Basler, SICK, Datalogic, and Siemens anchor regional supply.
Key Regions and Countries
North America
- US
- Canada
Europe
- Germany
- France
- The UK
- Spain
- Italy
- Rest of Europe
Asia Pacific
- China
- Japan
- South Korea
- India
- Australia
- Rest of APAC
Latin America
- Brazil
- Mexico
- Rest of Latin America
Middle East and Africa
- GCC
- South Africa
- Rest of MEA
Market Dynamics
Drivers
| Driver | (~) % Impact on CAGR Forecast | Geographic Relevance | Impact Timeline |
|---|---|---|---|
| Expanding vision-guided robot deployments | +0.8% | Global; Asia-led | Short term (2 years or less) |
| Embedded edge-inference commercialization | +0.5% | North America, Europe, East Asia | Short term (2 years or less) |
| Rising inspection-labor replacement demand | +0.4% | Japan, South Korea, Europe, United States | Short term (2 years or less) |
| Battery-production quality-control intensity | +0.4% | China, South Korea, Europe, North America | Medium term (2 to 4 years) |
| Electronics miniaturization inspection complexity | +0.3% | Taiwan, China, South Korea, Southeast Asia | Medium term (2 to 4 years) |
Expanding vision-guided robot deployments
Robot deployment expands the installed base of production cells requiring perception, localization, and inspection, although robot installations indicate potential exposure rather than directly measuring AI-vision sales. Manufacturers installed 542,000 industrial robots in 2024, with Asia accounting for 74% of deployments.
The operational stock reached approximately 4,664,000, up 9%, establishing a substantial retrofit channel alongside new equipment sales. Industrial AI commercialization during 2025 reinforced the shift toward integrated equipment, software, and continuing application support rather than isolated camera sales.
The estimated +0.8 percentage-point contribution is an analyst sensitivity, not an observed growth contribution. Across all tables, percentage entries represent percentage-point sensitivities around the supplied 14.3% baseline: drivers total +2.4 points, restraints −1.7 points, challenges −1.5 points, and conditional opportunities +1.8 points.
The mechanical all-factor case equals 15.3%, while positive-only and negative-only bounds equal 18.5% and 11.1%, respectively; these are scenario checks rather than a re-estimation of the baseline.
Restraints
| Restraint | (~) % Impact on CAGR Forecast | Geographic Relevance | Impact Timeline |
|---|---|---|---|
| Credit-constrained inspection capital expenditure | −0.6% | Global; European SME concentration | Short term (2 years or less) |
| Unfunded line-retrofit expenditure | −0.4% | Global; brownfield manufacturing clusters | Short term (2 years or less) |
| Restricted advanced-computing procurement | −0.3% | Export-controlled destinations and buyers | Medium term (2 to 4 years) |
| Prohibited off-site production-image processing | −0.2% | Defense and proprietary manufacturing sites | Short term (2 years or less) |
| Unapproved safety-critical inspection substitution | −0.2% | Aerospace, medical-device manufacturing hubs | Medium term (2 to 4 years) |
Credit-constrained inspection capital expenditure
Limited access to borrowing can stop otherwise viable inspection purchases before installation, distinguishing this restraint from operational friction after a purchase proceeds.
The euro-area composite borrowing cost for new corporate loans stood at 3.51% in October 2025, providing a regional financing benchmark rather than a global factory borrowing rate. During the opening quarter of 2025, a net 3% of surveyed banks reported tighter corporate credit standards; in the following quarter, a net 5% reported increased SME loan rejections.
The analyst-estimated −0.6 percentage-point sensitivity represents lost or postponed financed orders rather than a proportional mapping from lending statistics. Suppliers serving smaller manufacturers consequently face longer cash-conversion cycles and pressure to finance installations themselves, transferring customer credit risk onto their own balance sheets.
Challenges
| Challenge | (~) % CAGR Friction Drag | Geographic Relevance | Mitigation Horizon |
|---|---|---|---|
| Production-domain model reliability | −0.5% | Global; high-mix manufacturing | Medium term (2 to 4 years) |
| Legacy control-system interoperability | −0.4% | Global; heterogeneous brownfield plants | Medium term (2 to 4 years) |
| Industrial vision engineering shortages | −0.3% | Global; emerging manufacturing hubs | Long term (4 years or more) |
| Optical component sourcing variability | −0.2% | Global; cross-border equipment supply chains | Short term (2 years or less) |
| Operational cybersecurity maintenance burdens | −0.1% | Global; connected production networks | Long term (4 years or more) |
Production-domain model reliability
Differences between development images and operating conditions create a continuing validation burden, reducing repeatability across production lines without necessarily stopping initial sales. Changes in lighting, surface finish, product mix and defect presentation require representative operating data and repeated evaluation; image-level accuracy alone does not establish production-system reliability.
An illustrative analyst model assumes recurring revalidation consumes 10% of delivery capacity: a team nominally supporting 20 annual line deployments would then support 18, absent productivity improvements. These figures are planning assumptions rather than measured industry averages and underpin the estimated −0.5 percentage-point growth friction.
Opportunities
| Opportunity | (~) % Potential CAGR Upside | Geographic Relevance | Execution Window |
|---|---|---|---|
| Remanufacturing core-grading platforms | +0.6% | Europe, North America; selective Asian hubs | Medium term (2 to 4 years) |
| Multispectral food-composition inspection | +0.4% | Global food-processing clusters | Medium term (2 to 4 years) |
| Pharmaceutical packaging genealogy analytics | +0.3% | United States, Europe, India | Medium term (2 to 4 years) |
| Composite subsurface inspection fusion | +0.3% | Aerospace and wind-equipment manufacturing hubs | Long term (4 years or more) |
| Cross-enterprise defect benchmarking exchanges | +0.2% | Multi-tier industrial supplier networks | Long term (4 years or more) |
Remanufacturing core-grading platforms
Automated grading of returned components offers adjacent demand beyond conventional new-part inspection; the future opportunity is a reusable, multi-customer grading platform, not established remanufacturing activity itself.
An existing European remanufacturing operation spans 9 component families and approximately 11,000 references, illustrating the inspection diversity that platform suppliers would need to address. The analyst-estimated +0.6 percentage-point upside remains conditional on adoption and does not imply that current AI-vision penetration has been established.
An illustrative platform model assumes unchanged grading-service revenue per component while delivery cost falls from 60% to 50% of revenue through reusable classification and routing workflows: gross margin would rise from 40% to 50%, a 10 percentage-point improvement, while delivery cost per component would decline approximately 16.7%. These are unit-economic assumptions, not reported manufacturer savings.
Key Players Analysis
Tier 1 leaders combine global reach with large vision revenues. Keyence leads on scale. It posted net sales of JPY 1,059.1 billion (about USD 7.06 billion) and operating income of JPY 549.8 billion for the year ended March 2025. Its latest fiscal year sales rose to JPY 1,169.3 billion.
Cognex is the leading pure-play vision firm. It earned revenue of USD 994.4 million in 2025, up 9%, and spent USD 139 million, or 14% of revenue, on research, development, and engineering. In September 2026, it agreed to buy RealSense for about USD 500 million in cash to enter robotic perception.
Teledyne brings scale in sensors and cameras. Its Digital Imaging segment posted sales of USD 3,163.9 million in 2025, and segment operating income rose 19.5% to USD 528.2 million. Group sales reached USD 6,115.4 million. Teledyne closed a USD 710 million Excelitas deal in February 2025.
Tier 2 challengers hold strong regional or niche roles. Basler, SICK, Datalogic, and OMRON compete in cameras, sensors, and code readers. FANUC, Mitsubishi Electric, Siemens, Rockwell Automation, and ABB bundle vision into robots and control platforms. ABB agreed to sell its Robotics division to SoftBank Group for about USD 5.4 billion in October 2025.
Top Key Players in the Market
- Cognex Corporation
- Keyence Corporation
- Teledyne Technologies Incorporated
- Basler AG
- OMRON Corporation
- SICK AG
- Datalogic S.p.A.
- FANUC CORPORATION
- Mitsubishi Electric Corporation
- Siemens AG
- Rockwell Automation, Inc.
- ABB Ltd
Recent Developments
- In September 2026, Cognex Corporation agreed to acquire RealSense, a depth-sensing camera maker, for about USD 500 million in cash, with closing expected in Q4 2026.
- In August 2026, Teledyne Technologies announced a take-private deal for X-ray imaging firm Varex worth about USD 1.1 billion, or USD 18.90 per share, with closing expected in early 2027.
- In October 2025, ABB Ltd agreed to divest its Robotics division, including its robot vision business, to SoftBank Group for about USD 5.4 billion.
- In March 2025, Siemens AG completed its acquisition of industrial simulation and AI software firm Altair Engineering for about USD 10 billion.
- In February 2025, Teledyne Technologies completed its purchase of select Excelitas aerospace and defense electronics businesses, including Qioptiq optics, for about USD 710 million.
Report Scope
| Report Features | Description |
|---|---|
| Market Value (2025) | USD 2.2 billion |
| Forecast Revenue (2035) | USD 8.3 billion |
| CAGR (2026-2035) | 14.3% |
| Base Year for Estimation | 2025 |
| Historic Period | 2020-2024 |
| Forecast Period | 2026-2035 |
| Report Coverage | Revenue Forecast, Market Dynamics, Competitive Landscape, Recent Developments |
| Segments Covered | By Component (Hardware, AI Vision Software, Services); By Vision Type (2D Machine Vision, 3D Machine Vision); By Application (Quality Assurance and Inspection, Robotics Guidance and Pick-and-Place, Identification and Traceability, Predictive Maintenance and Machinery Inspection, Safety and Compliance Monitoring, Others); By End-User Industry (Electronics and Semiconductor Manufacturing, Automotive and Electric Vehicles, Pharmaceuticals and Healthcare, Food and Beverage, Metals and Machinery, Aerospace and Defense, Other) |
| Regional Analysis | North America – US, Canada; Europe – Germany, France, The UK, Spain, Italy, Rest of Europe; Asia Pacific – China, Japan, South Korea, India, Australia, Singapore, Rest of APAC; Latin America – Brazil, Mexico, Rest of Latin America; Middle East & Africa – GCC, South Africa, Rest of MEA |
| Competitive Landscape | Cognex Corporation, Keyence Corporation, Teledyne Technologies Incorporated, Basler AG, OMRON Corporation, SICK AG, Datalogic S.p.A., FANUC CORPORATION, Mitsubishi Electric Corporation, Siemens AG, Rockwell Automation, Inc., ABB Ltd |
| Customization Scope | Customization for segments, region/country-level will be provided. Moreover, additional customization can be done based on the requirements. |
| Purchase Options | We have three licenses to opt for: Single User License, Multi-User License (Up to 5 Users), Corporate Use License (Unlimited Users and Printable PDF) |





























