


Market Overview
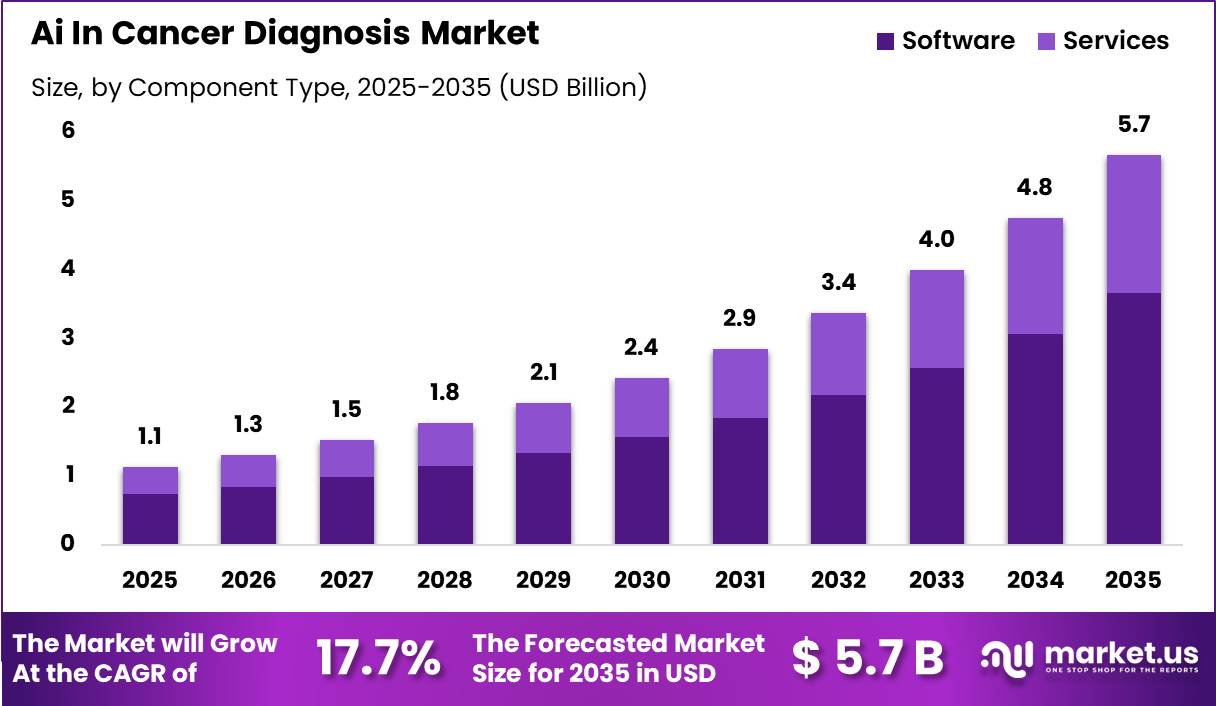
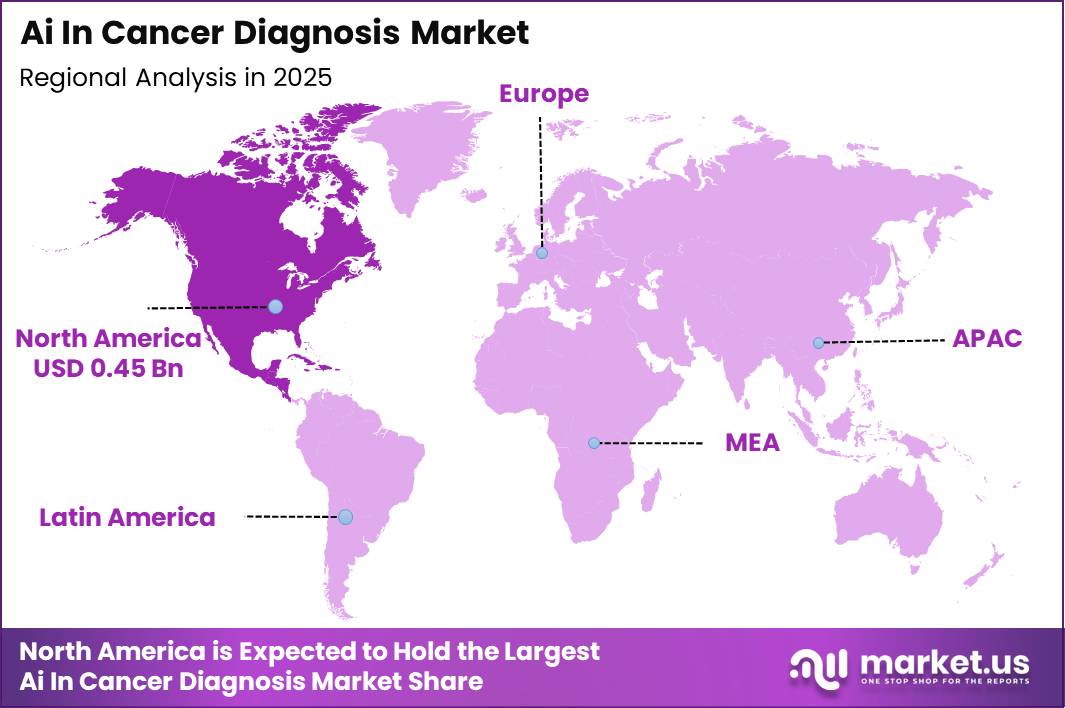
Global Ai In Cancer Diagnosis Market size is expected to be worth around US$ 5.7 Billion by 2035 from US$ 1.1 Billion in 2025, growing at a CAGR of 17.7% during the forecast period from 2026 to 2035. In 2025, North America led the market, achieving over 39.4% share with a revenue of US$ 0.45 Billion.
Artificial intelligence (AI) is rapidly transforming cancer diagnosis by enhancing early detection, improving accuracy, and supporting clinical decision-making across healthcare systems worldwide. According to the U.S. National Cancer Institute (NCI), AI technologies are being applied across the cancer care continuum from pattern recognition in complex clinical and imaging data to improved algorithms for diagnostic support in cancer screening and pathology.
AI-based diagnostic tools, including machine learning models and image analysis software, can identify patterns in large datasets that are difficult for clinicians to detect manually, enabling earlier and more precise identification of cancers in imaging and pathology workflows.
The U.S. Food and Drug Administration (FDA) recognizes the potential of AI in medical devices to automate and enhance diagnostic accuracy, while continuing to assess safety and effectiveness through regulatory evaluation frameworks.
Governments are increasingly deploying AI to improve patient outcomes: in the UK, AI technologies have accelerated cancer diagnosis for over 4 million patients, with a £20 million investment to expand proven tools across all NHS trusts by 2029.
AI’s integration into cancer diagnosis supports clinicians in interpreting imaging, reducing diagnostic delays, and enabling personalized care decisions. As AI models evolve, continued validation, ethical oversight, and regulatory guidance remain essential to ensure these technologies deliver reliable and equitable benefits to patients globally.
Key Takeaways
- Market Size: The global Ai In Cancer Diagnosis Market was valued at US$ 1.1 Billion in 2025.
- Market Share: The global Ai In Cancer Diagnosis Market is projected to grow at a CAGR of 17.7% and is estimated to reach US$ 5.7 Billion by 2035.
- Component Analysis: Software dominated the market, accounting for 64.5% of the total market share in 2025.
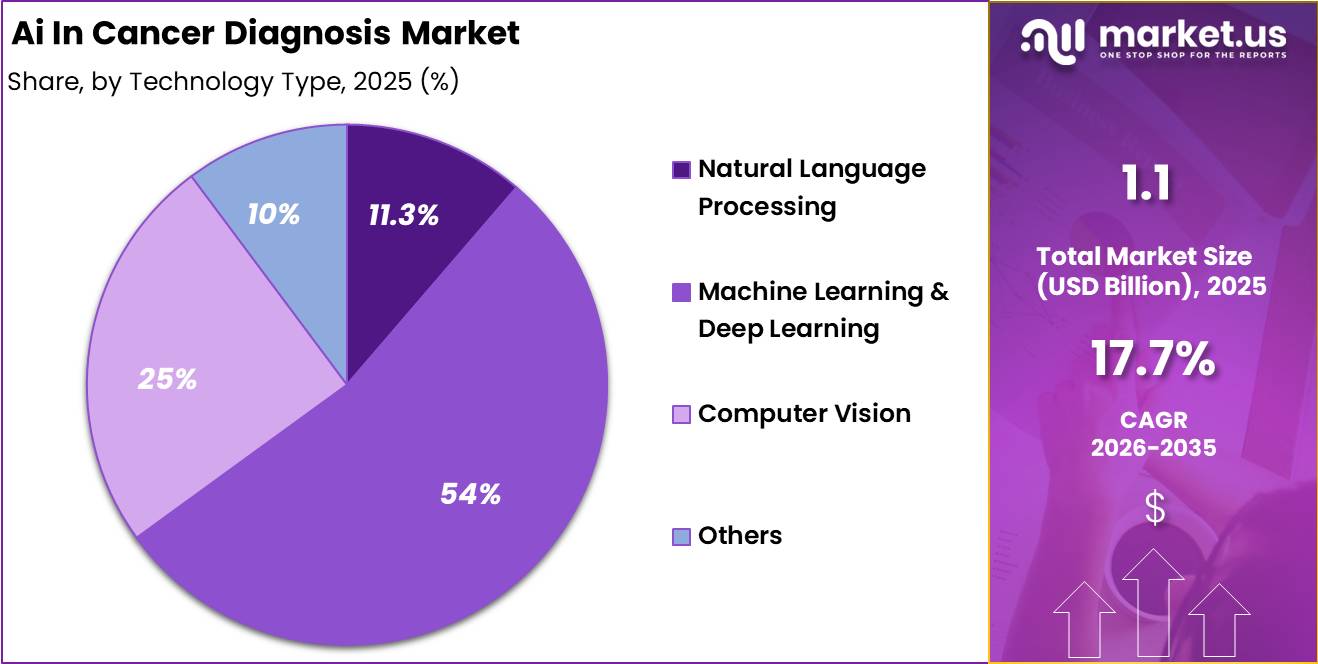
- Technology Analysis: Machine Learning & Deep Learning dominated the market, constituting 53.7% of the total market share.
- Cancer Type Analysis: Breast Cancer dominated the market, constituting 30.7% of the total market share.
- Application Analysis: Clinical Decision Support dominated the market, constituting 26.8% of total market share.
- End Use Analysis: Hospitals & ASCs dominated the market, constituting 54.3% of the total market share.
- Regional Analysis: In 2025, North America led the market, achieving over 39.4% share with a revenue of US$ 0.45 Billion.
Component Analysis
The software segment dominates the AI in cancer diagnosis market, accounting for 64.5% of total market share in 2025. This leadership is driven by the widespread adoption of AI-powered platforms that support image analysis, predictive modeling, workflow automation, and diagnostic decision support. Software solutions are increasingly embedded into radiology, pathology, and oncology information systems, enabling faster tumor detection, risk stratification, and treatment planning.
Continuous algorithm updates, cloud-based deployment, and scalability across multiple cancer types further strengthen software adoption. Hospitals and diagnostic centers prefer software solutions due to their ability to integrate with existing IT infrastructure and electronic health records, reducing operational friction.
The services segment, holding 35.5% market share, plays a critical complementary role. Services include implementation, system integration, training, data annotation, and ongoing model optimization. As AI systems require customization to local datasets and clinical workflows, demand for professional and managed services remains strong.
Service providers also support regulatory compliance, cybersecurity, and performance validation, especially in multi-site healthcare networks. While software remains the primary revenue contributor, services are essential for successful deployment, long-term performance, and clinical acceptance of AI-driven cancer diagnostic solutions.
Technology Analysis
Machine Learning (ML) and Deep Learning (DL) technologies dominate the AI in cancer diagnosis market, capturing 53.7% market share in 2025. Their dominance is driven by superior performance in image recognition, pattern detection, and predictive analytics across radiology, pathology, and genomics.
Deep learning models, particularly convolutional neural networks, are widely used for tumor detection, lesion segmentation, and malignancy classification in imaging modalities such as CT, MRI, and digital pathology. These technologies continuously improve diagnostic accuracy by learning from large and diverse datasets, making them central to early cancer detection and prognosis modeling.
Computer Vision, accounting for 24.8% market share, is a critical enabling technology, especially for analyzing medical images and histopathology slides. It supports automated feature extraction, anomaly detection, and real-time image interpretation, reducing diagnostic variability and clinician workload.
Natural Language Processing (NLP) holds 11.3% market share, focusing on extracting clinical insights from unstructured data such as pathology reports, radiology notes, and oncology records. NLP supports clinical documentation, cancer staging, and treatment recommendation systems. While ML and DL remain dominant, NLP and computer vision enhance data interoperability and clinical context understanding.
Cancer Type Analysis
Breast cancer represents the largest cancer-type segment in the AI in cancer diagnosis market, holding 30.7% market share in 2025. This dominance is supported by high global screening volumes, widespread mammography programs, and strong adoption of AI tools for image interpretation.
AI solutions are extensively used to improve lesion detection, reduce false positives, and assist radiologists in identifying early-stage malignancies. The availability of large, well-annotated breast imaging datasets has accelerated algorithm training and regulatory validation, further strengthening adoption.
Other major cancer types, including lung, colorectal, prostate, and cervical cancers, collectively contribute a substantial share of the market. Lung cancer diagnosis benefits from AI-based analysis of CT scans for pulmonary nodule detection and risk assessment. Colorectal and prostate cancers leverage AI in pathology and imaging to enhance grading accuracy and disease stratification.
Hematological and rare cancers represent emerging opportunities, as AI is increasingly applied to genomic and molecular data analysis. While breast cancer remains the leading segment due to screening intensity and mature AI tools, expansion across multiple cancer types is broadening the overall market footprint.
Application Analysis
Clinical Decision Support (CDS) is the leading application segment in the AI in cancer diagnosis market, accounting for 26.8% market share in 2025. CDS systems assist clinicians by analyzing patient data, imaging results, and pathology findings to support accurate diagnosis, cancer staging, and treatment selection.
These tools help reduce diagnostic variability, improve confidence in complex cases, and enable evidence-based oncology decisions. Integration with hospital information systems and oncology workflows further drives adoption.
Other key applications include medical imaging analysis, pathology analysis, risk assessment, and screening support. Imaging-focused applications are widely used in radiology for tumor detection and monitoring disease progression, while pathology applications support digital slide interpretation and biomarker identification. Screening applications leverage AI to manage high patient volumes and prioritize suspicious cases for further review.
Research and drug development applications are also gaining traction, using AI to analyze real-world oncology data and identify diagnostic patterns. While CDS remains the largest segment due to its direct clinical impact, expanding AI use across diagnostic and research applications continues to strengthen market growth.
End Use Analysis
Hospitals and Ambulatory Surgery Centers (ASCs) dominate the AI in cancer diagnosis market, holding 54.3% market share in 2025. Their leadership is driven by high patient volumes, access to advanced imaging and diagnostic infrastructure, and the growing need for efficient, accurate cancer diagnosis.
Hospitals are early adopters of AI solutions to support radiologists, pathologists, and oncologists in managing complex diagnostic workloads while improving clinical outcomes. ASCs increasingly deploy AI tools to enhance diagnostic speed and optimize outpatient oncology workflows.
Diagnostic laboratories represent another important end-use segment, particularly in pathology and molecular diagnostics. AI-enabled digital pathology systems help labs improve consistency, reduce turnaround times, and manage rising test volumes. Research institutes and academic centers also contribute to market growth by using AI platforms for clinical trials, biomarker discovery, and algorithm development.
Smaller healthcare facilities and specialty clinics are gradually adopting AI solutions as cloud-based platforms reduce cost and infrastructure barriers. While hospitals and ASCs remain the primary users due to scale and resources, expanding adoption across laboratories and research settings continues to diversify end-use demand.
Market Segmentations
By Component
- Software
- Services
By Technology
- Natural Language Processing
- Machine Learning & Deep Learning
- Computer Vision
- Others
By Cancer Type
- Brain Tumor
- Breast Cancer
- Colorectal Cancer
- Lung Cancer
- Prostate Cancer
- Others
By Application
- Clinical Decision Support
- Quantification & Biomarker scoring
- Screening support
- Staging support
- Triage & prioritization
- Others
By End Use
- Hospitals & ASCs
- Diagnostic Laboratories
- Research & Academic Institutes
- Others
Drivers
Filler procedure expansion and injector throughput demand
Global non surgical aesthetics volumes continue to create a larger installed base for disposable injection accessories, with ISAPS reporting 20.5 million nonsurgical procedures in 2024 and 6.3 million hyaluronic acid filler procedures, up 5.2% year over year.
Total aesthetic procedures were close to 38 million, and the U.S. alone accounted for more than 6.1 million procedures across surgical and nonsurgical categories. That matters directly for needles and cannulas because every filler session converts procedure growth into recurring unit demand at the point of care, while higher injector calendars improve reorder frequency for single use sterile accessories.
Commercially, this supports a consumption led model rather than a capital equipment model: distributors win on clinic penetration, SKU availability, gauge length mix, and just in time supply reliability, especially in high velocity facial practices where even modest patient growth can compound annual accessory pull through.
| Driver | (~) % Impact on CAGR Forecast | Geographic Relevance | Impact Timeline |
|---|---|---|---|
| Filler procedure expansion and injector throughput demand | +2.4% | North America core, Western Europe, Japan, South Korea, GCC, urban China | Short term |
| Safety shift toward blunt-tip cannula use in high-risk facial zones | +1.9% | North America core, EU, UK, Australia, advanced APAC clinics | Short term |
| Tightening device oversight and traceability favoring compliant suppliers | +1.5% | EU core, UK, U.S., Japan, South Korea | Medium term |
| Premiumization of minimally invasive facial rejuvenation | +1.7% | U.S., Brazil, Japan, South Korea, EU metros, Middle East private clinics | Medium term |
| Training-led clinic standardization and protocolization | +1.2% | North America, EU, GCC, Southeast Asia private chains | Short term |
| Cross-border aesthetics and outpatient procedure migration | +0.9% | Turkiye, UAE, Colombia, Thailand spill-over; EU and North America referral markets | Medium term |
Challenges
Competitive pressure from alternative aesthetic modalities
Competitive device and modality pressure reflects the reality that aesthetic needles and cannulas compete not only with each other but also with alternative delivery technologies and non injectable modalities, such as energy based devices, micro focused ultrasound, and novel drug delivery systems, all within a broader minimally invasive aesthetics market that is expanding rapidly but fragmenting across multiple technology platforms.
As next generation facial injectables, including longer lasting fillers and combination products, gain traction, some segments of demand shift toward formulations delivered through specific proprietary systems or prefilled syringes that reduce the need for interchangeable third party cannulas, while in parallel, advances in device based skin tightening or contouring allow certain patient cohorts to delay or substitute away from filler heavy regimens.
This does not eliminate the role of cannulas and needles given their centrality in a large share of injectable procedures but it introduces a competitive ceiling in some indication segments, especially where payers or patients seek to limit total procedure spend or prefer modalities perceived as less invasive.
Quantitatively, if 10 to 15% of prospective injectable patients in certain urban clusters opt for non injectable alternatives or proprietary delivery platforms over time, the addressable volume growth for generic cannulas in those segments is trimmed accordingly, yielding an estimated 0.4% point drag on the broader market’s CAGR even as overall aesthetic expenditure grows robustly.
Strategically, cannula and needle manufacturers must position themselves as integral partners to both traditional injectables and emerging hybrid protocols by co developing optimized devices for specific products.
Securing preferred supplier status with leading filler and toxin brands, and investing in clinical evidence that demonstrates safety and outcome benefits of advanced cannula techniques versus sharp needles or alternative modalities; this includes quantifying reductions in bruising, downtime, or complication rates in thousands of cases, thereby strengthening the economic case for clinics to maintain or increase cannula based procedure volumes despite the expanding set of competing technologies.
| Challenge | (~) % CAGR Friction Drag | Geographic Relevance | Mitigation Horizon |
|---|---|---|---|
| Sterile supply chain volatility | -0.8% | North America, EU, APAC hubs | Medium term (2-4 years) |
| Regulatory-quality compliance load | -0.7% | EU regulatory hubs, North America, Middle East | Long term (≥ 4 years) |
| Injector skill and staffing gaps | -0.9% | North America core, APAC metros, LATAM | Long term (≥ 4 years) |
| Medical-grade input cost volatility | -0.6% | EU, North America, China, ASEAN | Medium term (2-4 years) |
| OEM–clinic integration inefficiencies | -0.5% | Global tier-2/3 cities | Short term (≤ 2 years) |
| Competitive device and modality pressure | -0.4% | Global premium aesthetics clusters | Medium term (2-4 years) |
Restraints
Emerging market localization and tightening device regulatory burdens
A second restraint arises from the rapid tightening of medical device regulation and localization policies in high growth emerging markets such as India, select ASEAN economies, and Gulf states, subtracting an estimated 1.2 % points from global CAGR as foreign OEMs absorb registration delays, local content rules, and interim sales disruptions.
India’s expanded Medical Device Rules, which broadened the number of devices under licensing and set phased deadlines for Class AD devices, created a structural shift where previously unregulated or lightly regulated aesthetic needles and cannulas must secure manufacturing and import licenses, often with documentation similar to EU or US standards.
For foreign suppliers that historically served India on a semi opportunistic basis, the need to build CDSCO compliant technical files, align labeling, obtain plant inspections, and maintain local authorized representatives can add 6 to 12 months to market entry timelines and mid six figure dollar outlays in regulatory and legal costs.
Simultaneously, national strategies such as India’s National Medical Device Policy 2023, which aims to reduce import dependence that currently covers roughly 80% of devices by pushing domestic production and potential price controls via a National List of Essential Medical Devices, create uncertainty around long term pricing and viable operating margins for imported aesthetic cannulas, especially if they are grouped with broader injection devices subject to ceilings.
Similar dynamics play out in ASEAN markets for example Thailand and Indonesia where device listing, importer licensing, and occasional ad hoc import controls can intermittently halt shipments for 1 to 3 quarters, forcing multinationals to hold higher in country buffer inventory or risk stock outs.
From a strategic lens, these regulatory and localization shifts cause OEMs to reevaluate the ROI of entering or expanding in these markets, delay facility investments until clearer incentives or cluster policies emerge, and, in the interim, to focus on fewer key distributors, all of which dampens penetration rates for premium aesthetic cannulas and reduces the contribution of high growth emerging corridors to the global demand curve.
| Restraint | (~) % Impact on CAGR Forecast | Geographic Relevance | Impact Timeline |
|---|---|---|---|
| Stricter device regulations & MDR bottlenecks | -1.8% | EU, UK, EEA, selective LATAM | Medium term (2-4 years) |
| Emerging-market regulatory tightening & localization | -1.2% | India, ASEAN, Middle East | Medium term (2-4 years) |
| Sterile supply chain & input cost inflation | -1.5% | North America, EU, APAC hubs | Short term (≤ 2 years) |
| OEM capacity constraints & long lead times | -1.0% | Global export-oriented hubs | Short term (≤ 2 years) |
| Pricing pressure from commoditization & tendering | -1.3% | EU, APAC hospital channels | Long term (≥ 4 years) |
| Talent, training & adverse-event risk in aesthetics | -0.9% | North America, EU, urban APAC | Long term (≥ 4 years) |
Opportunity
Cross border premium aesthetic treatment hubs integration model
A significant long-term opportunity exists in integrating premium treatment hubs across major medical tourism destinations such as Turkey, Thailand, the UAE, and South Korea. Cannula and needle suppliers can strengthen growth by establishing preferred partnerships with destination clinics that serve international patients.
While current market expansion is primarily driven by domestic aesthetic procedures, cross-border medical travel offers additional demand through high-volume, package-based treatments and standardized premium care pathways. The ongoing shift toward ambulatory care, supported by OECD trends, and the continued popularity of elective medical tourism create favorable conditions for this strategy.
Suppliers can benefit from higher consumable utilization, faster inventory turnover, and expanded premium product adoption. Expected outcomes include 1.3x–1.6x higher consumable usage, 20%–30% shorter reorder cycles, and 18%–25% higher account revenue through post-procedure care kit sales.
| Opportunity | (~) % Potential CAGR Upside | Geographic Relevance | Execution Window |
|---|---|---|---|
| Regenerative injectables kits | +1.9% | North America core, EU, East Asia | Medium term |
| Neck-body indication expansion | +1.6% | U.S., GCC, South Korea, urban China | Short term |
| Injector-as-a-service bundles | +1.4% | North America, EU, ANZ | Short term |
| APAC tier-2 clinic penetration | +2.1% | India, Southeast Asia, inland China | Medium term |
| Safety-led cannula conversion | +1.2% | U.S., EU, Brazil, Mexico | Short term |
| Cross-border premium treatment hubs | +1.5% | Turkey, Thailand, UAE, South Korea | Long term |
Regional Analysis
In 2025, North America led the market, achieving over 39.4% share with a revenue of US$ 0.45 Billion.
In 2025, North America region’s leadership is driven by early adoption of AI-enabled clinical decision support systems, high oncology diagnostic volumes, and strong integration of machine learning and computer vision tools in hospitals and imaging centers. Favorable regulatory pathways for AI-based medical software and widespread use of electronic health records further support deployment across cancer screening, radiology, and pathology workflows.
Europe represents the second-largest market, supported by increasing public investments in digital health, strong academic–industry collaboration, and rising cancer incidence across aging populations. Countries such as Germany, the UK, and France are actively integrating AI into national cancer screening and precision oncology programs, particularly for breast, lung, and colorectal cancer diagnostics.
The Asia Pacific market is witnessing the fastest growth, fueled by expanding healthcare infrastructure, growing awareness of early cancer detection, and rapid adoption of AI technologies in countries like China, Japan, and South Korea. Large patient populations and government-led AI initiatives are accelerating clinical validation and commercialization.
Meanwhile, Latin America and Middle East & Africa remain emerging markets. Growth in these regions is supported by gradual digitalization of oncology services, pilot AI deployments in urban hospitals, and increasing partnerships with global health technology providers, although adoption remains constrained by limited infrastructure and funding disparities.
Key Regions and Countries
North America
- The US
- Canada
Europe
- Germany
- France
- The U.K.
- Italy
- Spain
- Russia & CIS
- Rest of Europe
Asia Pacific
- China
- India
- Japan
- South Korea
- ASEAN
- Australia & New Zealand
- Rest of Asia Pacific
Middle East & Africa
- GCC
- South Africa
- Rest of Middle East & Africa
Latin America
- Brazil
- Mexico
- Rest of Latin America
Key Player Analysis
The AI in cancer diagnosis market exhibits a moderately fragmented structure, characterized by the coexistence of large technology and imaging incumbents alongside specialized AI-native innovators. The market remains in an early-to-mid commercialization stage, with competitive differentiation driven by algorithmic performance, clinical validation depth, and integration into oncology workflows.
Innovation is primarily centered on precision diagnostics, multimodal data interpretation, biomarker-driven stratification, and scalable deployment across imaging, pathology, and real-world evidence platforms.
Market Structure and Strategic Tiers
- Tier I: Global imaging and technology platforms Large, diversified players such as GE HealthCare, Siemens Healthineers AG, IBM Corporation, NVIDIA Corporation, and Roche Diagnostics anchor the market through enterprise-scale deployment, regulatory experience, and deep integration with imaging hardware, pathology systems, and hospital IT infrastructure.
- Tier II: Data-driven and workflow-focused specialists Companies such as ConcertAI, Flatiron, Median Technologies, and MVision AI Inc. compete by embedding AI into oncology decision support, clinical trials, and real-world evidence generation.
- Tier III: Innovation-led AI diagnostics developers Specialized innovators including Digital Diagnostics Inc., Paige AI Inc., Kheiron Medical Technologies Limited, iCAD, Inc., Therapixel, and Freenome Holdings Inc. focus on disease-specific models, multimodal biomarker discovery, and prospective clinical validation.
Top Key Players
- ConcertAI
- Digital Diagnostics Inc.
- Flatiron
- Freenome Holdings Inc.
- GE HealthCare
- IBM Corporation
- iCAD, Inc.
- Kheiron Medical Technologies Limited
- Median Technologies
- MVision AI Inc.
- NVIDIA Corporation
- Paige AI Inc.
- Roche Diagnostics
- Siemens Healthineers AG
- Therapixel
Recent Developments
- In January 2025, iCAD continued expanding deployment of its AI-powered breast cancer detection technologies through new healthcare provider implementations and commercialization initiatives for mammography AI solutions.
- In March 2025, GE HealthCare expanded its AI-enabled oncology imaging portfolio through new imaging workflow and precision diagnostics innovations showcased for cancer imaging applications
- In March 2025, Siemens Healthineers expanded AI-enabled imaging capabilities for oncology through new diagnostic imaging software enhancements supporting cancer detection and workflow automation
Report Scope
| Report Features | Description |
|---|---|
| Market Value (2025) | US$ 1.1 Billion |
| Forecast Revenue (2035) | US$ 5.7 Billion |
| CAGR (2026-2035) | 17.7 % |
| Base Year for Estimation | 2025 |
| Historic Period | 2020-2024 |
| Forecast Period | 2026-2035 |
| Report Coverage | Revenue Forecast, Market Dynamics, Competitive Landscape, Recent Developments |
| Segments Covered | By Component (Software, Services)By Technology(Natural Language Processing, Machine Learning & Deep Learning, Computer Vision, Others) By Cancer Type(Brain Tumor, Breast Cancer, Colorectal Cancer, Lung Cancer, Prostate Cancer) By Application (Clinical Decision Support, Quantification & Biomarker scoring, Screening support , Staging support, Triage & prioritization) By End Use (Hospitals & ASCs, Diagnostic Laboratories, Research & Academic Institutes) |
| Regional Analysis | North America – The US, Canada; Europe – Germany, France, U.K., Italy, Spain, Russia & CIS, Rest of Europe; Asia Pacific – China, India, Japan, South Korea, ASEAN, Australia & New Zealand, Rest of Asia Pacific; Middle East & Africa – GCC, South Africa, Rest of Middle East & Africa; Latin America – Brazil, Mexico, Rest of Latin America |
| Competitive Landscape | ConcertAI ,Digital Diagnostics Inc. ,Flatiron ,Freenome Holdings Inc. ,GE HealthCare ,IBM Corporation ,iCAD, Inc. ,Kheiron Medical Technologies Limited ,Median Technologies ,MVision AI Inc. ,NVIDIA Corporation ,Paige AI Inc. ,Roche Diagnostics, Siemens Healthineers AG ,Therapixel |
| Customization Scope | Customization for segments, region/country-level will be provided. Moreover, additional customization can be done based on the requirements. |
| Purchase Options | We have three licenses to opt for: Single User License, Multi-User License (Up to 5 Users), Corporate Use License (Unlimited User and Printable PDF) |





































