Report Overview
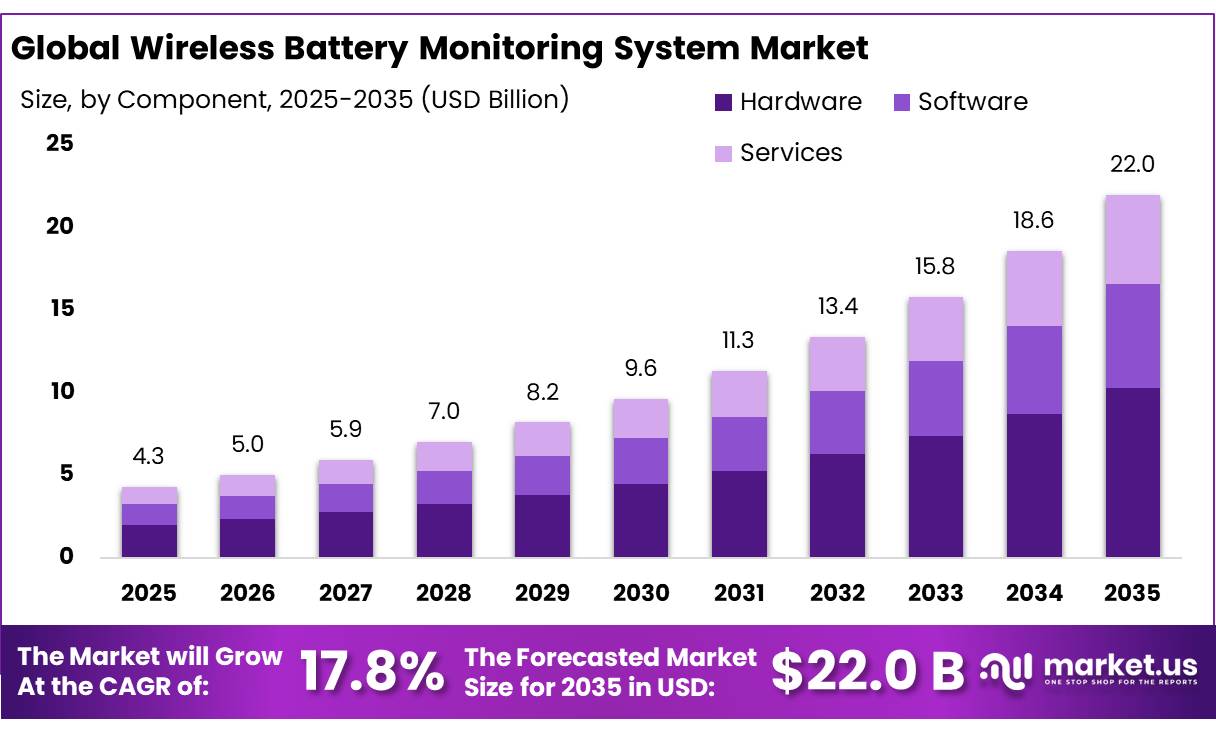
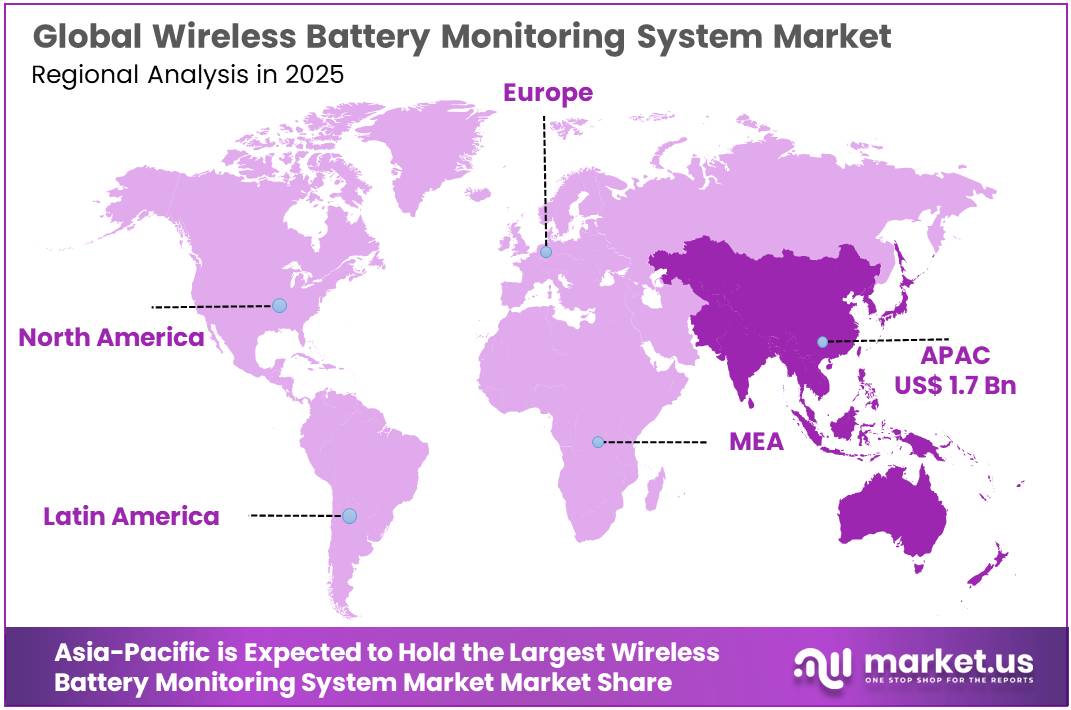
The Global Wireless Battery Monitoring System Market size is expected to be worth around USD 22.0 Billion by 2035, from USD 4.3 Billion in 2025, growing at a CAGR of 17.8% during the forecast period from 2026 to 2035. In 2025, Asia-Pacific held a dominant market position, capturing more than a 39.67% share, holding USD 1.7 Billion revenue.
The Wireless Battery Monitoring System industry is gaining importance as industrial facilities, power utilities, data centers, telecommunications networks, and energy storage operators increasingly depend on reliable battery performance. A Wireless Battery Monitoring System uses wireless sensors, communication modules, and monitoring software to collect battery operating information, including voltage, current, temperature, internal resistance, and state of charge. The system helps operators identify abnormal battery conditions, detect early signs of failure, reduce manual inspection, and improve battery life.
- According to the International Energy Agency (IEA), global lithium-ion battery manufacturing capacity exceeded 4 terawatt-hours (TWh) in 2025, representing approximately 30% growth compared with 2024. This expansion reflects increasing investment in battery production, electric mobility, and stationary energy storage. As battery installations become larger and more complex, manufacturers and operators require advanced monitoring technologies to maintain operational reliability, identify temperature variations, and manage battery performance.
Energy storage deployment is another important factor supporting industrial demand. The IEA reported that worldwide battery storage additions reached 108 GW in 2025, approximately 40% higher than in 2024. Lithium iron phosphate batteries accounted for around 90% of battery storage deployments, reflecting their growing use in applications requiring frequent charging and discharging. This increasing installation of battery systems creates opportunities for wireless monitoring providers to supply real-time battery condition tracking, remote diagnostics, temperature monitoring, and predictive maintenance solutions.
- The United States is also experiencing significant growth in stationary battery installations. According to the U.S. Energy Information Administration (EIA), operational utility-scale battery storage capacity reached 43.6 GW by the end of 2025. Another 8.3 GW was added during the first six months of 2026, bringing capacity to nearly 52 GW. This expanding infrastructure increases the need for continuous battery monitoring across electricity networks, renewable energy installations, and utility-scale storage facilities.
Government-supported industrial safety requirements and technical standardization are also influencing technology adoption. The U.S. Occupational Safety and Health Administration (OSHA) highlights lithium-ion battery safety risks and the importance of appropriate hazard controls in battery manufacturing and operating environments. In addition, IEEE 2686-2024 provides recommended practices for battery management systems in stationary energy storage applications, including battery protection, interoperability, and cybersecurity considerations.
Technological developments in wireless communication, Internet of Things (IoT) sensors, cloud-based analytics, and artificial intelligence are creating further growth opportunities. The International Telecommunication Union (ITU) has a battery-monitoring-related standardization initiative covering ambient-powered wireless sensors for energy storage safety monitoring. Its published work programme indicates that this technology could reduce wiring requirements by up to 90% compared with conventional wired sensors.
Key Takeaways
- Wireless Battery Monitoring System Market size is expected to be worth around USD 22.0 Billion by 2035, from USD 4.3 Billion in 2025, growing at a CAGR of 17.8%.
- Hardware held a dominant market position, capturing more than a 46.70% share.
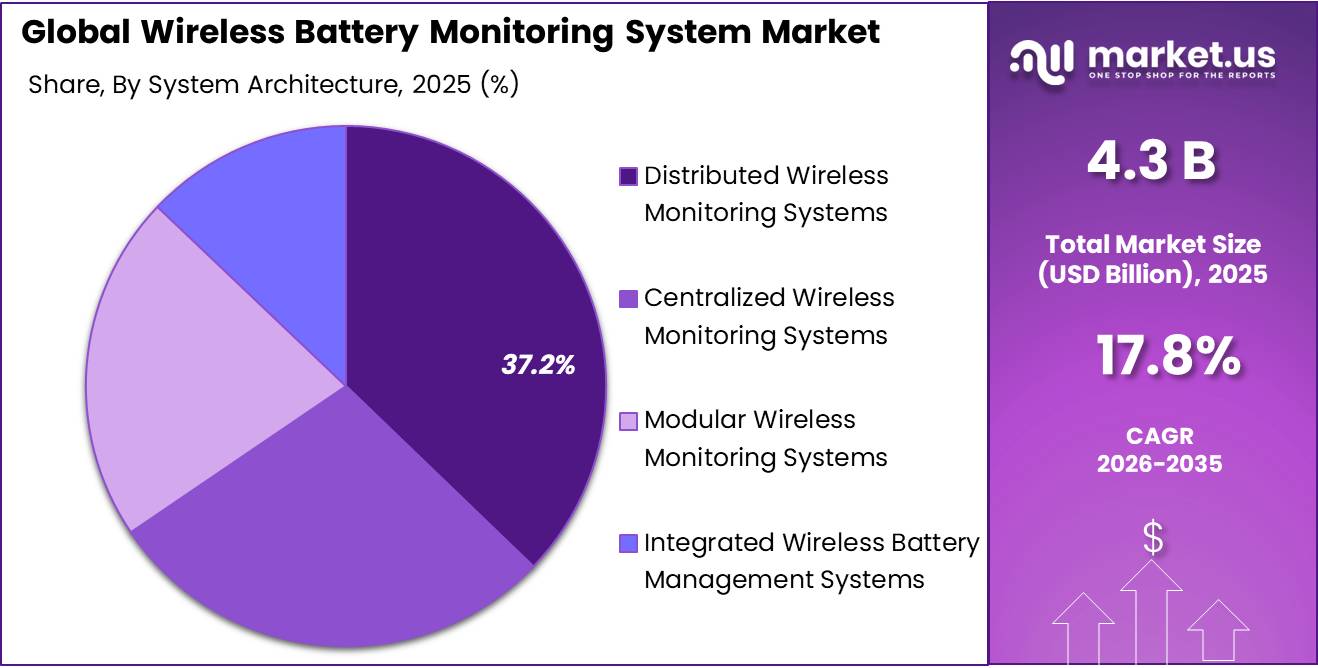
- Distributed Wireless Monitoring Systems held a dominant market position, capturing more than a 37.21% share.
- Automotive Manufacturers and Battery Pack Suppliers held a dominant market position, capturing more than a 31.50% share.
- Asia-Pacific dominates the Wireless Battery Monitoring System Market, accounting for 39.67% of the market, valued at USD 1.7 billion.
By Component Analysis
Hardware dominates through its essential role in real-time battery measurement, data collection, and system reliability.
In 2025, “Hardware” held a dominant market position, capturing more than a 46.70% share of the Wireless Battery Monitoring System Market by Component. Hardware plays a central role because it includes wireless sensors, battery monitoring units, communication modules, gateways, and control devices required to collect battery operating information.
In 2025, increasing battery storage installations and the expansion of industrial backup power infrastructure supported demand for reliable monitoring hardware. The U.S. Energy Information Administration reported 43.6 GW of operational utility-scale battery storage capacity in the United States at the end of 2025, highlighting the growing requirement for monitoring equipment across large battery installations.
Software is an important component of the Wireless Battery Monitoring System Market as it processes information collected through wireless sensors and converts it into useful operational insights. Battery monitoring software enables operators to track voltage, temperature, state of charge, and battery health through centralized dashboards. In 2025 and 2026, increasing adoption of cloud-based monitoring, artificial intelligence, and predictive maintenance solutions strengthened the importance of software in industrial battery management.
Software platforms also help identify performance irregularities, generate maintenance alerts, maintain historical battery records, and support remote diagnostics. The U.S. Department of Energy’s research and development activities in battery technologies support improvements in battery management, monitoring, and performance evaluation. These developments create opportunities for software providers offering advanced analytics, cybersecurity, remote access, and integration with industrial energy management platforms.
By System Architecture Analysis
Distributed Wireless Monitoring Systems dominate due to their flexible installation, independent sensor operation, and suitability for large battery installations.
In 2025, “Distributed Wireless Monitoring Systems” held a dominant market position, capturing more than a 37.21% share of the Wireless Battery Monitoring System Market by System Architecture. These systems use multiple wireless monitoring units placed across individual batteries or battery groups to collect operating information and transmit it to a centralized monitoring platform. This architecture supports continuous monitoring of voltage, temperature, and battery health while reducing complex wiring requirements.
In 2025, growing deployment of utility-scale battery storage and industrial backup power systems supported demand for distributed monitoring solutions. According to the U.S. Energy Information Administration, the United States had 43.6 GW of operational utility-scale battery storage capacity at the end of 2025. The expansion of these installations increases the need for scalable monitoring systems that can identify battery-level performance issues and support preventive maintenance.
Centralized Wireless Monitoring Systems are gaining attention as industrial operators seek a single platform to monitor battery performance across connected installations. These systems collect information from wireless battery sensors and transmit it to a central gateway or controller, where operators can review battery conditions, receive alerts, and assess performance.
In 2025 and 2026, centralized monitoring solutions remained relevant for data centers, telecommunications facilities, industrial backup power, and energy storage installations that require coordinated battery supervision. Their ability to provide a consolidated view of battery voltage, temperature, and operating conditions supports maintenance planning and operational control.
By End User Analysis
Automotive Manufacturers and Battery Pack Suppliers dominate due to the growing need for battery safety, performance tracking, and quality control.
In 2025, “Automotive Manufacturers and Battery Pack Suppliers” held a dominant market position, capturing more than a 31.50% share of the Wireless Battery Monitoring System Market by End User. This segment benefits from the increasing use of advanced battery monitoring technologies in electric vehicles and battery manufacturing operations. Automotive manufacturers and battery pack suppliers use wireless monitoring systems to track voltage, temperature, battery health, and operating conditions during battery testing, assembly, and vehicle operation.
These systems help identify abnormal battery behaviour, improve quality checks, and support preventive maintenance. In 2025, the expansion of global battery manufacturing and electric vehicle production strengthened the need for accurate and continuous battery monitoring. The segment is also supported by the growing focus on battery safety, operational reliability, and improved battery performance across automotive applications.
Energy Storage System Operators are an important end-user segment as utility-scale battery installations and renewable energy storage projects require continuous monitoring to maintain safe and reliable operations. These operators use wireless battery monitoring systems to track battery voltage, temperature, state of charge, and overall battery health. The technology helps identify abnormal operating conditions, reduce unexpected downtime, and improve maintenance planning across large storage facilities.
In 2025, the U.S. Energy Information Administration reported 43.6 GW of operational utility-scale battery storage capacity in the United States. During the first six months of 2026, another 8.3 GW was added, taking installed capacity to nearly 52 GW. This expansion creates additional opportunities for wireless monitoring providers as storage operators require scalable solutions for remote supervision, battery fault detection, and predictive maintenance.
Key Market Segments
By Component
- Hardware
- Software
- Services
By System Architecture
- Centralized Wireless Monitoring Systems
- Distributed Wireless Monitoring Systems
- Modular Wireless Monitoring Systems
- Integrated Wireless Battery Management Systems
By End User
- Automotive Manufacturers and Battery Pack Suppliers
- Energy Storage System Operators
- Telecommunications Operators
- Data Center Operators
- Industrial and Manufacturing Facilities
- Utilities and Renewable Energy Developers
- Other End Users
Driver Analysis
Protein-Led Portfolio Renewal
Protein-enriched pasta gives manufacturers an established staple through which to recruit nutrition-focused buyers without requiring them to adopt a distinctly unfamiliar food, shifting value capture from basic carbohydrate supply toward a differentiated nutritional product. Barilla’s 2025 reporting records the launch of plant-based Protein+ in Italy, France and Germany and Catelli Protein+ in Canada; its European formulation combines durum wheat semolina with pea protein and provides 20 g protein per 100 g dry product.
The company calculates 80 protein-derived kcal out of 354 total kcal, approximately 22.6%, exceeding the EU high-protein threshold of 20% of energy; that threshold concerns energy share, not simply grams of protein per serving.
In an illustrative program recruiting 200,000 incremental households purchasing one 400-g pack monthly, annual gross volume reaches 960 tonnes. At an assumed USD 3/kg manufacturer realization, gross revenue is USD 2.88 million; if 70% replaces purchases of existing vegan-compatible pasta, net incremental volume-linked revenue falls to USD 864,000. Any additional quality-related mix improvement should be calculated separately and must not be confused with inflation.
Manufacturers need acceptable texture, cooking tolerance and repeat purchase to retain the premium: protein content alone does not establish a better overall nutritional profile. The +0.8 pp contribution assumes 20% revenue exposure grows 4.0 percentage points faster through incremental purchasing and defensible product-quality mix, excluding simple relabeling and sales assigned to gluten-free recruitment.
Drivers Impact Analysis
| Driver | (~) % Impact on CAGR Forecast | Geographic Relevance | Impact Timeline |
|---|---|---|---|
| Protein-led portfolio renewal | +0.8 pp | Italy, France, Germany, Canada, US | Short term (≤ 2 years) |
| Gluten-free dietary crossover | +0.6 pp | US, Canada, UK, Japan, EU | Short term (≤ 2 years) |
| Precooked convenience adoption | +0.6 pp | US, Canada, UK, Western Europe | Short term (≤ 2 years) |
| Egg-free filled-pasta conversion | +0.5 pp | UK, EU, US; urban India | Medium term (2–4 years) |
| Simple-ingredient product recruitment | +0.4 pp | US, Canada, UK, Western Europe | Short term (≤ 2 years) |
Restraint Analysis
Premium-Price Purchase Rejection
Premium legume, protein-enriched and animal-free filled pastas must justify their additional checkout cost against conventional egg-free pasta that already satisfies a vegan ingredient requirement. Consequently, the commercial barrier is not necessarily rejection of vegan food; it is rejection of the incremental nutritional, filling or convenience premium. Current products illustrate this segmentation: Barilla markets protein-enriched pasta alongside conventional formats, while ZENB offers yellow-pea pasta and ACASA sells egg-free, dairy-free filled ravioli.
In an illustrative comparison, a 250-g specialty pack at USD 3.00 costs USD 12/kg versus USD 3/kg for conventional egg-free pasta, a 300% per-kilogram premium. Buying one specialty pack monthly instead of the same weight of the conventional alternative adds USD 27 annually. If 100,000 households reject twelve specialty purchases annually at an assumed USD 2 manufacturer realization, supplier revenue exposure is USD 2.4 million; however, if 80% buy conventional in-scope pasta at USD 0.60 manufacturer realization per equivalent pack, USD 576,000 is retained within the category.
Even the remaining revenue difference is not entirely constant-price market loss: it must be separated into genuine volume reduction and an appropriate quality-mix adjustment. The −0.4 pp deduction assumes 20% revenue exposure grows 2.0 percentage points more slowly through residual purchase rejection and defensible mix deterioration, excluding inflation and counting neither the full premium-brand loss nor ordinary supplier switching as category contraction.
Restraint Impact Analysis
| Restraint | (~) % Impact on CAGR Forecast | Geographic Relevance | Impact Timeline |
|---|---|---|---|
| Premium-price purchase rejection | −0.4 pp | US, Canada, UK, Western Europe | Short term (≤ 2 years) |
| Sensory-driven repeat rejection | −0.3 pp | North America, EU, UK, Japan | Medium term (2–4 years) |
| Allergen-related purchase exclusions | −0.2 pp | UK, EU, US, Canada | Short term (≤ 2 years) |
| Unavailable gluten-free positioning | −0.2 pp | US; US-bound product portfolios | Medium term (2–4 years) |
| Uneconomic incremental listings | −0.2 pp | US, Canada, UK, Western Europe | Short term (≤ 2 years) |
Opportunity Analysis
Qualified School-Meal Contracts
Legume-based vegan pasta could capture additional institutional menu occasions through documented meal-pattern contributions, creating a procurement-led opportunity rather than simply extending retail protein claims into schools. USDA’s current Food Buying Guide states that noodles made from bean or legume flours may contribute toward vegetables or meats/meat alternates, but not both components simultaneously; bean-flour pasta does not automatically satisfy the grains requirement.
Crediting toward meats/meat alternates also requires an appropriate recognizable component under the applicable guidance, so a product formulation statement and program-specific review are necessary rather than assuming that a high-protein label establishes eligibility.
For an entirely vegan offering, any accompanying creditable component must also be animal-free; examples involving meat or cheese cannot simply be adopted unchanged. In an illustrative portfolio of 500 schools serving 400 lunches daily over 180 days, allocating 5% of meals to a newly qualified pasta application produces 1.8 million servings. At an assumed 50-g dry serving and USD 3/kg manufacturer realization, annual demand reaches 90 tonnes and USD 270,000.
If 70% displaces existing in-scope pasta, net category expansion falls to USD 81,000, making contract scale and repeat placements commercially important. The +0.30 pp contribution assumes 6% revenue exposure grows 5.0 percentage points faster through genuinely additional menu occasions or conversion from out-of-scope foods, excluding ordinary school pasta purchases, unearned meal credits and finished-meal revenue.
Opportunity Impact Analysis
| Opportunity | (~) % Potential CAGR Upside | Geographic Relevance | Execution Window |
|---|---|---|---|
| Qualified school-meal contracts | +0.30 pp | US school and childcare procurement | Short term (≤ 2 years) |
| Texture-qualified care products | +0.25 pp | UK, EU, US, Canada, Australia | Medium term (2–4 years) |
| Meal-manufacturer pasta systems | +0.25 pp | US, UK, Germany, Netherlands | Medium term (2–4 years) |
| Upcycled-fibre pasta ranges | +0.20 pp | Germany, Netherlands, Sweden, UK | Medium term (2–4 years) |
| Shared-platform specialty labels | +0.20 pp | US, Canada, UK, Western Europe | Medium term (2–4 years) |
Challenges Analysis
Flour Functionality and Consistency
Replacing or supplementing semolina with pea, lentil, chickpea or other flours changes protein–starch interactions, hydration and dough behavior, requiring lot-specific adjustment rather than assuming that equal protein percentages produce equivalent processing performance.
A January 2025 review explains that conventional wheat pasta relies on a gluten network to retain starch, whereas gluten-free pulse systems depend more heavily on starch transformations and alternative protein structures; it reports markedly different cooking-loss responses across flour blends and processing routes. Those experimental comparisons are not a universal defect rate for vegan pasta, especially because conventional egg-free wheat pasta remains within this market.
In an illustrative facility using 5,000 tonnes of flour annually, an incoming-moisture shift from 12% to 14% reduces dry solids from 4,400 to 4,300 tonnes at unchanged purchasing weight. Maintaining 4,400 tonnes of solids would require approximately 5,116 tonnes of the wetter flour—116 additional tonnes, or about USD 81,400 at an assumed USD 700/tonne. Moisture-adjusted purchasing terms could prevent that economic penalty, but not necessarily eliminate hydration and line-setting adjustments.
Manufacturers need supplier specifications covering moisture, particle size, protein and relevant functional properties, alongside controlled blending and reference dough tests. The −0.25 pp contribution assumes 12.5% revenue exposure grows 2.0 percentage points more slowly through residual input variation, adjustment trials and material inefficiency, excluding cooking losses specifically attributed to extrusion and drying below.
Challenges Impact Analysis
| Challenge | (~) % CAGR Friction Drag | Geographic Relevance | Mitigation Horizon |
|---|---|---|---|
| Flour functionality and consistency | −0.25 pp | EU, North America, India, Japan | Long term (≥ 4 years) |
| Extrusion and drying optimization | −0.30 pp | Italy, Germany, US, Canada, India | Medium term (2–4 years) |
| Shared-line allergen control | −0.25 pp | UK, EU, US, Canadian plants | Medium term (2–4 years) |
| Fresh-format shelf-life control | −0.25 pp | UK, EU, US, urban India | Medium term (2–4 years) |
| Multi-SKU production scheduling | −0.15 pp | North America, UK, Western Europe | Medium term (2–4 years) |
Geopolitical Impact Analysis
Geopolitical Impact of Ongoing Wars on the Wireless Battery Monitoring System Market
The ongoing Russia-Ukraine war and Middle East conflicts are creating supply chain and cost-related challenges for the Wireless Battery Monitoring System Market. Damage to energy infrastructure, trade disruptions, higher transportation costs, and uncertainty in global energy markets are influencing battery manufacturing and energy storage investments. Restrictions on international trade and instability in key shipping routes can also affect the availability of electronic components, wireless communication modules, sensors, and battery materials.
The International Energy Agency reported in its 2026 Global Critical Minerals Outlook that lithium prices more than doubled, while cobalt prices increased by approximately 130% amid supply constraints and export restrictions. These developments can increase costs for battery-related equipment and electronic monitoring components. The IEA also highlighted disruptions to aluminium, sulphur, and helium supplies following the Middle East conflict. For wireless monitoring manufacturers, these pressures may affect component sourcing, production schedules, and equipment pricing. However, geopolitical instability is also encouraging investment in energy security.
The U.S. Energy Information Administration reported that battery storage capacity reached nearly 52 GW by June 2026, supporting continued demand for reliable battery monitoring and protection systems. Overall, ongoing conflicts create short-term supply and cost pressures while strengthening long-term opportunities for wireless monitoring technologies that improve battery safety, remote supervision, and energy infrastructure resilience.
Regional Insights
Dominant region Asia-Pacific – 39.67% share | USD 1.7 billion
Asia-Pacific dominates the Wireless Battery Monitoring System Market, accounting for 39.67% of the market, valued at USD 1.7 billion. The region benefits from its strong battery manufacturing base, electric vehicle production, renewable energy investments, and expanding industrial infrastructure. China, Japan, and South Korea remain important markets due to their established battery manufacturing and automotive industries.
According to the International Energy Agency (IEA), China accounted for approximately 60% of global battery storage additions in 2025. The IEA also reported that China represented more than 80% of global lithium-ion battery manufacturing capacity in 2025. These developments support demand for wireless monitoring solutions across battery production facilities, energy storage installations, and automotive applications. The growing focus on battery safety, operational efficiency, and remote performance monitoring further strengthens regional demand.
North America is witnessing increasing demand for Wireless Battery Monitoring Systems, supported by investments in grid-scale energy storage, data centers, electric vehicles, and industrial backup power infrastructure. The United States remains a major contributor due to its expanding battery storage installations and growing focus on electricity reliability.
According to the U.S. Energy Information Administration (EIA), operational utility-scale battery storage capacity reached 43.6 GW by the end of 2025. During the first six months of 2026, another 8.3 GW was added, taking total capacity to nearly 52 GW. This expansion creates opportunities for wireless monitoring providers offering real-time battery diagnostics, remote supervision, and predictive maintenance solutions.
Key Regions and Countries Insights
- North America
- US
- Canada
- Europe
- Germany
- France
- The UK
- Spain
- Italy
- Rest of Europe
- Asia Pacific
- China
- Japan
- South Korea
- India
- Australia
- Rest of APAC
- Latin America
- Brazil
- Mexico
- Rest of Latin America
- Middle East & Africa
- GCC
- South Africa
- Rest of MEA
Key Players Analysis
ABB Ltd. participates in the battery monitoring ecosystem through its electrification, automation, power management, and digital monitoring technologies. Its solutions support industrial facilities, utilities, and energy infrastructure requiring reliable power management and equipment monitoring. In 2025, ABB reported total revenues of approximately USD 33.2 billion, reflecting its broad industrial presence. Its digital portfolio and investment in electrification technologies position the company to benefit from increasing demand for battery monitoring and energy storage management.
Analog Devices, Inc. is an important technology provider in wireless battery monitoring, particularly through its wireless Battery Management System (wBMS) solutions for electric vehicles. Its technology supports cell-level monitoring, secure wireless communication, and battery health assessment. The company has demonstrated its technology through General Motors vehicle testing involving more than 100 vehicles and hundreds of thousands of kilometres of driving. Its wireless architecture helps reduce battery wiring complexity while supporting battery safety and performance.
BatteryDAQ LLC focuses on battery monitoring solutions for utilities, telecommunications, data centers, and industrial power applications. Founded in 2007, the company has deployed more than 10,000 monitoring units across 20+ countries and 5 continents. Its product portfolio includes Sentry monitoring hardware, the MyBattery cloud platform, and on-premises monitoring software. The company supports battery maintenance, remote diagnostics, and National Electric Reliability Corporation compliance requirements. Its solutions also integrate with DNP3, Modbus, and SNMP communication protocols.
Top Key Players Outlook
- ABB Ltd.
- Analog Devices, Inc.
- BatteryDAQ LLC
- Dukosi Limited
- Eagle Eye Power Solutions LLC
- Eaton Corporation plc
- EnerSys
- Generex Systems GmbH
- HBL Power Systems Limited
- Honeywell International Inc.
- Infineon Technologies AG
- NDSL Group Limited
- Other Key Players
Recent Developments
- In April 2026, Eagle Eye appointed Jason Renner as Senior Director of Product Management, bringing more than 30 years of experience in product development and market strategy to strengthen its battery monitoring, testing, and charging product divisions.
- In 2026, Eaton also invested USD 75 million in SPAN for an approximately 7% stake, supporting smart electrical panels and home energy management. These developments demonstrate Eaton’s focus on improving battery safety, intelligent power control, and integrated battery management technologies.
- In May 2026, EnerSys reported record full-year fiscal 2026 net sales of USD 3.75 billion, representing 4% growth, with operating cash flow of USD 548 million.
Report Scope
| Report Features | Description |
|---|---|
| Market Value (2025) | USD 4.3 Bn |
| Forecast Revenue (2035) | USD 22.0 Bn |
| CAGR (2026-2035) | 17.8% |
| Base Year for Estimation | 2025 |
| Historic Period | 2020-2024 |
| Forecast Period | 2026-2035 |
| Report Coverage | Revenue Forecast, Market Dynamics, Competitive Landscape, Recent Developments |
| Segments Covered | By Component (Hardware, Software, Services), By System Architecture (Centralized Wireless Monitoring Systems, Distributed Wireless Monitoring Systems, Modular Wireless Monitoring Systems, Integrated Wireless Battery Management Systems), By End User (Automotive Manufacturers and Battery Pack Suppliers, Energy Storage System Operators, Telecommunications Operators, Data Center Operators, Industrial and Manufacturing Facilities, Utilities and Renewable Energy Developers, Other End Users) |
| Regional Analysis | North America – US, Canada; Europe – Germany, France, The UK, Spain, Italy, Rest of Europe; Asia Pacific – China, Japan, South Korea, India, Australia, Singapore, Rest of APAC; Latin America – Brazil, Mexico, Rest of Latin America; Middle East & Africa – GCC, South Africa, Rest of MEA |
| Competitive Landscape | ABB Ltd., Analog Devices, Inc., BatteryDAQ LLC, Dukosi Limited, Eagle Eye Power Solutions LLC, Eaton Corporation plc, EnerSys, Generex Systems GmbH, HBL Power Systems Limited, Honeywell International Inc., Infineon Technologies AG, NDSL Group Limited, Other Key Players |
| Customization Scope | Customization for segments, region/country-level will be provided. Moreover, additional customization can be done based on the requirements. |
| Purchase Options | We have three licenses to opt for: Single User License, Multi-User License (Up to 5 Users), Corporate Use License (Unlimited User and Printable PDF) |