


Report Overview
In 2025, the Global On-Device Generative AI Market was valued at USD 6.0 billion. The market is projected to grow at a CAGR of 36.0% during 2026–2035, reaching approximately USD 129.8 billion by 2035. North America dominated the global market in 2025, accounting for more than 37.0% of the total market share and generating approximately USD 2.2 billion in revenue.
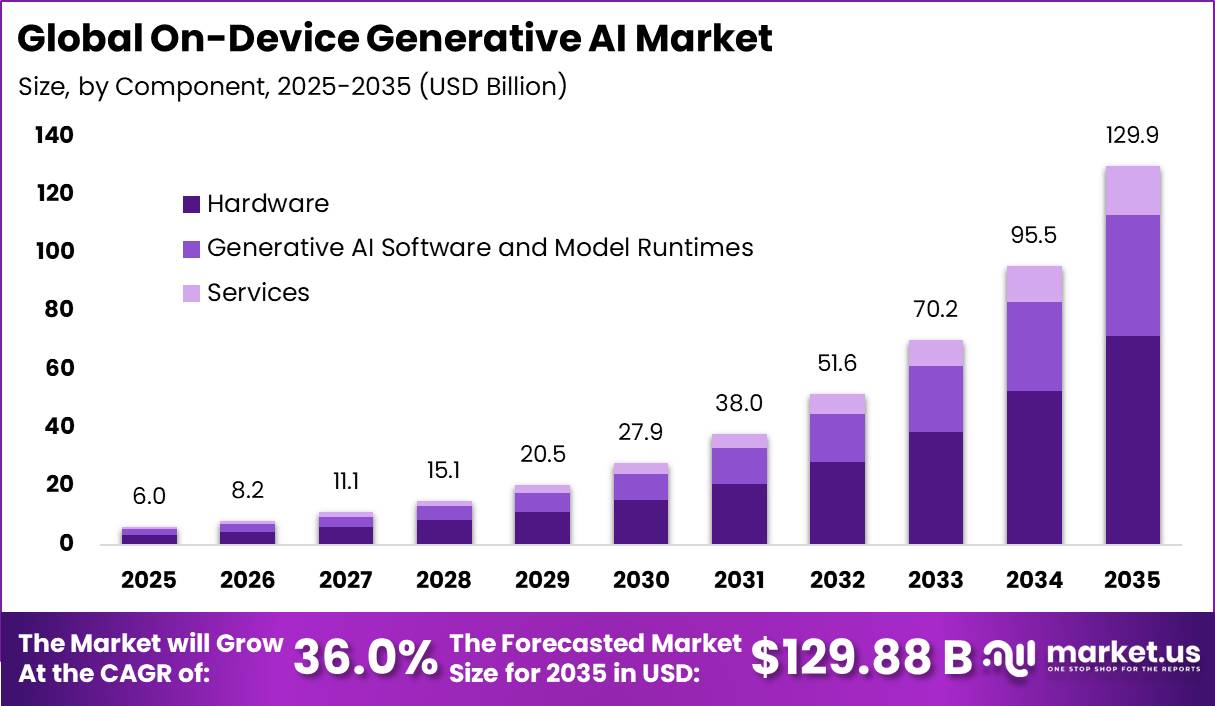
This growth is supported by rapid expansion in semiconductor production and rising demand for AI-enabled mobile devices. According to the Semiconductor Industry Association (SIA), global semiconductor sales reached a record USD 791.7 billion in 2025, increasing 25.6% from USD 630.5 billion in 2024. Logic semiconductor sales, which include many AI processing chips, increased 39.9% to USD 301.9 billion.
SIA also expects global semiconductor sales to exceed USD 1 trillion in 2026, while fourth-quarter 2025 sales increased 37.1% year-on-year to USD 236.6 billion. These investments are strengthening the supply of chips capable of running generative AI directly on devices. Demand is also supported by the large mobile ecosystem. GSMA reported 8.82 billion mobile connections in 2025 and nearly 8 billion unique mobile subscribers globally.
This provides a broad base for smartphones and connected devices using on-device AI for translation, voice assistance, and image editing. These factors support market expansion of more than 20 times over a decade. Americas-based semiconductor sales increased 30.5% in 2025, supporting the region’s strong position in AI chip development and on-device generative AI adoption.
Key Takeaway
- On-Device Generative AI Market valued at USD 6.0 billion in 2025, projected to reach USD 129.8 billion by 2035 at a 36.0% CAGR
- Hardware dominated the market with a 55.2% share in 2025.
- Smartphones and Tablets led the market with a 59.1% share in 2025.
- Small and Compact Language Models captured a leading 43.3% share in 2025.
- Text Modality accounted for a dominant 39.0% share in 2025.
- Hybrid Device-Cloud Deployment dominated deployment models with more than a 60.5% share in 2025.
- AI Assistants and Productivity held a dominant 36.1% share in 2025.
- Consumer Electronics led all end-use segments with a 66.0% share in 2025.
- North America led the market in 2025 with more than 37.0% share and USD 2.2 billion in revenue
Market Statistics and Data Insights
- In 2025, around 6.0 billion people, equal to 74% of the global population, were using the internet. This increased from 5.8 billion and 71% in 2024, meaning more than 240 million people came online within one year. Around 2.2 billion people remained offline.
- ITU estimates that 82% of people aged 10 years and above globally owned a mobile phone in 2025. Ownership reached about 97% in high-income economies, compared with only 53% in low-income economies.
- In 2025, wafer-processing equipment sales increased 12%, semiconductor test-equipment billings surged 55%, and assembly and packaging equipment sales increased 21%. SEMI linked this expansion partly to AI devices, HBM, advanced logic, and advanced packaging.
- Global 5G population coverage reached 55% in 2025, compared with 93% coverage for 4G. The remaining gap supports hybrid AI architectures that can move workloads between devices and cloud infrastructure according to connectivity.
- In 2025, 5G covered approximately 84% of people in high-income economies, compared with just 4% in low-income economies, creating an 80-percentage-point difference.
- ITU reported that 68% of adults in low-income countries without a mobile phone cited device affordability as the main reason for not owning one. Mobile download speeds in low-income economies were also only around 20–30% of levels recorded in high-income economies.
- Logic semiconductor sales, a major category containing processors used for AI computing, increased 39.9% to USD 301.9 billion in 2025. Memory semiconductor sales increased 34.8% to USD 223.1 billion.
- Samsung reported that 51% of respondents believed they did not use AI on their phones, yet 84% said they used common AI-powered functions daily after being shown examples of those features.
- Samsung’s U.S. survey found consumers were using AI through weather alerts at 42%, call screening at 35%, autocorrect at 34%, voice assistants at 26%, and automatic brightness adjustment at 25%.
- TSMC reported actual consolidated capital expenditure of USD 40.90 billion in 2025. Its advanced technologies of 7 nanometers and below represented 74% of total wafer revenue, compared with 69% in 2024.
- By March 2025, Google’s Gemma open-model family had recorded more than 100 million downloads, while developers had created over 60,000 Gemma variants.
By Component
In 2025, the Hardware segment held a dominant market position, capturing more than a 55.2% share of the On-Device Generative AI Market. This leadership is mainly supported by strong investment in AI-capable semiconductor manufacturing and advanced processing technologies. According to SEMI, global semiconductor manufacturing equipment sales reached a record USD 135.1 billion in 2025, rising 15% from USD 117.1 billion in 2024.
Wafer fabrication equipment alone accounted for USD 115.7 billion, showing the scale of investment in advanced logic, memory, and high-performance chip production. TSMC also planned capital expenditure of around USD 40–42 billion in 2025, with nearly 70% directed toward advanced process technologies. These technologies are important for producing Neural Processing Units, AI accelerators, and other specialized chips required for local AI processing.
Hardware therefore remains a critical part of the on-device generative AI ecosystem, as smartphones, laptops, wearables, and other connected devices require dedicated processors, memory, and sensors to run AI models directly. The high cost and strategic importance of these physical components continue to support the Hardware segment’s dominant market position.
| By Component | Segment Shares |
|---|---|
| Hardware | 55.2% |
| Generative AI Software and Model Runtimes | 31.9% |
| Services | 12.9% |
By Device Type
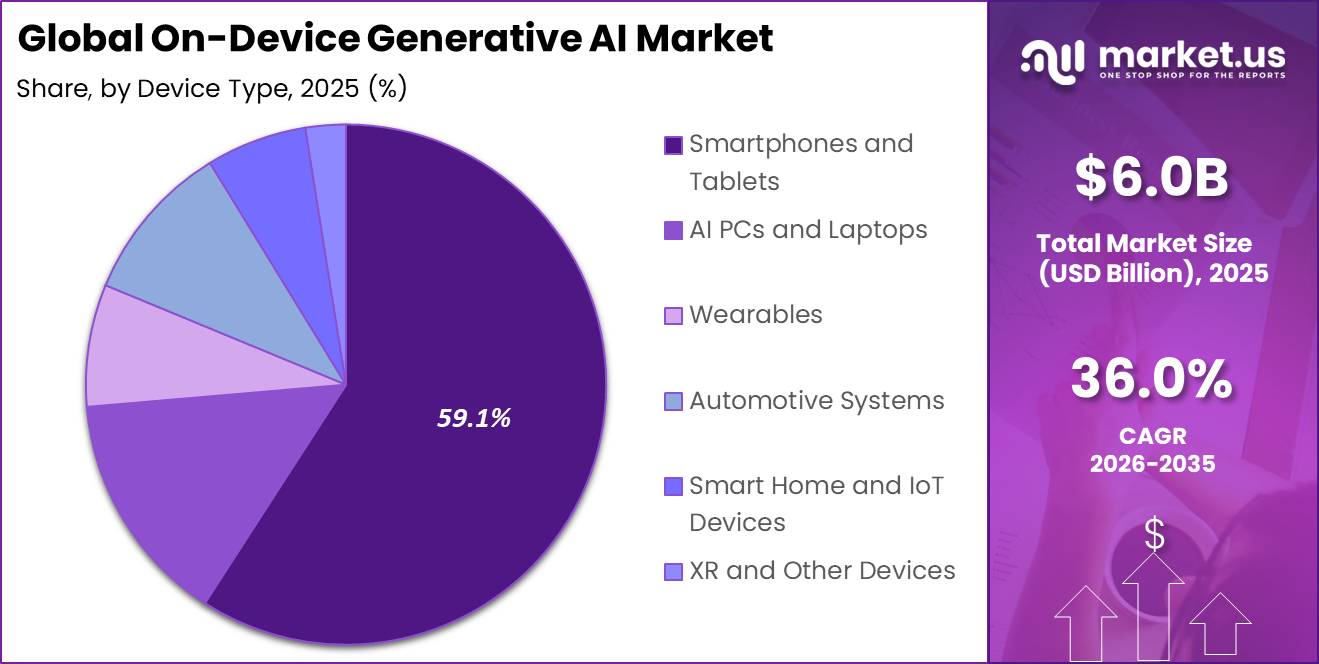
In 2025, the Smartphones and Tablets segment held a dominant market position, capturing more than a 59.1% share of the On-Device Generative AI Market. This strong position is supported by the widespread use of mobile devices as the main personal computing platform for billions of users. According to the International Telecommunication Union (ITU), around 82% of individuals aged 10 and above worldwide own a mobile phone, while ownership exceeds 95% in high-income economies.
| By Device Type | Segment Shares |
|---|---|
| Smartphones and Tablets | 59.1% |
| AI PCs and Laptops | 14.5% |
| Wearables | 7.6% |
| Automotive Systems | 10.0% |
| Smart Home and IoT Devices | 6.3% |
| XR and Other Devices | 2.5% |
In China, CAICT reported that smartphone shipments reached around 285 million units in 2025. More than 90% of these shipments were 5G-enabled models, providing a large installed base of devices capable of supporting advanced AI applications. Smartphones and tablets are well suited for on-device generative AI because they combine cameras, microphones, touchscreens, processors, and continuous connectivity in a single device.
These features support applications such as voice assistants, real-time translation, image enhancement, and personalized content. The large existing device base also allows manufacturers to introduce new AI functions through software updates, supporting the continued dominance of smartphones and tablets in on-device AI deployment.
By Model Type
In 2025, the Small and Compact Language Models segment held a dominant market position, capturing more than a 43.3% share of the On-Device Generative AI Market. This leadership is supported by growing demand for energy-efficient AI models that can operate directly on smartphones and other devices.
According to the International Energy Agency (IEA), electricity consumption from AI-focused data centres increased by around 50% in 2025, compared with nearly 3% growth in total global electricity demand. AI-related data-centre electricity consumption is also expected to triple by 2030. The IEA noted that a single large AI data centre can consume as much electricity as around 100,000 households, while some new facilities may require up to 20 times more power.
These energy requirements are encouraging developers to move suitable AI workloads from cloud infrastructure to local devices. Hardware improvements are also supporting this shift. Counterpoint reported that average smartphone DRAM reached a record 8.4 GB in December 2025, compared with 7.4 GB a year earlier. Higher device memory allows compact language models to process more AI tasks locally, supporting faster responses, lower cloud dependence, and improved efficiency.
| By Model Type | Segment Shares |
|---|---|
| Small and Compact Language Models | 43.3% |
| Small Multimodal Models | 18.4% |
| Compact Vision and Diffusion Models | 15.1% |
| Specialized/Domain Models | 13.1% |
| Other Models | 10.1% |
By Modality
In 2025, the Text Modality segment held a dominant market position, capturing more than a 39.0% share of the On-Device Generative AI Market. This leadership is mainly supported by the wide use of text across search, messaging, chat, and other digital applications. According to the International Telecommunication Union (ITU), around 6.0 billion people were using the internet globally in 2025, creating a large user base for text-based AI tools across both developed and developing economies.
Literacy levels also strengthen the adoption of text-based generative AI. UNESCO reported that the global adult literacy rate reached around 88% in 2024, increasing from 86% in 2016. This allows a growing share of users to interact with AI-generated text and digital services.
Text generation also requires lower computing power, memory, and battery capacity compared with image, voice, or video generation. As nearly three-quarters of the global population is now online, text remains one of the most practical and accessible formats for running generative AI directly on smartphones and other connected devices.
| By Modality | Segment Shares |
|---|---|
| Text | 39.0% |
| Image | 15.9% |
| Audio and Speech | 12.9% |
| Video | 11.1% |
| Multimodal | 21.1% |
By Deployment Model
In 2025, the Hybrid Device-Cloud Deployment segment held a dominant market position, capturing more than a 60.5% share of the On-Device Generative AI Market. This leadership is supported by differences in network quality and device computing capacity across regions. According to the International Telecommunication Union (ITU), 5G covered around 55% of the global population in 2025. However, coverage reached only 4% in low-income countries, compared with 84% in high-income economies.
This uneven network availability makes hybrid deployment a practical option for device manufacturers. Basic AI tasks can be processed directly on the device, while more complex workloads can be transferred to cloud infrastructure when strong connectivity is available. GSMA Intelligence reported that global 5G connections exceeded 2.7 billion by the end of 2025, compared with around 8.82 billion total mobile connections worldwide.
This large gap shows that many devices still cannot depend entirely on high-speed cloud connectivity. Hybrid deployment therefore provides a balanced approach by combining local processing with cloud computing, helping improve performance, privacy, reliability, and cost efficiency while global 5G infrastructure continues to expand.
| By Deployment Model | Segment Shares |
|---|---|
| Fully On-Device/Local | 39.5% |
| Hybrid Device-Cloud | 60.5% |
By Application
In 2025, the AI Assistants and Productivity segment held a dominant market position, capturing more than a 36.1% share of the On-Device Generative AI Market. This leadership is supported by growing business demand for tools that can improve employee productivity and reduce time spent on routine digital tasks.
According to the U.S. Bureau of Labor Statistics (BLS), labor productivity among software publishers increased by 12.9% in 2025, representing one of the strongest gains across measured service industries. In comparison, productivity across the overall private nonfarm business sector increased by 2.2%. This large difference highlights the productivity benefits associated with software-driven and technology-intensive work environments.
On-device AI assistants can support writing, document summarization, scheduling, email management, search, and information retrieval directly from laptops, smartphones, and other devices. Local processing can also reduce response delays and improve access to frequently used productivity functions without depending entirely on cloud infrastructure.
| By Application | Segment Shares |
|---|---|
| AI Assistants and Productivity | 36.1% |
| Content Creation and Editing | 17.3% |
| Search and Summarization | 14.0% |
| Translation and Communication | 10.0% |
| Coding and Development | 9.5% |
| Personalized Recommendations | 8.1% |
| Other Applications | 5.0% |
By End Use
In 2025, the Consumer Electronics segment held a dominant market position, capturing more than a 66.0% share of the On-Device Generative AI Market. This leadership is supported by the large production and shipment volume of smartphones, tablets, laptops, and other connected devices that provide the hardware platform for on-device AI. According to China’s General Administration of Customs, the country exported around 68.3 million mobile phone units in December 2025.
China’s broader high-tech exports reached approximately 5.25 trillion yuan in 2025, increasing by 13.2%. Strong consumer spending on digital products also supports regular device upgrades. The U.S. Census Bureau reported that retail e-commerce sales reached around USD 340.2 billion in Q2 2026, reflecting continued demand through online retail channels.
Consumer electronics bring together processors, memory, batteries, cameras, displays, and sensors required for generative AI applications. As manufacturers increasingly integrate AI-capable chips into new devices, regular replacement cycles expand the installed base of AI-ready hardware, supporting the Consumer Electronics segment’s dominant position in the market.
| By End Use | Segment Shares |
|---|---|
| Consumer Electronics | 66.0% |
| Enterprises | 9.9% |
| Automotive | 8.1% |
| Healthcare and Life Sciences | 5.5% |
| Retail and E-commerce | 4.3% |
| Industrial and Manufacturing | 4.1% |
| Other End Uses | 2.1% |
Key Market Segments
By Component
- Hardware
- Generative AI Software and Model Runtimes
- Services
By Device Type
- Smartphones and Tablets
- AI PCs and Laptops
- Wearables
- Automotive Systems
- Smart Home and IoT Devices
- XR and Other Devices
By Model Type
- Small and Compact Language Models
- Small Multimodal Models
- Compact Vision and Diffusion Models
- Specialized/Domain Models
- Other Models
By Modality
- Text
- Image
- Audio and Speech
- Video
- Multimodal
By Deployment Model
- Fully On-Device/Local
- Hybrid Device-Cloud
By Application
- AI Assistants and Productivity
- Content Creation and Editing
- Search and Summarization
- Translation and Communication
- Coding and Development
- Personalized Recommendations
- Other Applications
By End Use
- Consumer Electronics
- Enterprises
- Automotive
- Healthcare and Life Sciences
- Retail and E-commerce
- Industrial and Manufacturing
- Other End Uses
Geopolitical Impact Analysis
Geopolitical tensions are increasing supply-chain risks and production costs across the On-Device Generative AI Market. The U.S.–China trade dispute has placed additional pressure on semiconductor and consumer electronics supply chains. The U.S. applies a 10% global tariff on covered imports, while country-specific reciprocal tariffs range from 10% to 41%.
Temporary U.S.–China tariff rates introduced in April 2025 reached 125% before being reduced to 10% through November 10, 2026, although several other duties remain in place. These tariffs can increase the landed cost of AI smartphones, tablets, laptops, neural processing units, memory chips, sensors, and printed circuit boards.
Manufacturers are therefore diversifying suppliers, maintaining larger inventories, and shifting production across Asian manufacturing locations, which can increase logistics and working-capital expenses. Global shipping disruptions are creating additional challenges. According to UNCTAD, Suez Canal tonnage transit remained around 70% below its 2023 average as of May 2025, as vessels continued avoiding the Red Sea and using longer routes around the Cape of Good Hope.
These diversions can delay semiconductor wafers, packaging materials, displays, batteries, and finished AI devices while increasing freight, insurance, and inventory costs. Energy prices also remain an important risk for semiconductor production. The World Bank expects its energy-price index to increase by 24% year-on-year in 2026 following lower Middle East energy exports.
Regional Analysis
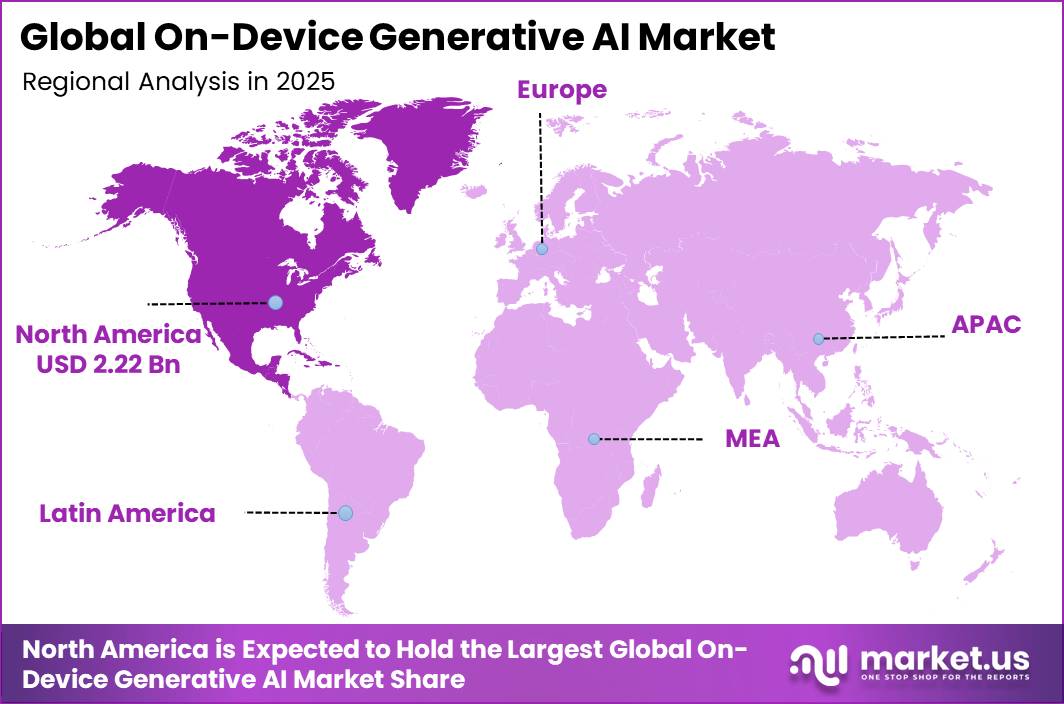
In 2025, North America held a dominant position in the On-Device Generative AI Market, capturing more than a 37.0% share and generating approximately USD 2.2 billion in revenue. The region benefits from a strong presence of AI developers, semiconductor companies, cloud providers, consumer electronics brands, and enterprise software users.
| By Region | Region Shares |
|---|---|
| North America | 37.0% |
| Europe | 21.5% |
| Asia Pacific | 26.9% |
| Latin America | 7.5% |
| Middle East and Africa | 7.1% |
According to the U.S. Census Bureau, around 17%–20% of U.S. businesses used AI between December 2025 and May 2026, while another 20%–23% expected to adopt AI within the following six months. When measured by employment, AI adoption reached approximately 32%, indicating stronger usage among larger organizations. This supports demand for AI-ready smartphones, laptops, tablets, and edge devices used for productivity and generative AI applications.
Asia Pacific accounted for an estimated 26.9% share in 2025 and is expected to record strong growth due to its large electronics and semiconductor manufacturing base. China, India, Japan, South Korea, and Southeast Asia represent major device production and consumption markets. Government investment is also strengthening regional capabilities.
South Korea’s Ministry of Science and ICT allocated around KRW 1 trillion for AI research and development in 2025. Support for AI-semiconductor demonstrations increased from KRW 18.8 billion in 2024 to KRW 24.4 billion in 2025. Large manufacturing capacity, expanding 5G networks, and increasing demand for AI-enabled consumer electronics are expected to support Asia Pacific’s rapid market expansion.
Key Regions and Countries
North America
- US
- Canada
Europe
- Germany
- France
- The UK
- Spain
- Italy
- Rest of Europe
Asia Pacific
- China
- Japan
- South Korea
- India
- Australia
- Rest of APAC
Latin America
- Brazil
- Mexico
- Rest of Latin America
Middle East & Africa
- GCC
- South Africa
- Rest of MEA
Market Dynamics
Drivers
| Driver | (~) % CAGR | Geographic Relevance | Impact Timeline |
|---|---|---|---|
| AI-ready device refresh | +5.2% | Global | Short term (2 years or less) |
| Local privacy processing | +3.8% | North America and Europe | Short term (2 years or less) |
| Enterprise endpoint automation | +3.1% | North America and Asia Pacific | Medium term (2 to 4 years) |
| Compact model optimization | +2.7% | Global | Medium term (2 to 4 years) |
| Offline language access | +1.9% | Asia Pacific, Latin America and Africa | Long term (4 years or more) |
AI-ready device refresh
AI-ready device replacement is a major growth driver as generative AI becomes a built-in feature of smartphones, tablets, PCs, and connected devices. The ITU reported 6.0 billion internet users in 2025, while U.S. Census Bureau data showed business AI adoption at around 17% to 20% between December 2025 and May 2026.
The Semiconductor Industry Association reported global semiconductor sales of USD 791.7 billion in 2025. As device upgrades add neural processors, higher memory, and local AI software, manufacturers can increase device value and offer premium AI features. This replacement cycle could contribute around +5.2% to the market’s 36.0% baseline CAGR.
Restraints
| Restraint | (~) % CAGR | Geographic Relevance | Impact Timeline |
|---|---|---|---|
| Advanced-chip export controls | -3.6% | United States, China and allied manufacturing hubs | Short term (2 years or less) |
| Premium-device affordability gap | -2.8% | Emerging markets | Medium term (2 to 4 years) |
| Model compliance obligations | -2.3% | European Union | Short term (2 years or less) |
| Memory supply cost pressure | -1.8% | Global | Medium term (2 to 4 years) |
| Restricted application categories | -1.4% | Europe and North America | Long term (4 years or more) |
Advanced-chip export controls
Advanced-chip export controls are a major restraint because on-device generative AI depends on advanced logic chips, high-bandwidth memory, packaging, and AI development infrastructure. The U.S. Bureau of Industry and Security introduced a global licensing framework on January 13, 2025, with many requirements effective from May 15, 2025, and additional security rules from January 2026.
Restrictions affecting China, Hong Kong, Macau, and certain embargoed destinations can delay chip access and increase procurement costs. EU general-purpose AI model obligations also became applicable on August 2, 2025, adding compliance expenses. Together, these pressures could reduce the market’s 36.0% baseline CAGR by an estimated -3.6% through slower product launches and weaker margins.
Challenges
| Challenge | (~) % CAGR | Geographic Relevance | Mitigation Horizon |
|---|---|---|---|
| Power and thermal limits | -3.2% | Global | Medium term (2 to 4 years) |
| Model quality trade-offs | -2.7% | Global | Medium term (2 to 4 years) |
| Fragmented device software | -2.1% | Global | Long term (4 years or more) |
| Edge security management | -1.9% | North America and Europe | Medium term (2 to 4 years) |
| Specialist talent constraints | -1.5% | Global | Long term (4 years or more) |
Power and thermal limits
Power and thermal limits remain a major challenge for on-device generative AI because models must operate within strict battery, memory, heat, and energy limits. The IEA projects data-centre electricity use to rise from about 485 TWh in 2025 to around 950 TWh by 2030, increasing pressure for more efficient local AI processing.
The ITU reported that 2.2 billion people remained offline in 2025, strengthening the need for reliable offline inference. EU AI Act requirements for general-purpose models have also applied since August 2025. Vendors must improve model efficiency, memory use, cooling, and battery performance, as overheating and shorter battery life could create an estimated -3.2% drag on maximum market growth.
Opportunities
| Opportunity | (~) % CAGR | Geographic Relevance | Execution Window |
|---|---|---|---|
| Industrial edge copilots | +4.6% | North America, Europe and Asia Pacific | Medium term (2 to 4 years) |
| Automotive in-cabin intelligence | +3.9% | China, Europe, Japan and North America | Medium term (2 to 4 years) |
| Healthcare workflow endpoints | +3.2% | North America and Europe | Long term (4 years or more) |
| Telecom edge monetization | +2.6% | Asia Pacific and Middle East | Medium term (2 to 4 years) |
| Localized language models | +2.2% | India, Africa, Latin America and Southeast Asia | Long term (4 years or more) |
Industrial edge copilots
Industrial edge copilots represent a strong growth opportunity as on-device generative AI expands beyond consumer electronics into factories, warehouses, field services, and industrial equipment. The International Federation of Robotics reported around 542,000 industrial robots installed globally in 2024.
The IEA expects global data-centre electricity demand to approach 950 TWh by 2030, strengthening the case for shifting suitable AI workloads to edge devices. This opportunity remains at an early stage because industrial deployment requires specialized model training, system integration, safety testing, and industry partnerships.
Local processing could reduce cloud-inference transactions by an estimated 30% to 60% for routine industrial tasks, lowering operating costs and improving response times. Wider adoption of industrial edge copilots could therefore provide up to +4.6% potential upside to the baseline market CAGR.
Key Players Analysis
The On-Device Generative AI Market is led by Tier-1 companies including Apple, Google, Qualcomm, Samsung, Microsoft, and NVIDIA, which together are estimated to control around 75%–85% of addressable market value. Their strength comes from control over operating systems, AI models, chip platforms, cloud infrastructure, and developer ecosystems.
Apple reported USD 416.2 billion in fiscal 2025 net sales and USD 34.5 billion in R&D spending, equal to about 8% of revenue. Qualcomm generated USD 37.7 billion from its Qualcomm CDMA Technologies business and invested USD 9.04 billion, or 20% of revenue, in R&D and USD 1.2 billion in capital expenditure. Samsung recorded KRW 333.6 trillion in revenue and spent KRW 37.8 trillion on R&D.
Alphabet generated USD 402.8 billion in 2025 revenue, spent USD 61.09 billion on R&D, and invested USD 91.4 billion in technical infrastructure. Microsoft reported USD 168.9 billion in cloud revenue and spent USD 32.49 billion, or 12% of revenue, on R&D. NVIDIA generated USD 215.9 billion in fiscal 2026 revenue, up 65%, while R&D spending increased 43% to USD 18.5 billion.
Tier-2 companies, including Modular, Nexa AI, VinAI, MovianAI, and Edge Impulse, are estimated to hold a combined 5%–10% share. These companies compete through specialized solutions for model compression, private on-device inference, embedded AI development, automotive intelligence, and industrial edge applications.
Top Key Players in the Market
- Apple
- Microsoft
- Qualcomm
- Samsung
- NVIDIA
- Modular
- Nexa AI
- VinAI
- MovianAI
- Edge Impulse
Recent Developments
- In 2025, Google launched the Pixel 10 series with its Tensor G5 processor and the latest Gemini Nano model. Google reported that the model operates 2.6 times faster and 2 times more efficiently for applications such as Pixel Screenshots and Recorder. The processor also provides a TPU that is up to 60% more powerful and a 34% faster CPU.
- In 2025, Samsung launched the Galaxy S25, Galaxy S25+, and Galaxy S25 Ultra with the customized Snapdragon 8 Elite Mobile Platform for Galaxy. Compared with the previous generation, the Galaxy S25 platform delivered a 40% improvement in NPU performance, 37% improvement in CPU performance, and 30% improvement in GPU performance.
Report Scope
| Report Features | Description |
|---|---|
| Market Value (2025) | USD 6.0 Billion |
| Forecast Revenue (2035) | USD 129.8 Billion |
| CAGR (2026-2035) | 36.0% |
| Base Year for Estimation | 2025 |
| Historic Period | 2020-2024 |
| Forecast Period | 2026-2035 |
| Report Coverage | Revenue Forecast, Market Dynamics, Competitive Landscape, Recent Developments |
| Segments Covered | By Component (Hardware, Generative AI Software and Model Runtimes, Services); By Device Type (Smartphones and Tablets, AI PCs and Laptops, Wearables, Automotive Systems, Smart Home and IoT Devices, XR and Other Devices); By Model Type (Small and Compact Language Models, Small Multimodal Models, Compact Vision and Diffusion Models, Specialized/Domain Models, Other Models); By Modality (Text, Image, Audio and Speech, Video, Multimodal); By Deployment Model (Fully On-Device/Local, Hybrid Device-Cloud); By Application (AI Assistants and Productivity, Content Creation and Editing, Search and Summarization, Translation and Communication, Coding and Development, Personalized Recommendations, Other Applications); By End Use (Consumer Electronics, Enterprises, Automotive, Healthcare and Life Sciences, Retail and E-commerce, Industrial and Manufacturing, Other End Uses) |
| Regional Analysis | North America – US, Canada; Europe – Germany, France, The UK, Spain, Italy, Rest of Europe; Asia Pacific – China, Japan, South Korea, India, Australia, Singapore, Rest of APAC; Latin America – Brazil, Mexico, Rest of Latin America; Middle East & Africa – GCC, South Africa, Rest of MEA |
| Competitive Landscape | Google, Apple, Microsoft, Qualcomm, Samsung, NVIDIA, Modular, Nexa AI, VinAI, MovianAI, Edge Impulse |
| Customization Scope | Customization for segments, region/country-level will be provided. Moreover, additional customization can be done based on the requirements. |
| Purchase Options | We have three licenses to opt for: Single User License, Multi-User License (Up to 5 Users), Corporate Use License (Unlimited Users and Printable PDF) |





























