


Report Overview
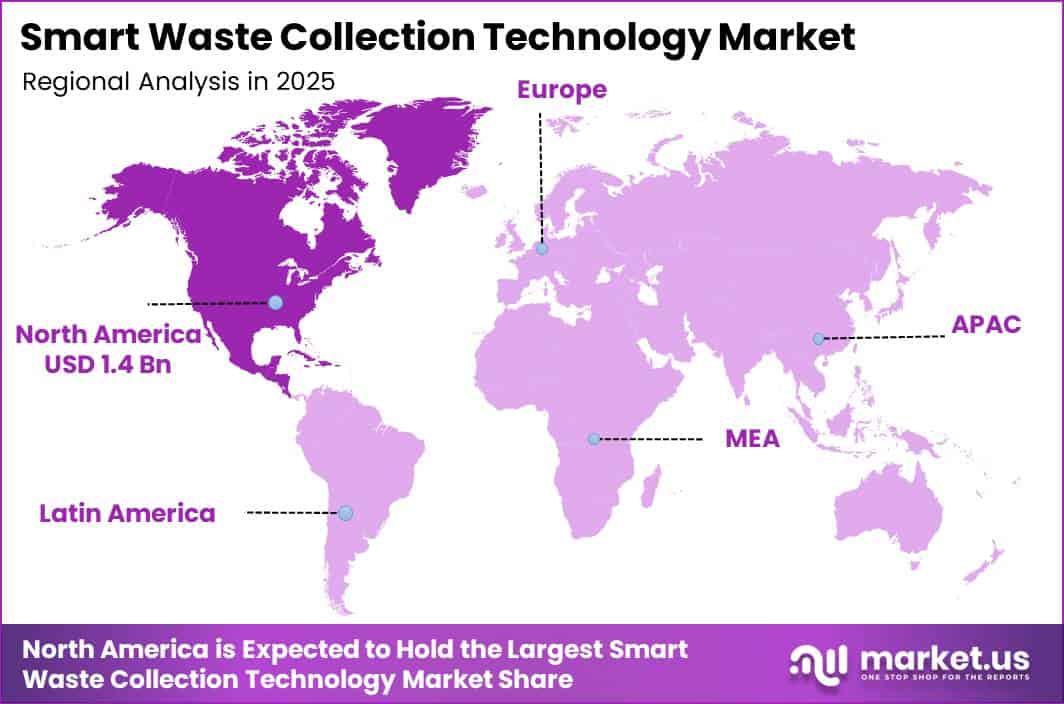
In 2025, the Global Smart Waste Collection Technology Market was valued at USD 3.4 billion. The market is projected to grow at a CAGR of 16.8% during 2026–2035, reaching approximately USD 16.1 billion by 2035. North America dominated the global market in 2025, accounting for more than 42.4% of the total market share and generating approximately USD 1.4 billion in revenue.
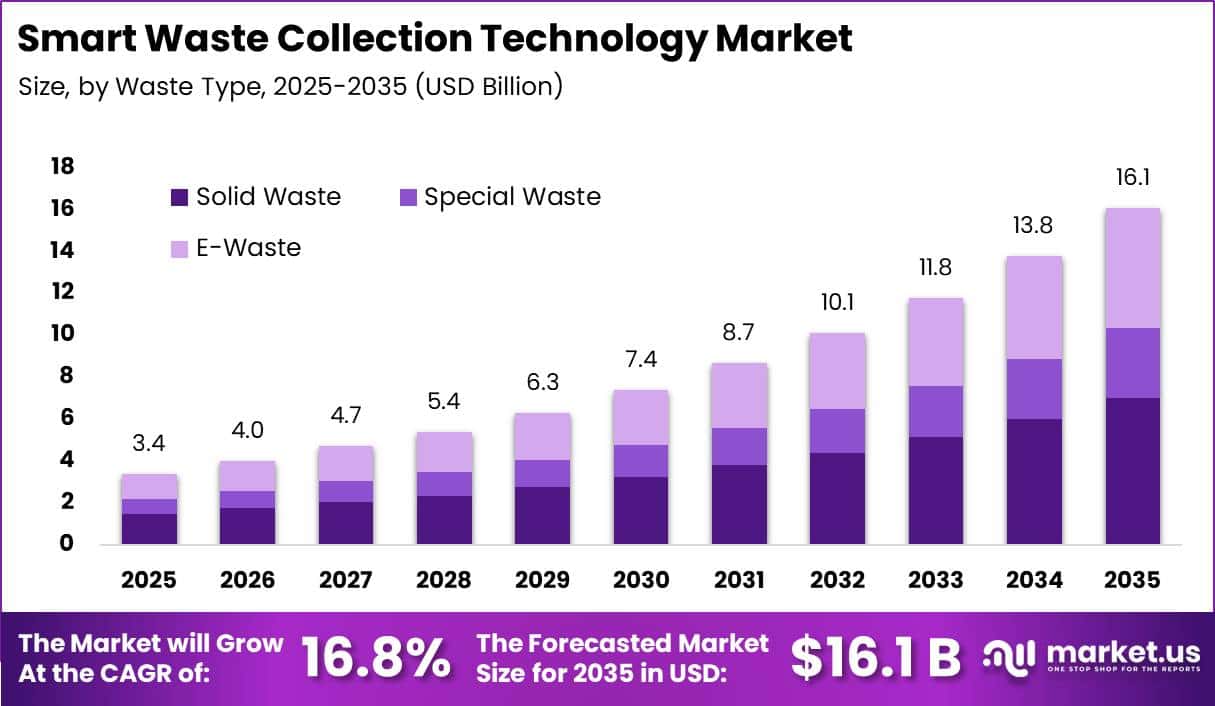
This growth is mainly supported by rising waste volumes, stricter environmental rules, and the need to reduce collection costs. According to the World Bank, global municipal solid waste reached nearly 2.5 billion tonnes in 2022 and may increase by around 50% to 3.8 billion tonnes by 2050.
Annual waste management costs could also rise from about USD 250 billion to more than USD 426 billion by 2050. These pressures are encouraging cities and waste operators to use sensor-enabled bins, route optimization, real-time monitoring, and connected collection vehicles to improve efficiency and reduce fuel use.
North America accounted for the largest share of market revenue, making it the leading regional market. The region benefits from advanced waste collection systems and strong investment in smart city technologies. High-income regions collect nearly 100% of municipal waste, compared with only around 28% in low-income countries.
This allows North American municipalities to focus on improving existing operations through fill-level sensors, predictive maintenance, fleet tracking, and data analytics. UNEP and the World Bank estimate that municipal waste volumes may rise from approximately 2.1 billion tonnes in 2023 to 3.8 billion tonnes by 2050. This increase will create greater demand for automated routing, digital compliance tools, and intelligent waste collection systems.
Key Takeaway
- The Smart Waste Collection Technology Market is valued at USD 3.4 billion in 2025, projected to reach USD 16.1 billion by 2035 at a CAGR of 16.8%.
- The solid waste segment led the market by waste type with a 43.5% share.
- The smart collection segment led the market by method with a 38.6% share.
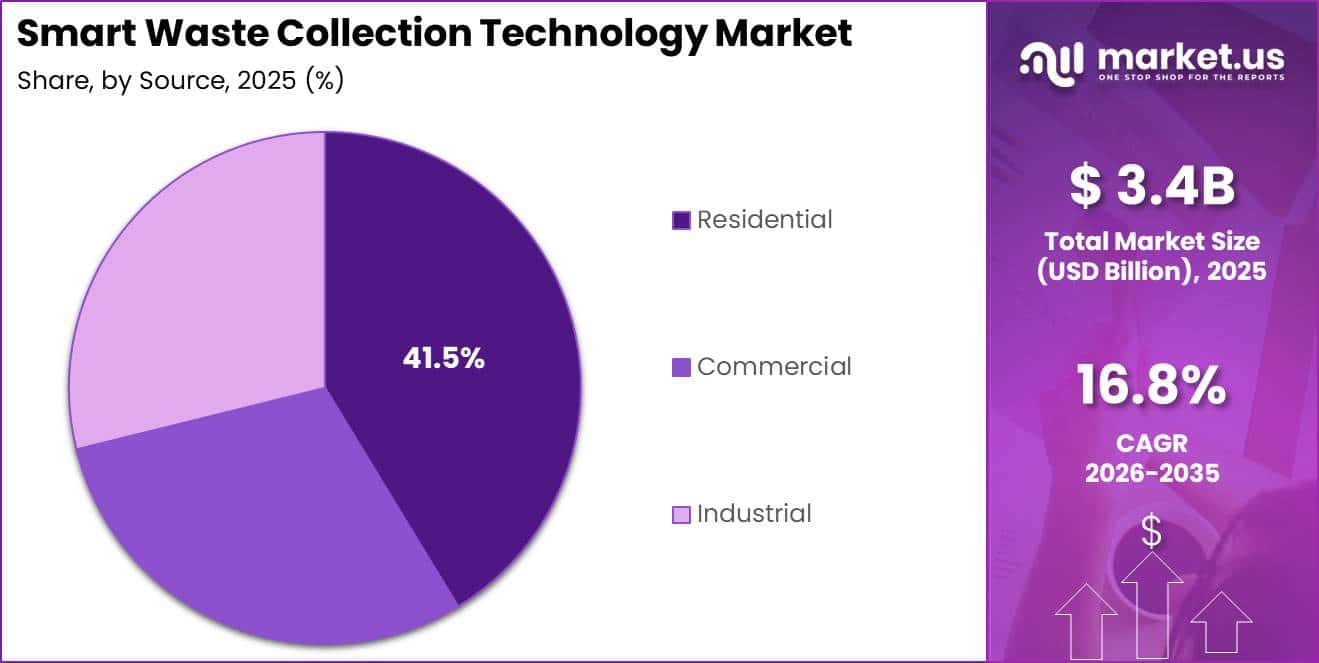
- The residential segment led the market by source with a 41.5% share.
- North America led the market with a 42.4% share and approximately USD 1.4 billion in revenue in 2025.
Market Statistics and Data Insights
- The World Bank reports that global municipal waste reached 2.5 billion tonnes in 2022, earlier than previously expected. Under its business-as-usual scenario, waste volumes could increase by 50% to 3.8 billion tonnes by 2050, increasing the number of bins, collection stops, vehicle trips, and transfer operations requiring digital management.
- The World Bank estimates that municipal waste management already costs more than USD 250 billion annually and could reach USD 426 billion by 2050. UNEP separately estimates that direct waste-management costs were USD 252 billion in 2020, rising to USD 361 billion after including health, climate, and pollution damage. Without action, the total annual cost could reach USD 640.3 billion by 2050.
- UN DESA projects the global urban population to increase from approximately 4.4 billion to 6.7 billion by 2050. OECD countries alone generated more than 770 million tonnes of municipal waste in 2023, equal to an average of 552 kg per person, demonstrating the collection intensity that develops as cities and household consumption expand.
- An EU-supported smart-city project in Herning, Denmark, recorded 71% annual savings in glass-container collection costs after implementing dynamic waste collection. The results supported expansion across all 412 bins in the programme. A separate Philadelphia deployment reported an 82% reduction in average weekly collections, from 17 to 3, generating approximately USD 650,000 in annual operating savings. The Philadelphia figures are company-reported.
- Municipal waste collection coverage is as low as 31% in Sub-Saharan Africa. The World Bank estimates that low- and lower-middle-income countries require approximately USD 556 billion in waste-management investment between 2022 and 2050. Smart fleet tracking, service-verification systems, and connected communal containers can be introduced alongside the expansion of basic collection infrastructure.
- Edinburgh has installed approximately 11,000 smart sensors in communal and public litter bins. The broader smart-city programme included three projects with a combined budget of GBP 6.4 million, including GBP 2.5 million in European Regional Development Fund support. In St Andrews, 30 smart bins replaced 70 conventional units during a trial, with each compactor holding up to 6 times the volume of a standard bin.
- Prague has deployed 3,294 ultrasonic fill-level sensors in underground waste containers. The company-reported case indicates that average container fill levels at collection increased from 45% in 2018 to 71% in 2024, with estimated potential annual savings of approximately USD 513,864.
- Republic Services operates approximately 17,000 trucks, serves 13 million customers, and manages more than 1,000 locations across North America. Its RISE platform digitally connects customers, drivers, logistics analysts, supervisors, and trucks, illustrating the industry’s shift toward real-time routing, in-cab technology, service verification, and integrated fleet data.
- The European Environment Agency reports that around 66% of Europeans support reducing waste by correctly sorting materials for recycling. The 2024 Eurobarometer also found that almost 6 in 10 respondents were willing to pay more for sustainable, recyclable, or repairable products.
- Washington, D.C.’s food-waste smart bins collected nearly 50,000 pounds of material during May 2025 and almost 120,000 pounds between their late-February installation and the end of May.
- A peer-reviewed WM study published in January 2026 found that optimized industrial waste collection routes improved efficiency by 10.3% in operating hours per haul and 11.6% in miles per haul compared with manually sequenced routes. Manual routes also violated customer time windows in more than 11% of cases and maximum route-time limits in more than 28% of cases.
By Waste Type
The Solid waste segment held a dominant position in the smart waste collection technology market, accounting for a 43.5% share. Its leadership is mainly linked to the large volume of solid waste collected and processed by cities and municipalities. According to the World Bank’s “What a Waste” study, global municipal solid waste reached nearly 2.01 billion tonnes in 2016 and is projected to increase to 3.4 billion tonnes by 2050.
Food waste, green waste, paper, plastics, metals, and glass together represent more than 80% of the total waste handled by urban collection systems. These materials require frequent collection to prevent overflowing bins, unpleasant odours, and public health concerns. As a result, solid waste operations involve a high number of collection trips, truck routes, bin lifts, and labour hours.
Smart technologies, including fill-level sensors, truck-mounted weight sensors, fleet tracking, and route optimisation software, help reduce fuel consumption, overtime costs, and service delays. High-income and upper-middle-income countries together generate around 71% of global municipal solid waste, while waste generation in high-income economies reaches approximately 1.6 kg per person per day.
By Method
The Smart collection method held a dominant position in the market, accounting for a 38.6% share. Its leadership is mainly supported by its ability to reduce the high fuel and operating costs associated with fixed-route waste collection. According to the World Bank and UNEP, municipal solid waste volumes are expected to increase from approximately 2.3–2.6 billion tonnes at present to nearly 3.8–3.9 billion tonnes by 2050.
This growth will increase the number of container lifts, collection trips, and truck kilometres, making traditional schedule-based collection less cost-effective. Smart collection systems use IoT fill-level sensors, GPS tracking, and dynamic route optimisation to ensure that vehicles visit only those bins that require emptying.
Operational studies indicate that demand-based collection can reduce unnecessary trips by 30–50%, lower bin-emptying effort by up to 80%, and decrease fuel consumption and driver working hours while maintaining service quality. These savings improve fleet utilisation, reduce labour expenses, and help waste service providers manage larger waste volumes more efficiently.
By Source
The Residential segment held a dominant position in the smart waste collection technology market, accounting for a 41.5% share. Its leadership is mainly supported by the large amount of waste generated by households and the need for frequent and reliable collection services.
According to UNEP, global municipal solid waste is projected to increase from approximately 2.3 billion tonnes in 2023 to 3.8 billion tonnes by 2050, largely due to urban population growth and higher household consumption.
The World Bank’s What a Waste 3.0 analysis indicates that urban residents generate well above 1 kg of waste per person per day, with volumes rising as incomes increase and the use of packaged goods, e-commerce deliveries, and prepared food expands. Residential areas contain millions of collection points, including curbside bins, communal containers, and apartment waste chutes.
Key Market Segments
By Waste Type
- Solid Waste
- Special Waste
- E-Waste
By Method
- Smart Collection
- Smart Processing
- Smart Disposal
By Source
- Residential
- Commercial
- Industrial
Geopolitical Impact Analysis
Global geopolitical tensions are creating higher costs and longer delivery times for smart waste collection hardware, which depends heavily on imported electronics, communication modules, sensors, and metal components. The Red Sea crisis has redirected around 25–30% of global container volumes away from the Suez Canal, reducing effective shipping capacity on major Asia–Europe routes by approximately 10–15% and extending delivery times by 10–14 days.
Freight rates from Asia to Northern Europe have more than doubled to above USD 4,000 per 40-foot container, while Asia–Mediterranean rates have increased to nearly USD 5,175 per container. Shipping companies are also applying emergency surcharges of around USD 500–2,700 per container.
For shipments of IoT sensors, gateway devices, and smart bin components from East Asia, additional freight costs may reach USD 800–1,500, along with nearly USD 300–500 in extra insurance expenses per container. A mid-sized smart waste technology manufacturer shipping 30 containers per year to the U.S. East Coast could therefore face approximately USD 33,000–60,000 in additional yearly logistics costs.
Global transit times on Asia–North America routes remain around 28% longer than 2019 levels, while Asia–Europe freight rates are estimated to be 25–40% higher because of the crisis. These disruptions can delay sensor and equipment deliveries by 2–3 weeks, increase inventory requirements, and raise working capital needs.
Fuel market volatility since 2022, combined with tariffs, double-digit freight increases, and higher insurance costs, is also raising the landed cost of smart bins, telematics units, and control systems. As a result, companies are increasingly diversifying suppliers and expanding regional assembly operations.
Regional Analysis
North America held a dominant position in the global smart waste collection technology market, accounting for a 42.4% share and generating approximately USD 1.4 billion in revenue. The region’s leadership is supported by developed municipal waste infrastructure, high urbanisation, and strong spending on digital public services. The United States managed more than 292 million tonnes of municipal solid waste in 2018, equal to around 4.9 kg per person per day.
Asia Pacific is the fastest-growing region in the smart waste collection technology market, supported by rapid urban development and expanding smart city programmes. World Bank and United Nations data indicate that the urban population across East and South Asia could increase by more than 1.2 billion between 2000 and 2050. Municipal solid waste generation in several major cities has already reached more than 1–1.5 kg per person per day.
These growing and complex waste streams are difficult to manage through manual and fixed-route collection methods. The expansion of IoT networks, 4G/5G connectivity, and digital public service platforms across China, India, and Southeast Asia is supporting the adoption of smart waste systems and driving double-digit annual growth.
Key Regions and Countries
North America
- US
- Canada
Europe
- Germany
- France
- The UK
- Spain
- Italy
- Rest of Europe
Asia Pacific
- China
- Japan
- South Korea
- India
- Australia
- Rest of APAC
Latin America
- Brazil
- Mexico
- Rest of Latin America
Middle East & Africa
- GCC
- South Africa
- Rest of MEA
Market Dynamics
Drivers
| Driver | (~) % CAGR | Geographic Relevance | Impact Timeline |
|---|---|---|---|
| Rapid urbanization & municipal waste growth | +3.2% | Global, strongest in Asia, Africa, Latin America | Medium term (2 to 4 years) |
| Smart city & digital public infrastructure roll-outs | +2.4% | Global, concentrated in Asia Pacific, Europe, North America | Medium term (2 to 4 years) |
| Emission & landfill diversion regulation | +1.9% | EU, North America, selected OECD & large emerging economies | Long term (4 years or more) |
| Declining IoT hardware costs | +1.4% | Global | Short term (2 years or less) |
| Availability of concessional climate finance | +1.1% | Emerging markets accessing MDB & climate funds | Medium term (2 to 4 years) |
Rapid urbanization & municipal waste growth
Rapid urban population growth is a major driver for smart waste collection technology. UN DESA projects the urban population to increase from around 4.4 billion in 2020 to nearly 6.7 billion by 2050, adding more than 2 billion city residents. With each person generating approximately 0.8–1.6 kg of municipal waste per day, this expansion could contribute around +3.2% to the market’s CAGR.
UNEP estimates that annual municipal waste could rise from about 2.3–2.6 billion tonnes today to nearly 3.8–3.9 billion tonnes by 2050. Many high-income cities already generate 500–700 kg of waste per person annually. Rising waste volumes, limited municipal budgets, and expanding collection routes are encouraging operators to adopt IoT-enabled bins, fleet telematics, analytics, and route optimisation to control costs and improve collection efficiency.
Restraints
| Restraint | (~) % CAGR | Geographic Relevance | Impact Timeline |
|---|---|---|---|
| High upfront CapEx & borrowing costs | -2.6% | Global, strongest in lower-income markets | Medium term (2 to 4 years) |
| Limited municipal digital procurement capacity | -1.7% | Emerging & developing economies | Medium term (2 to 4 years) |
| Fragmented regulatory frameworks for data & sensors | -1.4% | EU, North America, selected Asian markets | Long term (4 years or more) |
| Currency volatility on imported hardware | -1.1% | Import-dependent emerging markets | Short term (2 years or less) |
| Slow payback perception among municipal decision-makers | -0.8% | Global | Medium term (2 to 4 years) |
High upfront CapEx & borrowing costs
High borrowing costs remain a major restraint for smart waste collection technology. IMF data indicate that benchmark interest rates in several emerging economies remained within 6–10% during 2024–2026, while municipal infrastructure loans often cost several percentage points more than sovereign borrowing. As citywide projects can require investments of several million in local currency, financing pressure could reduce the market’s baseline CAGR by around -2.6%.
Local governments in many regions spend more than 20% of their budgets on debt servicing and existing waste operations, leaving limited funds for new technology. High interest rates, restricted budgets, and uncertain returns can delay large sensor deployments and extend procurement cycles by 1–3 years. As a result, vendors increasingly depend on smaller pilot projects, leasing models, and phased installations to support adoption.
Challenges
| Challenge | (~) % CAGR | Geographic Relevance | Mitigation Horizon |
|---|---|---|---|
| Integration of heterogeneous IoT stacks | -2.1% | Global, especially multi-vendor city deployments | Long term (4 years or more) |
| Shortage of data & fleet analytics talent | -1.6% | Global, acute in emerging markets | Medium term (2 to 4 years) |
| Battery life & maintenance complexity for bin sensors | -1.3% | Global | Medium term (2 to 4 years) |
| Telecom reliability on collection routes | -1.1% | Rural & peri-urban areas worldwide | Short term (2 years or less) |
| Operational change management in municipal fleets | -0.9% | Global | Medium term (2 to 4 years) |
Integration of heterogeneous IoT stacks
System interoperability remains a major restraint for smart waste collection technology. Large cities often operate more than 5–10 separate IoT and control systems for traffic, lighting, parking, waste, and water, frequently using different communication standards. Limited integration between these platforms could reduce the market’s maximum achievable CAGR by around 2.1%.
Differences in NB-IoT, LTE-M, and 4G/5G network coverage, along with stricter cybersecurity and data-management rules, further increase project complexity. Vendors must invest in middleware, API layers, and specialist integration teams, adding several percentage points to implementation costs. These requirements can extend deployment timelines by 6–18 months, turning simple technology upgrades into longer, multi-stage projects and limiting near-term market growth.
Opportunities
| Opportunity | (~) % CAGR | Geographic Relevance | Execution Window |
|---|---|---|---|
| Outcome-based & savings-linked service models | +2.3% | Global | Medium term (2 to 4 years) |
| Integration with material recovery & energy assets | +2.0% | OECD & large emerging economies | Long term (4 years or more) |
| AI-driven dynamic pricing & service tiers | +1.7% | Global, strongest in commercial & industrial segments | Medium term (2 to 4 years) |
| Regional sensor & hardware manufacturing hubs | +1.5% | Asia, Eastern Europe, Latin America | Long term (4 years or more) |
| Data monetization for urban planning & ESG reporting | +1.2% | Global | Medium term (2 to 4 years) |
Outcome-based & savings-linked service models
Performance-based contracts offer a future growth opportunity for smart waste collection by reducing concerns over upfront capital spending. Unlike traditional hardware-and-license models, these contracts allow vendors to share verified cost and emission savings with customers. Wider adoption of this model could add around +2.3% to market CAGR.
Waste collection commonly accounts for 30%–50% of municipal solid waste budgets. Sensor-based routing can reduce truck kilometres by 15%–30%, fuel use by 10%–20%, and overtime labour by up to 25%. Linking vendor payments to these savings could improve operating margins by several percentage points and shorten payback periods from 7–10 years to around 3–5 years, encouraging faster adoption among municipalities and private waste operators.
Key Players Analysis
Tier-1 participants in the smart waste collection technology market include large environmental service companies and major North American waste operators that combine physical infrastructure with digital systems. Veolia Environnement recorded EUR 45.4 billion in total revenue in 2023, while its Waste Solutions business generated EUR 2.9 billion, equal to around 6.4% of group revenue.
The company treated 63 million tonnes of waste and served 43 million people. Waste Management Inc. reported USD 20.4 billion in revenue, including USD 16.1 billion from collection services and USD 4.8 billion from landfill operations. Republic Services generated USD 14.9 billion, increasing 10.8% year over year.
Recycling and solid waste contributed USD 6.5 billion, while environmental solutions added USD 806.6 million. Its RISE platform is expected to generate USD 100 million in annual earnings. Together, Tier-1 companies are estimated to represent 55–65% of smart waste collection spending.
Tier-2 participants include specialised technology companies and regional waste operators. SUEZ generated EUR 8.8 billion in 2023, with 61% coming from Recycling & Recovery, while processing nearly 28 million tonnes of waste. SAP recorded approximately EUR 8.0–8.5 billion in cloud and software revenue. Sensoneo, Urbiotica, Bigbelly, Ecube Labs, Enevo, and Inogen Environmental Alliance generally operate within an annual revenue range of EUR 5–25 million. Collectively, these companies may hold around 5–15% of the market.
Top Key Players in the Market
- Sensoneo j. s. a.
- Urbiotica, S.L.
- Republic Services Inc.
- Bigbelly, Inc.
- SUEZ Environmental Services.
- Veolia Environnement S.A.
- Ecube Labs Co Ltd
- Waste Management Inc.
- Enevo Oy
- SAP
- Inogen Environmental Alliance, Inc.
Recent Developments
- In 2025, WM opened four advanced recycling and renewable natural gas facilities involving more than USD 323 million in executed investment. These projects formed part of its approximately USD 3 billion sustainability growth programme covering 39 new or upgraded recycling facilities and 20 renewable natural gas plants. At the time of the announcement, WM had completed 27 recycling projects and 8 renewable natural gas facilities, supporting wider use of AI-based sorting, collection telemetry, and route optimisation.
- In 2025, Reworld expanded its technology-supported waste transportation and processing network through its ReMove logistics solution. The company operated more than 90 treatment, recycling, and material-processing facilities and increased its transportation fleet by 50% to more than 3,000 vehicles.
Report Scope
| Report Features | Description |
|---|---|
| Market Value (2025) | USD 3.4 Billion |
| Forecast Revenue (2035) | USD 16.1 Billion |
| CAGR (2026-2035) | 16.8% |
| Base Year for Estimation | 2025 |
| Historic Period | 2020-2024 |
| Forecast Period | 2026-2035 |
| Report Coverage | Revenue Forecast, Market Dynamics, Competitive Landscape, Recent Developments |
| Segments Covered | By Waste Type (Solid Waste, Special Waste, E-Waste); By Method (Smart Collection, Smart Processing, Smart Disposal); By Source (Residential, Commercial, Industrial) |
| Regional Analysis | North America – US, Canada; Europe – Germany, France, The UK, Spain, Italy, Rest of Europe; Asia Pacific – China, Japan, South Korea, India, Australia, Singapore, Rest of APAC; Latin America – Brazil, Mexico, Rest of Latin America; Middle East & Africa – GCC, South Africa, Rest of MEA |
| Competitive Landscape | Sensoneo j. s. a., Urbiotica, S.L., Republic Services Inc., Bigbelly, Inc., SUEZ Environmental Services, Veolia Environnement S.A., Ecube Labs Co Ltd, Waste Management Inc., Enevo Oy, SAP, Inogen Environmental Alliance, Inc. |
| Customization Scope | Customization for segments, region/country-level will be provided. Moreover, additional customization can be done based on the requirements. |
| Purchase Options | We have three licenses to opt for: Single User License, Multi-User License (Up to 5 Users), Corporate Use License (Unlimited Users and Printable PDF) |





























