
Quick Navigation
Report Overview
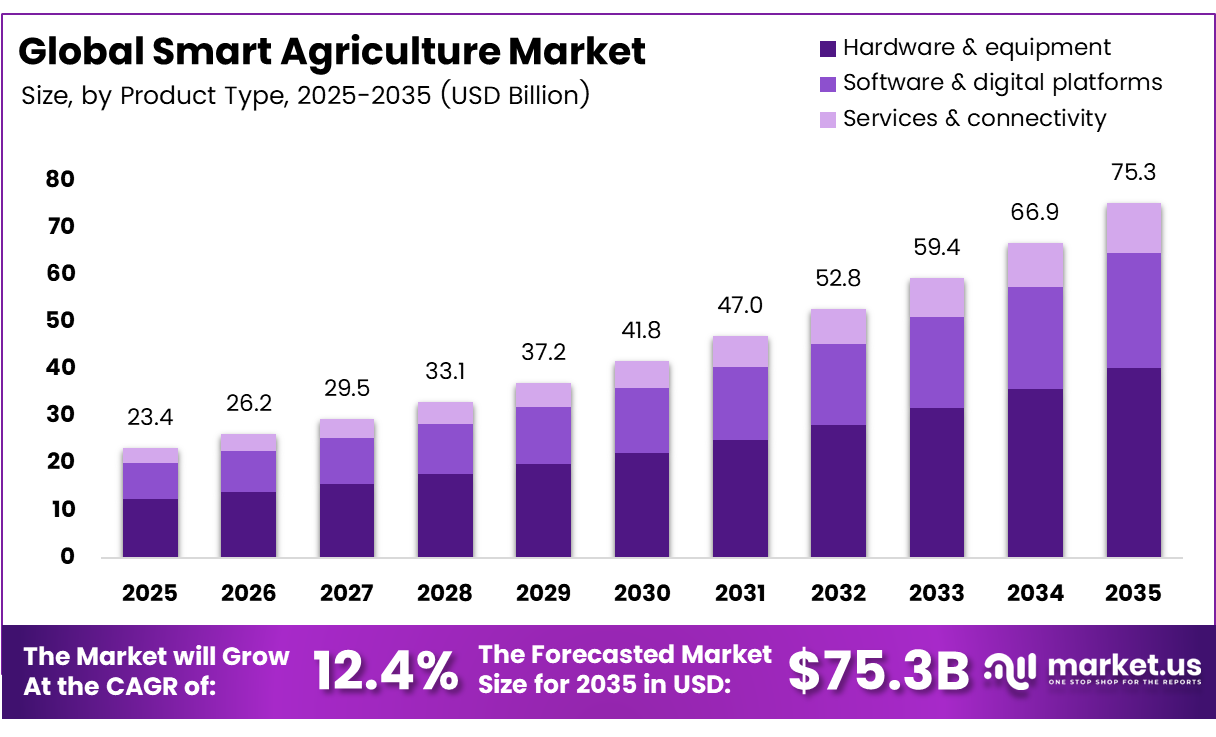
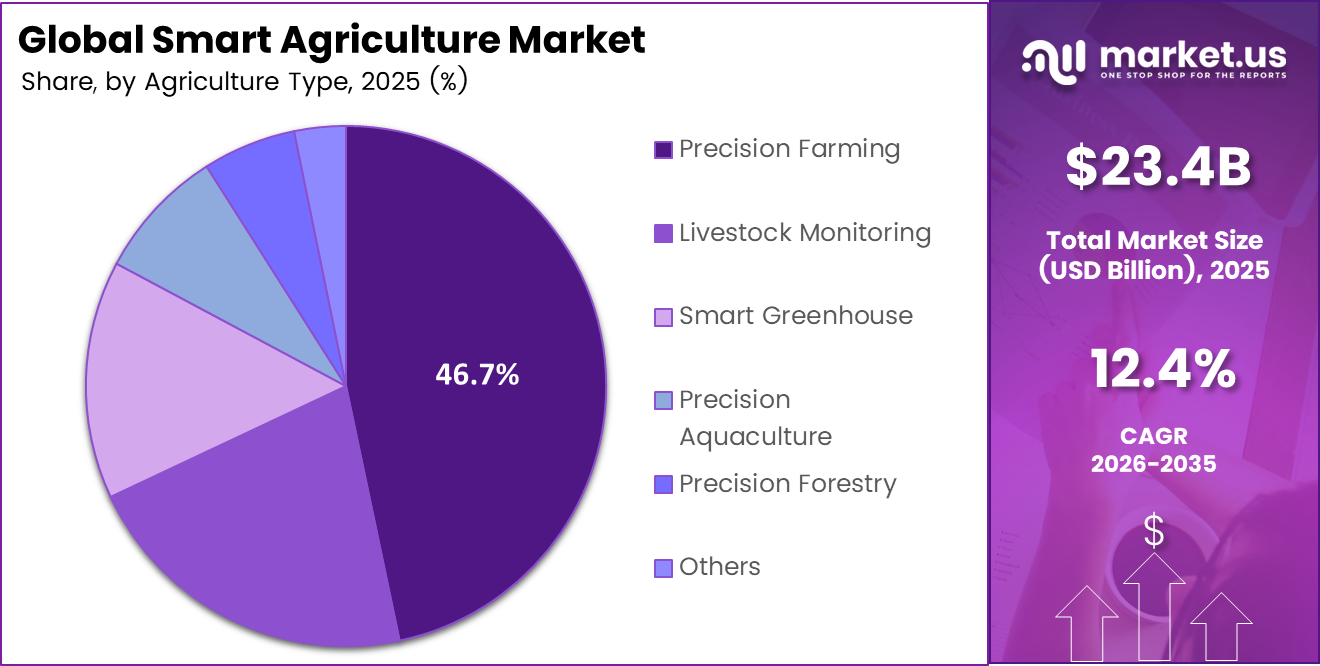
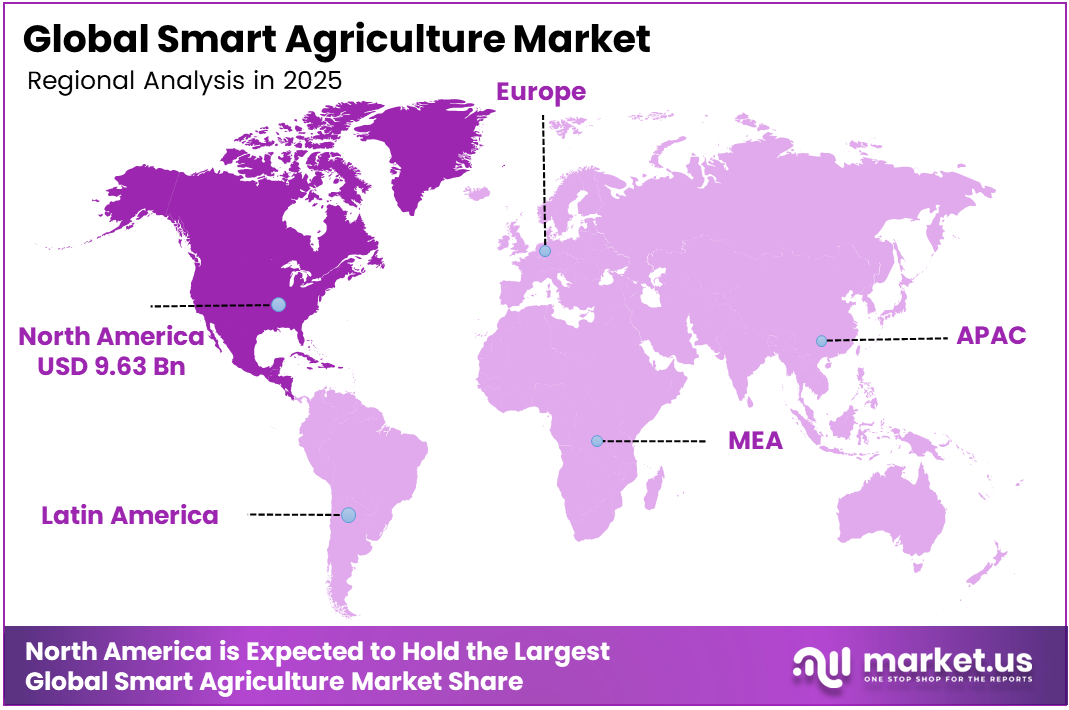
The Global Smart Agriculture Market was valued at USD 23.4 billion, and between 2026 and 2035, this market is estimated to register a CAGR of 12.4%, reaching about USD 75.3 billion by 2035. In 2025, North America led the market, achieving over 41.2% share with a revenue of USD 9.63 billion.
Smart Agriculture is the integration of IoT, AI, robotics, remote sensing, and big data analytics into farming operations to optimise inputs, maximise yields, and increase climate resilience. It includes precision farming, livestock monitoring, smart irrigation, drone-based crop surveillance, and controlled-environment agriculture.
The UN Food and Agriculture Organisation (FAO) estimates that worldwide food production will need to expand by 70% by 2050 to feed a growing population, with cereal consumption estimated to exceed 3 billion tonnes. The market is expanding because agriculture faces three simultaneous, structural crises: food-security pressure, climate variability, and labour scarcity, each independently sufficient to drive technology adoption, and together forming a compounding demand engine.
Labour shortages are accelerating smart technology adoption. According to the USDA Economic Research Service, guidance autosteering systems were used by 52% of mid-sized farms and 70% of large-scale U.S. crop farms in 2023, highlighting the growing shift toward automation to address workforce constraints. The market’s key technologies include GPS guidance systems, variable-rate technology, sensors, drones, robotics, self-driving tractors, satellite monitoring, AI-powered analytics, and cloud-based farm management platforms.
The most rapidly expanding demand factors include autonomous field operations, real-time crop monitoring, predictive analytics, and resource-optimisation solutions that cut fertiliser, water, fuel, and labour inputs. Government-supported digitisation efforts, increased farm data availability, and breakthroughs in machine learning are projected to speed up the shift to linked and autonomous farming ecosystems.
Key Takeaways
- The global smart agriculture market was valued at USD 23.4 billion in 2025.
- The global smart agriculture market is projected to grow at a CAGR of 12.4% and is estimated to reach USD 75.3 billion by 2035.
- In 2025, the Hardware & Equipment segment held a dominant market position, capturing a 53.4% share of the Global Smart Agriculture Market.
- In 2025, the Precision Farming segment held a dominant market position, accounting for 46.7% of the Global Smart Agriculture Market by agriculture type.
- In 2025, the Irrigation Management segment held a dominant market position, representing 16.4% of the Global Smart Agriculture Market by application.
- In 2025, North America held a dominant market position in the Global Smart Agriculture Market, capturing 41.2% of the total market share.
Product Type Analysis
Hardware & Equipment represents the dominant Product Segment in the Market.
Hardware & equipment represent the dominant segment in the smart agriculture market, accounting for 53.4% share due to the fundamental need for localised telemetric nodes, sensor arrays, global navigation satellite system (GNSS) guiding receivers, and variable-rate application (VRA) physical assembly before any digital software stacking can take place.
The capital-intensive nature of deploying ruggedised agricultural Internet of Things (IoT) sensors, automated steering actuators, and drone-based multispectral imaging platforms necessitates a significant initial investment that exceeds the relative cost of cloud subscriptions and professional advisory fees combined.
Software & digital platforms are the fastest-growing segment during 2026–2035, driven by the shift toward cloud-native Farm Management Information Systems (FMIS) and SaaS-based agritech ecosystems. As AI-driven analytics, predictive modelling, and real-time farm data monetisation grow, software revenues are predicted to close the gap with hardware by 2030.
Agriculture Type Analysis
Precision Farming Held a Major Share of the Smart Agriculture Market.
Precision Farming, accounting for 46.7% of the market, represents the dominant technology segment due to increased field agricultural productivity while minimising input waste using automated technologies such as yield mapping, soil sampling, and variable-rate input application.
The majority of global arable land is devoted to large-scale row crops such as maize, wheat, and soybeans, which has resulted in a significant vendor concentration on outdoor precision systems. Tractor-mounted optical sensors detect weeds in real time, allowing for targeted herbicide spraying while lowering chemical use and operational expenses.
Precision farming’s dominant position is supported by the growing economic need to follow severe worldwide environmental compliance rules, such as nitrogen discharge limitations into localised water tables. Furthermore, the quick integration of high-resolution satellite imagery with public geospatial data has reduced data collection costs, making precision field management affordable to large commercial producers aiming to combat rising fertiliser prices.
Livestock monitoring is predicted to be the fastest-growing category between 2026 and 2035, driven by the shift from manual herd management to continuous automated biological tracking systems. Between 2026 and 2030, usage will increase as large-scale dairy and meat production facilities introduce more IoT-enabled wearables, automated feeding systems, and real-time health analytics platforms.
Application Analysis
Smart Agriculture Is Mostly Utilised in the Irrigation Management Sector.
The irrigation management segment, accounting for 16.4% of the smart agriculture market, remains the dominant application category due to increasing water scarcity, rising irrigation costs, and growing regulatory pressure to improve water-use efficiency, prompting agricultural producers to adopt automated precision irrigation systems.
Yield monitoring and predictive crop scouting are predicted to be the fastest-growing applications from 2026 to 2035. Drone-based multispectral imaging and sensor-equipped machines will become standard farm equipment by 2030. Machine learning advancements, which allow for early diagnosis of crop stress and production variability, are driving growth. Real-time yield intelligence is also in high demand to help with harvest planning, pricing risk management, and agricultural supply chain efficiencies.
Weather tracking and micro-climate forecasting are developing as high-potential applications in Smart Agriculture, with a significant increase projected between 2030 and 2035. The transition from regional forecasting to field-level, sensor-driven micro-climate modeling allows for more exact predictions of frost, rainfall, and wind events. Edge computing weather stations and automated crop protection alarm systems help to drive adoption.
Key Market Segments
By Product Type
- Hardware & equipment
- Software & digital platforms
- Services & connectivity
By Agriculture Type
- Precision Farming
- Livestock Monitoring
- Smart Greenhouse
- Precision Aquaculture
- Precision Forestry
- Others
By Application
- Irrigation Management
- Field Mapping
- Crop Scouting
- Weather Tracking and Forecasting
- Yield Monitoring
- Farm Labor Management
- Financial Management
- Feeding Management
- Milk Harvesting
- Others
Market Dynamics
Opportunity
Embedded financial services represent a substantial opportunity because most smart agriculture platforms currently earn revenue mainly through equipment and software subscriptions. These platforms already collect detailed information on yields, soil conditions and input use, creating stronger underwriting signals than those available to conventional agricultural lenders. Farm-level data models could improve credit-risk discrimination by approximately 31–38% compared with traditional credit-bureau methods.
Annual financing demand among smallholder farmers exceeds USD 240 billion, but only about USD 70 billion is currently served, leaving an estimated USD 170 billion funding gap. Technology providers could participate in this opportunity through input loans, working-capital advances, parametric insurance and harvest-receivables financing. Potential monetisation models include a 180–240-basis-point lending spread or an origination fee of 1.8–2.4%. Adding these services could raise blended revenue per acre from USD 11–14 to USD 27–34 and contribute nearly 2.7 percentage points of additional market growth as platforms evolve into agricultural financial-service orchestrators.
| Opportunity | (~) % Potential CAGR Upside | Geographic Relevance | Execution Window |
|---|---|---|---|
| Agri-Fintech Embedded Lending | +2.7% | India, SSA, LATAM emerging | Medium term |
| Carbon-Credit Origination Roll-Up M&A | +2.1% | EU, Brazil, US Midwest | Short term |
| Autonomous Specialty-Crop Robotics | +1.9% | California, Iberia, NZ, Japan | Medium term |
| Verticalized AI Foundation Models for Ag | +1.6% | Global, NA & EU first | Long term |
| Aquaculture & Controlled-Environment Adjacency | +1.4% | SE Asia, Gulf states, Northern EU | Long term |
| Equipment-as-a-Service & Outcome Pricing | +1.2% | US, EU, ANZ mature markets | Medium term |
Drivers
The transition from sensor-based monitoring to closed-loop AI agronomy platforms is reshaping the economics of smart agriculture. These systems can reduce advisory costs from nearly USD 18–22 per acre to below USD 6.50 while improving realised yields by 8–14% in row-crop farming. This shift is expected to move the market’s baseline 11.0% CAGR toward its upper growth range. It also changes the commercial model from a one-time hardware purchase to recurring software revenue, where gross margins can reach 72–78%.
Average annual revenue per farm could consequently rise from approximately USD 1,400 to USD 3,800 within a 24-month adoption period. AI-focused agricultural platforms attracted more than USD 2 billion in dedicated venture funding during 2025, supporting an estimated USD 100 billion annual value opportunity by 2030 through input optimisation and waste reduction. Consumption-based inference services priced by hectare and crop stage could further improve vendor lifetime-value-to-acquisition-cost ratios from 2.1x to nearly 4.6x.
| Driver | (~) % Impact on CAGR Forecast | Geographic Relevance | Impact Timeline |
|---|---|---|---|
| AI-Native Decision Agronomy Stack | +2.4% | North America core, EU-27, Brazil Cerrado | Short term |
| Autonomous Machinery & Robotics Rollout | +1.9% | US Midwest, Canada Prairies, Australia | Medium term |
| Sovereign Digital-Ag Subsidy Programs | +1.7% | China, India, EU CAP zone | Short term |
| Carbon MRV & Scope 3 Compliance Mandates | +1.3% | EU, California, ANZ corridors | Medium term |
| LEO Satellite + Edge IoT Connectivity | +1.1% | APAC emerging, Sub-Saharan Africa, LATAM | Medium term |
| Climate-Volatility Insurance Linkage | +0.8% | South Asia, MENA, US Sun Belt | Short term |
Restraints
The high cost of smart farming systems remains a major restraint in smallholder-dominated economies. A basic IoT and variable-rate technology package for 20 hectares typically costs between USD 4,200 and USD 6,800, while the median annual discretionary capital budget of small farmers across South Asia and Sub-Saharan Africa remains between USD 380 and USD 620. Existing equipment designs are generally optimised for farms covering around 800 hectares, where hardware expenditure can be amortised at less than USD 9 per hectare.
On a typical 1.4-hectare holding, however, the same system can create a burden of approximately USD 410 per hectare, exceeding the USD 290–340 gross margin commonly generated by staple crops. Reaching the lower-income farming population would require vendors to reduce average selling prices by nearly 68%, which could weaken hardware profitability. This affordability mismatch may reduce projected industry growth by around 1.6 percentage points and postpone nearly USD 6.1 billion of addressable installations beyond 2030.
| Restraint | (~) % Impact on CAGR Forecast | Geographic Relevance | Impact Timeline |
|---|---|---|---|
| Smallholder Capex Unaffordability | −1.6% | South Asia, SSA, SE Asia | Long term |
| Semiconductor & Sensor Tariff Escalation | −1.2% | US-China corridors, EU imports | Short term |
| High Real Interest-Rate Drag on Capex | −0.9% | EU, US Midwest, LATAM | Short term |
| Fragmented Data Interoperability Standards | −0.7% | Global, acute in EU/US | Medium term |
| Cybersecurity Liability & Insurance Caps | −0.6% | North America, EU regulatory hubs | Medium term |
| Counterfeit & Grey-Market Sensors | −0.4% | China domestic, India, SEA | Short term |
Challenges
Inadequate after-sales service is a persistent operational challenge for smart agriculture equipment in emerging markets. The nearest trained technician may be located an average of 167 kilometres from an installed system, compared with only 24 kilometres in developed markets. This service gap can extend repair periods to between 11 and 19 days, while each week of downtime during a critical crop stage may reduce yields by 3.8–6.4%. Poor service availability also creates a Net Promoter Score gap of approximately 28–34 points and contributes to annual customer churn of 17–23%.
Addressing the issue will require regional repair centres, partnerships with agricultural extension networks and equipment redesigned for easier field maintenance. Establishing broad service coverage across Latin America and Sub-Saharan Africa could require USD 240–380 million in capital investment and take between four and seven years. Service-oriented product redesign may also add 14–22% to component complexity. Until these networks mature, the operational shortfall could reduce the expected CAGR by nearly 1.1 percentage points.
| Challenge | (~) % CAGR Friction Drag | Geographic Relevance | Mitigation Horizon |
|---|---|---|---|
| Agronomy-AI Talent Deficit | −1.4% | Global, acute in US, EU, India | Long term |
| Last-Mile Service Network Gaps | −1.1% | LATAM, SSA, SE Asia | Long term |
| Multi-Sensor Calibration Drift | −0.8% | Global humid & arid extremes | Medium term |
| Farmer Digital-Literacy Friction | −0.7% | South Asia, SSA, Eastern EU | Long term |
| Climate Tail-Risk Model Volatility | −0.6% | Global, acute in monsoon belts | Long term |
| Channel-Conflict & Dealer Disintermediation | −0.5% | US, EU, ANZ mature corridors | Medium term |
Geopolitical Impact Analysis
Geopolitical Impacts of the Russia–Ukraine Conflict on the 2026 Smart Agriculture Market.
The protracted Russia-Ukraine war continues to have a substantial impact on global agricultural systems in 2026, causing structural constraints and strategic recalibrations in the smart agriculture sector. Ukraine’s agriculture industry remains an important hub for global food security and commodities flows, but continuous hostilities have severely impacted production, export capacity, and supply chains. Ukraine’s grain exports, including wheat, corn, and barley, are expected to be 35% lower in 2025 than in 2020 due to war-related infrastructure damage, logistics bottlenecks, and limited access to export corridors like the Black Sea.
Furthermore, active warfare has destroyed agricultural assets, disrupted sowing and harvesting cycles, slowed mechanisation, and worsened labour shortages, all of which jeopardise traditional farming operations. The Food and Agriculture Organisation’s 2026-2028 emergency and early recovery plan emphasises the need for targeted assistance to rebuild productive capacity and protect rural livelihoods, as protracted hostilities constrain access to land, machinery, and markets.
These geopolitical shocks are causing ripple effects in the smart agricultural business. The volatility in grain and fertiliser supplies due to Black Sea interruptions and global trade distortions has increased input cost uncertainty, making precision input management technology increasingly valuable for risk-averse growers worldwide.
War-related instability drives demand for data-driven systems that can maximise output under uncertain situations, including AI-enabled forecasting, autonomous operations, and remote sensing platforms. Conflict-related fiscal strains in major markets may redirect state investment from innovation to emergency support, limiting technology diffusion.
Regional Analysis
North America Held the Largest Share of the Global Smart Agriculture Market.
North America leads the global smart agriculture market with a 41.2% share, owing to large-scale commercial farming operations, high mechanisation levels, and widespread adoption of precision agriculture technologies. The region benefits from excellent digital infrastructure, extensive usage of self-driving machinery, and robust government-backed funding schemes that promote agricultural innovation.
Farmers in the United States and Canada are early adopters of GPS-guided equipment, AI-based farm management systems, and IoT-enabled monitoring solutions, making the region the most developed market for smart agriculture implementation. Europe is a highly regulated, sustainability-driven market where precision farming, carbon-efficient agriculture, and smart irrigation are used to satisfy CAP environmental standards.
Germany, France, and the Netherlands are pioneers in controlled-environment agriculture and digital farming, aided by robust agri-tech ecosystems and government funding. Asia Pacific is the fastest-growing market, due to a huge agricultural base, rising food demand, and government investment in IoT irrigation, drone surveillance, and AI crop advising platforms, while adoption varies due to infrastructure and cost constraints.
Key Regions and Countries Covered in this Report
- North America
- The US
- Canada
- Europe
- Germany
- France
- The UK
- Spain
- Italy
- Russia & CIS
- Rest of Europe
- APAC
- China
- Japan
- South Korea
- India
- ASEAN
- Rest of APAC
- Latin America
- Brazil
- Mexico
- Rest of Latin America
- Middle East & Africa
- GCC
- South Africa
- Rest of MEA
Key Players Analysis
The global smart agriculture market shows a moderately fragmented to semi-consolidated structure, where a group of established multinational companies holds a significant share, while many technology-focused startups and regional providers continue to compete in specialised segments. Large companies such as John Deere & Company, Bayer, AGCO, CLAAS Group, CNH Industrial, Kubota, Mahindra & Mahindra, Trimble, Topcon, and Yara International have built strong positions through extensive product portfolios, global distribution networks, and continuous investment in precision farming technologies.
Their offerings span connected tractors, precision guidance systems, farm management software, crop monitoring tools, and data-driven decision platforms. Because farmers often prefer integrated solutions that combine equipment, sensors, software, and analytics, these established players maintain a competitive advantage in many regions.
The firms focus on areas such as artificial intelligence, autonomous machinery, robotic weed control, drone-based crop intelligence, and advanced field analytics. As digital farming adoption increases across North America, Europe, Asia-Pacific, and Latin America, partnerships, acquisitions, and technology collaborations are becoming common strategies to expand capabilities and customer reach.
The presence of both global agricultural equipment manufacturers and fast-growing agri-tech innovators prevents the market from becoming fully consolidated. As a result, competition is driven not only by machinery sales but also by software platforms, precision agriculture services, automation solutions, and real-time farm intelligence, creating a dynamic environment where both established leaders and innovative newcomers continue to shape market growth.
The Following are some of the Major Players in the Industry
- John Deere & Company
- Bayer
- AGCO
- CLAAS Group
- CNH Industrial
- Farmers Edge
- Carbon Robotics
- Kubota
- Mahindra & Mahindra
- Monarch Tractor
- Prospera Technologies
- Taranis
- Topcon
- Trimble
- Yara International
Key Development
- In May 2026, Bayer reported that its FarmRise digital agriculture platform crossed 5 million registered users in May 2026. The platform strengthened Bayer’s direct-to-farmer ecosystem by integrating agronomy advisory, insurance, credit access, market linkage, and sustainable farming support into a single digital channel.
- In April 2026, John Deere strengthened its smart agriculture direction through a 3-year USD 2.7 million partnership with FIRST, supporting robotics and automation skills for more than 9,000 students. This supports its long-term autonomous farming and precision agriculture talent pipeline.
Report Scope
| Report Features | Description |
|---|---|
| Market Value (2025) | USD 23.4 Bn |
| Forecast Revenue (2035) | USD 75.3 Bn |
| CAGR (2026-2035) | 12.4% |
| Base Year for Estimation | 2025 |
| Historic Period | 2020-2024 |
| Forecast Period | 2026-2035 |
| Report Coverage | Revenue Forecast, Market Dynamics, Competitive Landscape, Recent Developments |
| Segments Covered | By Product Type (Hardware & equipment, Software & digital platforms, Services & connectivity), By Agriculture Type (Precision Farming, Livestock Monitoring, Smart Greenhouse, Precision Aquaculture, Precision Forestry, Others), By Application (Irrigation Management, Field Mapping, Crop Scouting, Weather Tracking and Forecasting, Yield Monitoring, Farm Labor Management, Financial Management, Feeding Management, Milk Harvesting, Others) |
| Regional Analysis | North America – The US & Canada; Europe – Germany, France, The UK, Spain, Italy, Russia & CIS, Rest of Europe; APAC- China, Japan, South Korea, India, ASEAN & Rest of APAC; Latin America- Brazil, Mexico & Rest of Latin America; Middle East & Africa- GCC, South Africa, & Rest of MEA |
| Competitive Landscape | John Deere & Company, Bayer, AGCO, CLAAS Group, CNH Industrial, Farmers Edge, Carbon Robotics, Kubota, Mahindra & Mahindra, Monarch Tractor, Prospera Technologies, Taranis, Topcon, Trimble, Yara International |
| Customization Scope | Customisation for segments and region/country-level will be provided. Moreover, customisation can be tailored to the requirements. |
| Purchase Options | We have three licenses to opt for: Single User License, Multi-User License (Up to 5 Users), Corporate Use License (Unlimited Users and Printable PDF) |


