


Report Overview
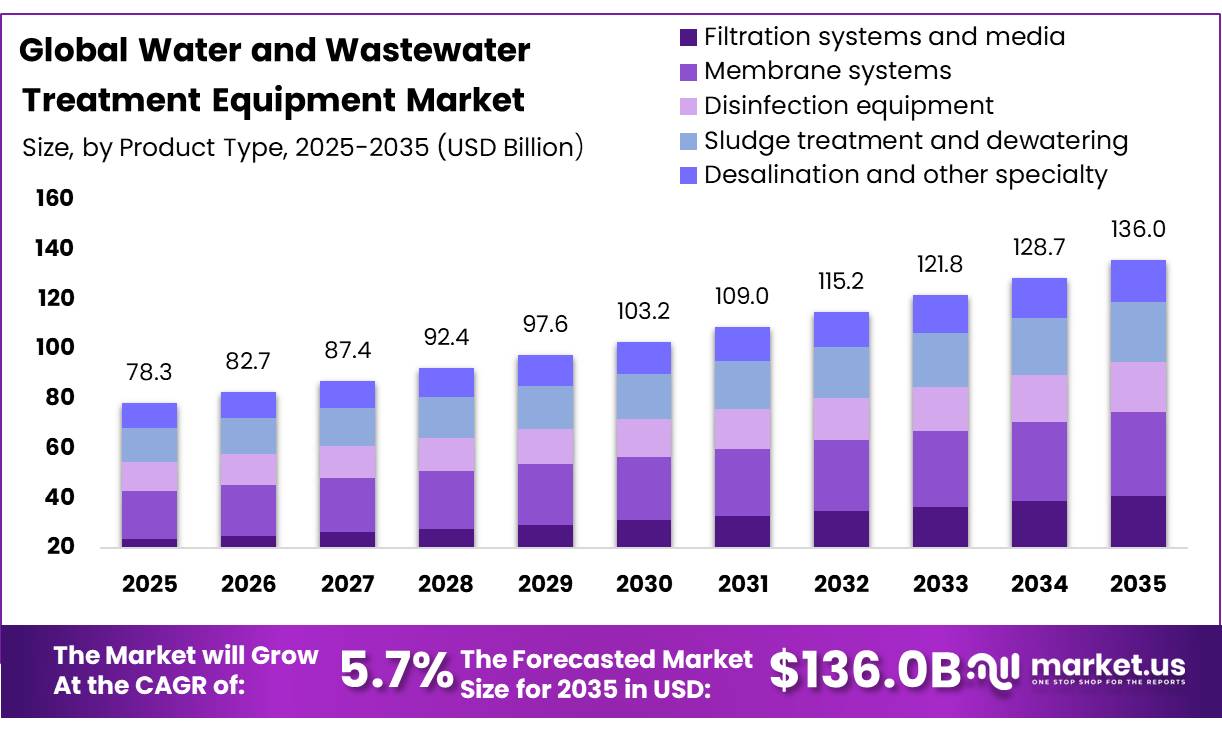
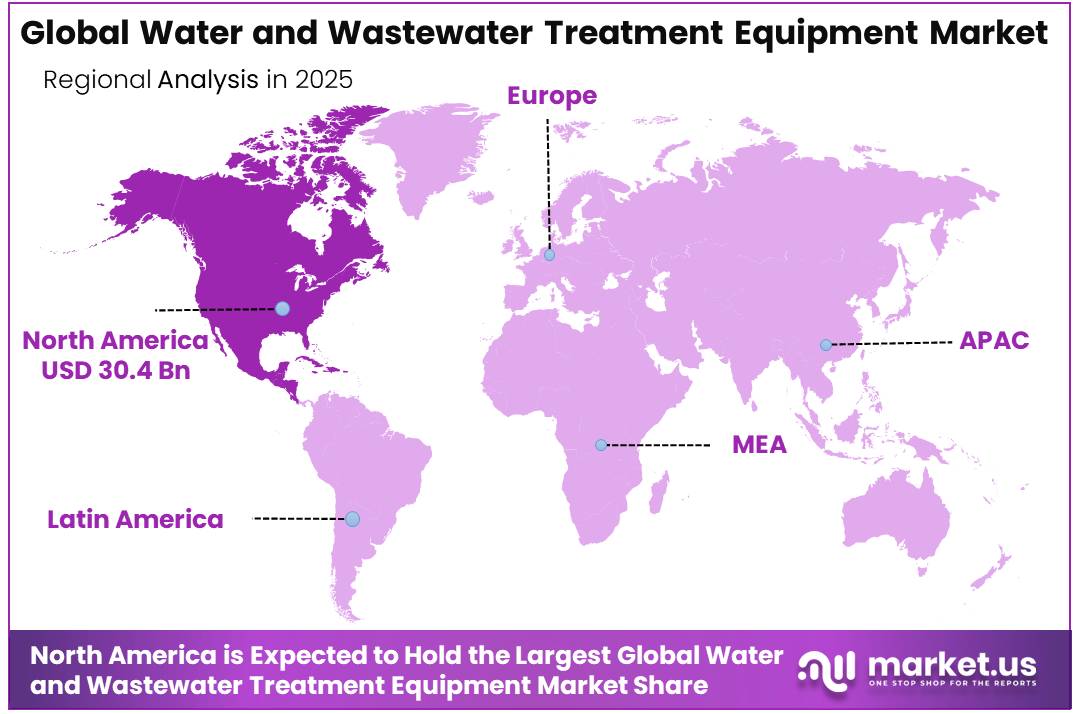
The Global water and wastewater treatment equipment market was evaluated at US$ 78.3 billion in 2025, expected to increase at a rate of 5.7% CAGR and reach approximately US$ 136.0 billion by 2035. North America held a dominant market position, capturing more than a 38.9% share, holding USD 30.4 billion in revenue.
Water and wastewater treatment equipment covers pumps, screens, clarifiers, filters, membranes, aeration systems, disinfection units, sludge-handling machinery, and digital monitoring instruments used to make water suitable for municipal, industrial, and reuse applications. The industry is moving from basic contaminant removal toward integrated plants that recover water, energy, and nutrients while meeting tighter discharge requirements.
- In August 2025, WHO and UNICEF reported that 2.1 billion people still lacked safely managed drinking water and 3.4 billion lacked safely managed sanitation. UN-Water’s 2024 assessment found that, among 22 reporting countries, only 38% of industrial wastewater was treated and just 27% was safely treated. These gaps support demand for biological reactors, tertiary filtration, membrane systems, ultraviolet disinfection, chemical dosing, and real-time quality sensors.
Key Takeaways
- The global water and wastewater treatment equipment market was valued at USD 78.3 billion in 2025.
- The global market is projected to grow at a CAGR of 5.7% and is estimated to reach USD 136.0 billion by 2035.
- Based on product type, filtration systems and media dominated the market, accounting for 30.2% of the total market share.
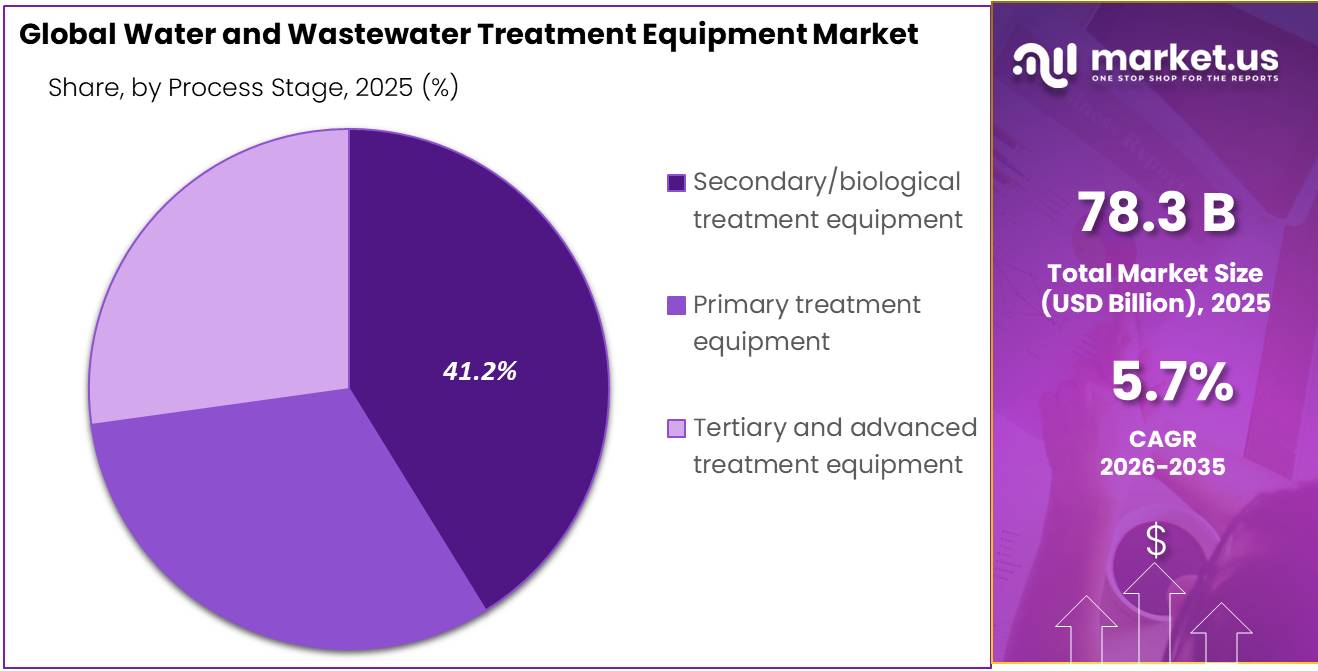
- Based on process stage, secondary/biological treatment equipment led the market, comprising 41.2% of the total market.
- By application, municipal water treatment held a major share in the market, accounting for 35.6% of the total market share.
- Among end-use industries, power generation dominated the market, representing 25.5% of the total market share.
- In 2025, North America was the most dominant region in the water and wastewater treatment equipment market, accounting for 38.9% of the total global market.
Public infrastructure spending is another major demand driver. The U.S. Environmental Protection Agency estimates that drinking-water systems require USD 625 billion over 20 years for treatment upgrades, pipes, storage, and related assets. The Infrastructure Investment and Jobs Act provides more than USD 50 billion for U.S. drinking-water, wastewater, and stormwater infrastructure. In Europe, the revised Urban Wastewater Treatment Directive entered into force on January 1, 2025, extending treatment requirements, addressing micropollutants and stormwater, and targeting energy neutrality for the sector.
Future opportunities will increasingly come from water reuse, advanced nutrient removal, PFAS and pharmaceutical treatment, decentralized systems, automation, and low-energy desalination. UN-Water estimates that untapped wastewater-reuse potential is about 320 billion cubic metres annually, exceeding ten times current global desalination capacity.
Market Segmentation
Product Type Analysis
Filtration systems and media lead through dependable contaminant removal
In 2025, Filtration systems and media held a dominant market position, capturing more than a 30.2% share. In October 2025, the World Health Organization highlighted filtration as a treatment component within drinking-water systems, supporting its use across municipal facilities. These systems are preferred because they remove suspended solids, sediments, microorganisms, and impurities before disinfection or advanced treatment.
Membrane systems are expanding as utilities and manufacturers seek compact equipment and reliable treatment. In July 2025, the U.S. Environmental Protection Agency highlighted membrane bioreactors for wastewater treatment, including their applicability and design considerations. Adoption of microfiltration, ultrafiltration, nanofiltration, and reverse osmosis is supported by water reuse, desalination, and contaminant removal projects.
Process Stage Analysis
Secondary treatment equipment leads biological pollutant removal
In 2025, Secondary/biological treatment equipment held a dominant market position, capturing more than a 41.2% share. This equipment remains central to wastewater plants because biological processes break down dissolved and suspended organic matter that primary systems cannot remove. Activated sludge units, aeration tanks, biofilters, clarifiers, and controls support stable treatment across municipal and industrial facilities. In December 2025, UN-Water’s domestic wastewater briefing note emphasized treatment gaps and the need to improve safe wastewater management.
Primary treatment equipment is also gaining importance as operators improve the performance of downstream stages. Screens, grit chambers, sedimentation tanks, skimmers, and primary clarifiers remove large solids, sand, grease, and settleable material before biological treatment. Better preliminary separation reduces equipment wear, lowers treatment loads, limits operational interruptions, and helps plants manage wastewater volumes more consistently.
Application Analysis
Municipal water treatment leads through reliable public water supply
In 2025, Municipal water treatment held a dominant market position, capturing more than a 35.6% share. Municipal utilities require dependable equipment to remove suspended solids, pathogens, organic matter, and emerging contaminants before water reaches households and facilities. Filtration units, clarifiers, chemical dosing systems, disinfection equipment, and monitoring instruments remain used because they support consistent quality and regulatory compliance.
In April 2025, the U.S. Environmental Protection Agency recognized drinking-water infrastructure projects that improved treatment performance, sustainability, and public-health protection, reinforcing continued equipment replacement and modernization across public systems.
Municipal wastewater treatment is gaining momentum as cities address aging plants, population growth, sewer overflows, and water-reuse needs. Treatment operators are adopting improved aeration, biological reactors, membrane systems, nutrient-removal equipment, sludge dewatering units, and automated controls. These technologies help facilities handle changing wastewater loads, reduce energy use, improve discharge quality, and prepare treated effluent for irrigation, industrial use, groundwater recharge, or further purification.
End-use Industry Analysis
Power generation leads through dependable water management
In 2025, Power generation held a dominant market position, capturing more than a 25.5% share. Power plants depend on water treatment equipment for boiler feedwater, cooling circuits, condensate polishing, wastewater handling, and discharge control. Filtration, reverse osmosis, ion exchange, chemical dosing, and monitoring systems help operators reduce scaling, corrosion, fouling, and shutdowns.
Oil and gas, refining and petrochemicals are gaining importance because their operations produce wastewater containing oil, grease, salts, chemicals, and suspended matter. In March 2025, the U.S. Environmental Protection Agency announced a review of oil and gas wastewater rules, including treatment for beneficial reuse. This direction supports demand for separators, dissolved air flotation, biological treatment, membranes, and advanced oxidation equipment.
Key Market Segments
By Product Type
- Filtration Systems and Media
- Membrane Systems
- Disinfection Equipment
- Sludge Treatment and Dewatering Equipment
- Desalination and Other Specialty Equipment
By Process Stage
- Primary Treatment Equipment
- Secondary/Biological Treatment Equipment
- Tertiary and Advanced Treatment Equipment
By Application
- Municipal Water Treatment
- Municipal Wastewater Treatment
- Industrial Water Treatment
- Industrial Wastewater Treatment
- Commercial and Decentralized Systems
By End-use Industry
- Power Generation
- Oil & Gas, Refining and Petrochemicals
- Chemicals and Pharmaceuticals
- Food and Beverage
- Pulp & Paper, Mining, and Other Industries
Drivers
Regulatory Escalation EU Directive 2026/805, U.S. PFAS Mandates & IIJA Capital Deployment
In the EU, Directive 2026/805 which entered into force on 11 May 2026 amends the Water Framework Directive, the Environmental Quality Standards Directive, and the Groundwater Directive simultaneously, extending the pollutant control list to include PFAS, microplastics, pharmaceuticals, and agricultural pesticides previously unmonitored under regulatory frameworks, and introducing “effect-based monitoring” as a mandatory water quality risk assessment methodology.
This single instrument will require thousands of EU wastewater treatment plants currently operating at secondary treatment level to invest in tertiary and quaternary treatment stages to remove the newly regulated substance classes capital upgrades whose combined EU-wide cost is estimated by European Commission impact assessments at EUR 2.0–6.3 billion per year through 2030, entirely new equipment procurement that did not exist in pre-2026 capital budgets.
Simultaneously, the EU’s revised Urban Wastewater Treatment Directive mandates all urban WWTPs serving populations above 100,000 achieve energy neutrality by 2045, requiring co-generation, biogas recovery, and smart energy management systems that add USD 5–12 million per facility upgrade across an estimated 1,800 qualifying European plants.
In the United States, the Infrastructure Investment and Jobs Act (IIJA) allocated USD 55 billion above the EPA baseline for water infrastructure across FY2022–FY2026, with the highest-ever SRF appropriations of USD 2.603 billion per year in FY2025 and FY2026 flowing through State Revolving Funds to utilities supplemented by USD 1 billion specifically earmarked for PFAS emerging contaminants remediation in clean water applications; the Value of Water Campaign projects that the U.S. alone requires USD 3.4 trillion in water infrastructure investment over the next 20 years, against an estimated USD 1.5 trillion of viable state/local capacity, leaving a USD 1.9 trillion structural funding gap that guarantees continuous federal appropriations demand regardless of political cycles.
Drivers Impact Analysis
| Driver | (~) % Impact on CAGR | Geographic Relevance | Impact Timeline |
|---|---|---|---|
| Global Water Scarcity Crisis | +1.3% | Global — MENA, South Asia, Sub-Saharan Africa (acute); APAC, North America, EU (broad) | Short term (≤ 2 years) |
| Regulatory Escalation | +1.1% | EU (Directive 2026/805 core); North America (IIJA + PFAS rules); India (ZLD mandates) | Short–Medium term (1–3 years) |
| APAC Urbanization & Industrialization Wave | +0.9% | China, India (primary); SE Asia — Vietnam, Indonesia, Thailand (secondary) | Medium term (2–4 years) |
| Smart Water & Digital Transformation | +0.8% | North America, EU (early adopters); APAC smart-city corridors (fast follower) | Medium–Long term (2–5 years) |
| Industrial ZLD & Water Reuse Mandates | +0.7% | India (regulatory core); China, North America, EU industrial belts | Short–Medium term (1–3 years) |
| Membrane Technology Advancement | +0.5% | Global — APAC (51% market share); North America; EU desalination corridor | Long term (≥ 4 years) |
Restraints
Municipal Funding Gap & SDG-6 Financing Deficit The Trillion-Dollar Demand-Investment Divide
The United Nations’ 2026 World Water Development Report confirmed that tariffs for water services across Sub-Saharan Africa fall significantly short of cost-recovery levels, with fewer than half of African countries achieving even partial cost recovery from tariff revenues, while the GLAAS 2026 assessment found a global funding gap of 46% between identified water and sanitation investment needs and available funding for national WASH targets a structural shortfall against the World Bank’s estimate that achieving universal access to safely managed water by 2030 requires tripling current investment to USD 114 billion annually.
In the United States alone, the ASCE’s 2024 Bridging the Gap analysis identified a USD 309 billion shortfall between drinking water infrastructure needs and available investment in 2024 that will grow to USD 620 billion by 2043, while the EPA pegs the 20-year national water infrastructure need at USD 625 billion a figure 30% higher than its own 2018 assessment; the U.S. EPA and National League of Cities are jointly pushing Congress to avert a post-IIJA “funding cliff” as the USD 5.85 billion annual SRF appropriations under the IIJA expire, with FY2027 appropriations uncertain as of mid-2026.
Restraint Impact Analysis
| Restraint | (~) % Impact on CAGR | Geographic Relevance | Impact Timeline |
|---|---|---|---|
| Municipal Funding Gap & SDG-6 Financing Deficit | -1.3% | Sub-Saharan Africa, South Asia (acute); LatAm, SE Asia (significant); North America (emerging) | Long term (≥ 4 years) |
| High CapEx & OpEx Barrier for Advanced Technology | -1.0% | Global — SMEs and smaller municipalities worldwide; APAC, Africa, LatAm (most acute) | Short–Medium term (1–3 years) |
| Aging Infrastructure Replacement Backlog | -0.8% | North America (critical); EU (moderate); India (growing) | Medium–Long term (3–6 years) |
| Energy-Intensity of Treatment Operations | -0.6% | Global — APAC (coal-grid dependent); MENA desalination corridor; North America | Medium term (2–4 years) |
| Skilled Workforce Shortage in Water Engineering | -0.5% | North America, EU, Australia (most acute); Africa, South Asia (frontier) | Long term (≥ 4 years) |
| Water Tariff Affordability & Cost-Recovery Gaps | -0.4% | Sub-Saharan Africa, South Asia, LatAm (structural); SE Asia (moderate) | Long term (≥ 4 years) |
Opportunity
Data Center Water Treatment The AI Infrastructure Intersection
Each new hyperscale liquid-cooled facility a 500 MW AI training campus now common among Microsoft, Google, Amazon Web Services, and Meta requires a continuous supply of ultra-pure makeup water at 1–5 megaliters per day at conductivity specifications below 5 µS/cm for closed-loop secondary coolant circuits; at these volumes and quality requirements, the on-site water treatment plant needed to supply, treat, and recirculate the cooling water becomes a USD 8–25 million capital project in its own right, incorporating multi-stage RO, UV sterilization, chemical dosing, heat exchangers, and ZLD brine management for the cooling tower blowdown discharge.
India alone is projected to expand installed data center capacity from 1.5 GW in 2025 to 4.5–6.5 GW by 2030, requiring an estimated 3–4.5 additional gigawatts of liquid-cooled server capacity that will generate USD 200–350 million in cumulative on-site water treatment equipment procurement in India alone through 2030 a market that did not meaningfully exist before 2023 and for which no specialized product category or OEM sales playbook yet exists, creating a genuine first-mover white space for water treatment equipment companies capable of packaging UPW production, cooling water management, and ZLD blowdown treatment as a turnkey data center water utility solution with standardized integration interfaces for HVAC and electrical systems.
Opportunity Impact Analysis
| Opportunity | (~) % Potential CAGR | Geographic Relevance | Execution Window |
|---|---|---|---|
| Water-as-a-Service (WaaS) Subscription Model | +1.5% | North America, EU (early adopters); APAC, LatAm (high-growth) | Short–Medium term (1–3 years) |
| Direct Potable Reuse (DPR) Infrastructure | +1.1% | North America (California, Texas core); Australia; MENA; Israel | Medium term (2–4 years) |
| Decentralized Modular Treatment Systems | +1.0% | Sub-Saharan Africa, South Asia, SE Asia, LatAm rural/peri-urban | Medium term (2–4 years) |
| Data Center Liquid Cooling Water Treatment | +0.8% | North America, EU, India, SE Asia (hyperscaler corridors) | Short term (≤ 2 years) |
| Agricultural Wastewater Reuse Equipment | +0.9% | MENA, India, Southern EU, California, Sub-Saharan Africa | Medium–Long term (2–5 years) |
| Water M&A Roll-Up & Digital Capability Acquisition | +0.5% | North America, EU (deal origination core); APAC (integration target) | Short–Medium term (1–3 years) |
Challenge
Permitting & Regulatory Approval Delays The Execution Timeline Friction Tax
The most operationally pervasive challenge suppressing the water treatment equipment market’s growth velocity is the multi-jurisdictional, multi-agency permitting gauntlet that every water or wastewater treatment project must navigate before a single piece of equipment can be installed and commissioned a bureaucratic friction that systematically adds 12–36 months to project delivery timelines and renders demand backlog a poor proxy for actual revenue realization velocity.
As Fluence Corporation’s 2025 risk analysis confirmed, permitting delays “add costs or cancel projects” routinely in 2026 environments where communities face tight timelines and mounting infrastructure needs; a high-complexity, multi-stage water treatment facility in India requires sequential clearances across the State Pollution Control Board, the Ministry of Environment and Forest, local municipal authority approvals, fire safety certifications, and if using imported equipment MNRE or BIS product registration; the end-to-end permitting period for a new 50 MLD STP in India runs 18–28 months in practice, well above the 6–9 month design timeline, consuming 30–40% of the total project budget in pre-commissioning holding costs.
In South Asia and LatAm, land acquisition disputes one of the primary delay vectors identified in a 2025 ASCE risk analysis of water infrastructure projects account for an additional 6–18 months of timeline friction at a frequency affecting approximately 35–45% of all greenfield treatment plant projects; even in mature regulatory environments like North America and the EU, PFAS remediation system permitting requires demonstration of compliance with MCL thresholds that use monitoring methodologies which take 12–18 months of baseline sampling to establish before a technology selection and procurement process can begin.
Challenges Impact Analysis
| Challenge | (~) % CAGR Friction Drag | Geographic Relevance | Mitigation Horizon |
|---|---|---|---|
| Permitting & Regulatory Approval Delays | -1.2% | Global — India, LatAm, MENA (most acute); North America, EU (moderate) | Medium term (2–4 years) |
| Membrane Fouling & Performance Degradation | -0.9% | Global — APAC brackish/saline zones; MENA SWRO; North America industrial | Long term (≥ 4 years) |
| OT/IT Cybersecurity Vulnerability in SCADA | -0.7% | North America, EU (high-exposure); APAC smart-city corridors; developing markets | Medium–Long term (3–5 years) |
| Emerging Contaminant Compliance Uncertainty | -0.7% | North America (PFAS MCL core); EU (Directive 2026/805); global spill-over | Medium term (2–4 years) |
| Climate-Driven Operational Disruptions | -0.5% | APAC coastal/monsoon zones; MENA drought belt; North America flood/drought corridors | Long term (≥ 4 years) |
| Supply Chain Lead-Time & Materials Volatility | -0.4% | Global — North America, EU (procurement core); APAC manufacturing origin | Short–Medium term (1–3 years) |
Geopolitical Impact Analysis
Supply Chain Fragmentation and Water Security Nationalism Reshaping Global Treatment Equipment Trade Flows.
Geopolitics is becoming an important aspect when it comes to capital flows, supply chain and technology access in the water and wastewater treatment equipment market. Water security has now become a major issue since the UN listed water stress in its report on Global Risks in 2024 as a top-5 risk for the world and since there are already more than 40 countries whose borders are shared in transboundary river basins facing diplomatic tension regarding water resources allocation and have to develop faster their own water treatment equipment infrastructure.
US-China trade frictions include duties on pressure vessels, pump systems and membrane modules thus raising costs for equipment purchases for North American utilities. Chinese dominance in supplying polyamide and polysulfone means that there is an underlying risk in supply chain for water technologies in the West. More than half of water technology executives rate geopolitical risk in their supply chain as the number one issue today.
- Chinese tariffs on goods exported from the US imposed in April 2025 led to procurement localization efforts made by North American and European utilities while BRI, USAID and EU Global Gateway financing helped mitigate friction to some extent through infrastructure investments in Africa and Southeast Asia.
Regional Analysis
North America Dominates the Global Market with 38.9% Revenue Share in 2025.
In 2025, North America held a dominant position in the Water and Wastewater Treatment Equipment Market, capturing more than a 38.9% share and reaching USD 30.4 billion. Regional leadership was supported by established municipal networks, strict water-quality rules, aging treatment assets, and investment in plant modernization.
- The U.S. Environmental Protection Agency estimates that drinking-water systems require USD 625 billion over 20 years for treatment plants, pipelines, storage, and related infrastructure. Federal support also remains substantial, with more than USD 50 billion allocated through the Infrastructure Investment and Jobs Act for drinking-water, wastewater, and stormwater improvements.
Canada is strengthening regional equipment demand. In March 2025, the federal government announced more than CAD 369.57 million through the Canada Housing Infrastructure Fund for water and wastewater projects. This spending supports filtration, pumping, disinfection, sludge treatment, membrane systems, and monitoring equipment across expanding communities
Key Regions and Countries Covered
North America
- U.S
- Canada
Europe
- Germany
- France
- K.
- Italy
- Spain
- Russia & CIS
- Rest of Europe
Asia Pacific
- China
- Japan
- South Korea
- India
- ASEAN
- Rest of Asia Pacific
Latin America
- Brazil
- Mexico
- Rest of Latin America
Middle East & Africa
- GCC Countries
- South Africa
- Rest of Middle East & Africa
Key Players Analysis
Water and wastewater treatment equipment manufacturers focus on strengthening technology portfolios, project execution capabilities, and regional service networks to maintain competitive positions. A major priority is the development of advanced filtration, membrane separation, disinfection, sludge dewatering, and digital monitoring systems that improve treatment efficiency, water recovery, and regulatory compliance. Companies continue to invest in modular and energy-efficient equipment, as these systems support faster installation and lower operating costs across municipal and industrial facilities.
Vertical integration with component suppliers, engineering contractors, and treatment plant operators helps manufacturers secure equipment availability and improve project delivery. Strategic expansion in North America, Europe, and Asia Pacific enables companies to serve rising demand from municipal utilities, power plants, refineries, chemical facilities, and food processors. Manufacturers also emphasize automation, predictive maintenance, remote monitoring, and lifecycle services, while forming long-term contracts and technology partnerships to strengthen customer retention and improve their position in high-value treatment applications.
Market Key Players
- Veolia Group
- SUEZ
- Xylem Inc.
- Pentair plc
- Ecolab Inc.
- DuPont
- Evoqua Water Technologies
- Kurita Water Industries Ltd.
- Aquatech International LLC
- Calgon Carbon Corporation
- Danaher Corporation
- Toshiba Water Solutions
- Ecologix Environmental Systems
- Ebara Corporation
- Thermax Limited
- Other Key Players
Key Development
- In March 2026, Xylem Inc extended its intelligent water management system by incorporating artificial intelligence-driven diagnostic capabilities into next-generation membrane filter technology used at municipal scale in North America.
- In February 2026, Veolia Group commissioned a major water recycling facility in Saudi Arabia under a long-term BOOT contract, marking its largest Middle East water treatment infrastructure award to date.
- In January 2026, Pentair plc launched its next-generation modular reverse osmosis system targeting industrial ZLD applications across food and beverage clients in India and Southeast Asia.
Report Scope
| Report Features | Description |
|---|---|
| Market Value (2025) | USD 78.3 Billion |
| Forecast Revenue (2035) | USD 136.0 Billion |
| CAGR (2026-2035) | 5.7% |
| Base Year for Estimation | 2025 |
| Historic Period | 2020–2024 |
| Forecast Period | 2026–2035 |
| Report Coverage | Revenue Forecast, Market Dynamics, Competitive Landscape, Geopolitical Impact, and Recent Developments |
| Segments Covered | By Product Type (Filtration Systems and Media, Membrane Systems, Disinfection Equipment, Sludge Treatment and Dewatering Equipment, Desalination and Other Specialty Equipment), By Process Stage (Primary Treatment Equipment, Secondary/Biological Treatment Equipment, Tertiary and Advanced Treatment Equipment), By Application (Municipal Water Treatment, Municipal Wastewater Treatment, Industrial Water Treatment, Industrial Wastewater Treatment, Commercial and Decentralized Systems), By End-use Industry (Power Generation, Oil & Gas, Refining and Petrochemicals, Chemicals and Pharmaceuticals, Food and Beverage, Pulp & Paper, Mining and Other Industries) |
| Regional Analysis | North America – The US & Canada; Europe – Germany, France, The UK, Spain, Italy, Russia & CIS, Rest of Europe; APAC– China, Japan, South Korea, India, ASEAN & Rest of APAC; Latin America– Brazil, Mexico & Rest of Latin America; Middle East & Africa– GCC, South Africa, & Rest of MEA |
| Competitive Landscape | Veolia Group, SUEZ, Xylem Inc., Pentair plc, Ecolab Inc., DuPont, Evoqua Water Technologies, Kurita Water Industries, Aquatech International, Calgon Carbon, Danaher Corporation, Toshiba Water Solutions, Ecologix Environmental Systems, Ebara Corporation, Thermax Limited |
| Customization Scope | Segment, country, and regional customization, along with company profiling, pricing trends, CAGR updates, competitive benchmarking, and additional application or technology segmentation, can be provided as per client requirements. |
| Purchase Options | We have three licenses to opt for Single User License, Multi-User License (Up to 5 Users), Corporate User License (Unlimited User and Printable PDF) |





































