
Quick Navigation
Report Overview
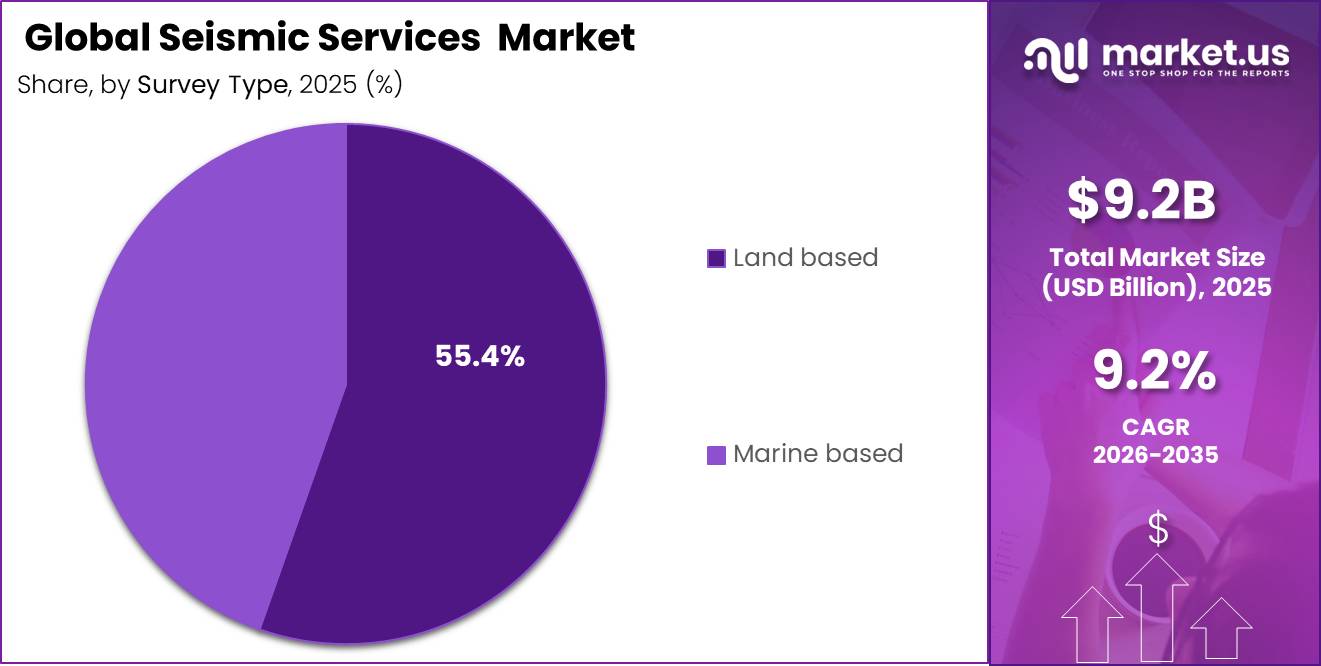
Global Seismic Services Market size is expected to be worth around USD 16.3 Billion by 2035 from USD 9.2 Billion in 2025, growing at a CAGR of 5.9% during the forecast period 2026 to 2035. This trajectory reflects sustained upstream capital allocation toward subsurface imaging, deepwater exploration, and reservoir management across key energy-producing basins globally.
The seismic services market encompasses the acquisition, processing, and interpretation of seismic data used to map subsurface geological structures. Service providers deliver land-based and marine-based survey programs for oil and gas operators, mining companies, and emerging energy applications. The market spans proprietary surveys, multi-client data libraries, and software-driven interpretation platforms.
Key Takeaways
- Global Seismic Services Market was valued at USD 9.2 Billion in 2025.
- The market is forecast to reach USD 16.3 Billion by 2035.
- The market grows at a CAGR of 5.9% from 2026 to 2035.
- Land-based surveys dominate the Survey Type segment with a 55.4% share.
- Oil and gas dominates the End Use segment with a 70.8% share.
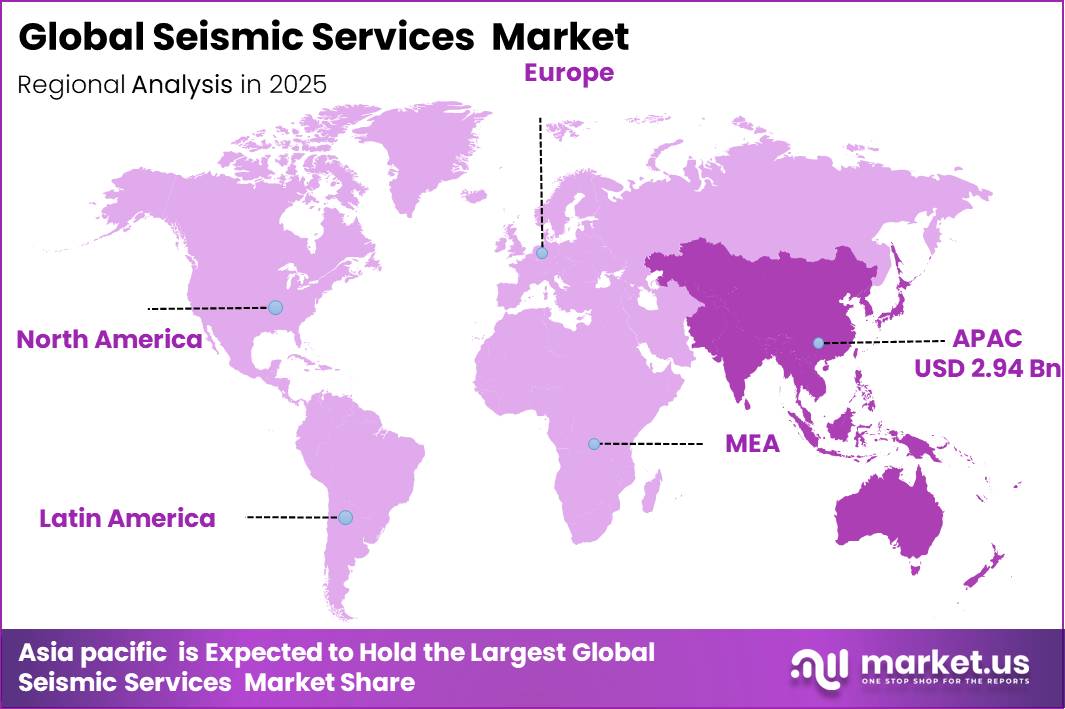
- Asia Pacific leads all regions with a 32.1% share, valued at USD 2.9 Billion.
US offshore leasing has re-entered the planning and execution cycle. The 2024 to 2029 federal program covers approximately 80 million acres across roughly 15,000 unleased blocks in the Gulf, with water depths ranging from 9 feet to more than 11,100 feet. This scale generates a chain of pre-bid screening, post-award proprietary seismic, and near-field appraisal work that directly expands survey backlog for high-end vessel operators.
![[ Global Seismic Services Market ] Market Size Revenue Outlook Chartect](https://market.us/wp-content/uploads/2026/06/Global-Seismic-Services-Market-Market-Size-Revenue-Outlook-Chartect.jpg)
The EU is targeting at least 50 million tonnes per year of CO2 injection capacity by 2030. Global CCUS operational capture capacity has reached 73 Mtpa with nearly 1,300 projects in the pipeline. This pipeline creates a structural requirement for baseline surveys, repeat 4D monitoring, and compliance-grade reporting that seismic firms are positioned to monetize through long-duration contracts rather than one-off exploration campaigns.
Survey Type Analysis
Land-based dominates with 55.4% due to lower mobilization costs and onshore access.
In 2025, Land-based held a dominant market position in the By Survey Type segment of the Seismic Services Market, with a 55.4% share. Onshore survey programs carry lower vessel and logistics costs than marine equivalents. This cost structure attracts exploration-stage operators in emerging basins across Asia Pacific, the Middle East, and Africa, where entry-level subsurface imaging drives the majority of early-phase drilling decisions.
Marine-based surveys account for the remaining share of the Survey Type segment. Offshore programs command premium day rates because high-spec vessels, ocean-bottom nodes, and streamer arrays carry higher capital and operating costs. This premium pricing supports stronger per-survey revenue for contractors with modern fleets, particularly in deepwater basins where imaging resolution directly affects well-placement risk.
End Use Analysis
Oil and gas dominates with 70.8% due to upstream capital intensity and exploration depth.
In 2025, Oil and gas held a dominant market position in the By End Use segment of the Seismic Services Market, with a 70.8% share. Upstream operators depend on seismic data to rank acreage, reduce drilling risk, and manage producing reservoirs through 4D repeat imaging. This dependency makes seismic services a non-discretionary line item in most offshore and frontier exploration programs, protecting revenue even during moderate E&P budget cycles.
Mining held a 29.2% share of the End Use segment in 2025. Passive seismic and reflection techniques help mining operators identify ore bodies, map fault structures, and reduce drilling waste in hard-rock environments. This segment offers a structural diversification pathway for seismic contractors looking to reduce their direct exposure to oil price volatility while serving a capital-intensive minerals industry.
Key Market Segments
By Survey Type
- Land-based
- Marine-based
By End Use
- Oil and gas
- Mining
- Others
Regional Analysis
Asia Pacific Dominates the Seismic Services Market with a Market Share of 32.1%, Valued at USD 2.9 Billion
Asia Pacific commands the largest regional share at 32.1%, valued at USD 2.9 Billion in 2025. Energy demand growth across China, India, and Southeast Asia drives continued upstream investment in offshore and onshore basins. National oil companies in the region maintain active drilling programs, sustaining survey demand across both proprietary acquisition and multi-client data licensing.
North America holds a structurally significant position driven by Gulf of America deepwater activity and the reactivation of federal lease programs. The 2024 to 2029 offshore leasing cycle targets roughly 80 million acres across approximately 15,000 unleased blocks. This reactivation creates direct demand for modern 3D and 4D seismic acquisition, particularly where operators need high-resolution imaging to justify deepwater well commitments.
Europe benefits from North Sea brownfield reinvestment and a growing CCUS monitoring requirement tied to EU decarbonization targets. The region is a near-term recipient of CCS-linked seismic demand as operators prepare baseline surveys and repeat monitoring programs for permitted CO2 storage sites. This compliance-driven workload supports consistent contract flow regardless of short-term oil price fluctuations.
Latin America, anchored by Brazil, presents one of the highest-growth offshore corridors in the forecast period. Upstream growth in Brazil and West Africa is expected to outpace North America and the Middle East through 2026, tilting the global backlog mix toward frontier deepwater and brownfield extension surveys. This geography benefits high-end vessel operators and node-based acquisition specialists directly.
Key Regions and Countries
North America
- US
- Canada
Europe
- Germany
- France
- The UK
- Spain
- Italy
- Rest of Europe
Asia Pacific
- China
- Japan
- South Korea
- India
- Australia
- Rest of APAC
Latin America
- Brazil
- Mexico
- Rest of Latin America
Middle East and Africa
- GCC
- South Africa
- Rest of MEA
Drivers
US offshore leasing has re-entered active execution with the 2024 to 2029 program targeting approximately 80 million acres across roughly 15,000 unleased Gulf blocks in water depths from 9 feet to over 11,100 feet. New lease rounds generate pre-bid screening, post-award proprietary seismic, and near-field appraisal work. Operators in deepwater environments need modern imaging to rank blocks and reduce well-placement risk where drilling costs are highly sensitive to success rates.
Brazil and West Africa show stronger 2026 upstream growth than North America or the Middle East, shifting the global backlog toward offshore frontier and brownfield extension surveys. This geography raises day-rate resilience for high-spec vessels and node crews. Seismic contractors with modern marine capacity gain direct revenue upside as operators in these basins accelerate subsurface characterization ahead of major drilling commitments.
| Driver | (~) % Impact on CAGR Forecast | Geographic Relevance | Impact Timeline |
|---|---|---|---|
| LNG-linked offshore exploration and gas appraisal uplift | +2.2% | North America core, Qatar-linked Middle East, East Africa, South America spill-over | Short term (≤ 2 years) |
| Gulf and deepwater lease reactivation expanding survey backlog | +1.8% | US Gulf core, Brazil, West Africa, South America spill-over | Short term (≤ 2 years) |
| CCUS reservoir monitoring and 4D compliance surveys | +1.4% | North Sea core, EU, North America emerging hubs | Medium term (2-4 years) |
| Shift to high-resolution OBN and repeat 4D imaging | +1.6% | North America offshore, Brazil, North Sea, India and Europe corridors | Medium term (2-4 years) |
| Multi-client library monetization and vessel utilization recovery | +1.1% | North America core, Brazil, Europe, APAC selected basins | Short term (≤ 2 years) |
| Offshore wind and civil geophysical site characterization diversification | +0.9% | Northern Europe core, Baltics, UK, Southeast Asia corridors | Medium term (2-4 years) |
Restraints
Environmental permitting is the most immediate execution restraint in the seismic services market. NOAA’s 2026 framework for Gulf geophysical activity subjects surveys to multi-year incidental-take regulations, formal Letters of Authorization, and mandatory monitoring obligations. A 30 to 90-day approval slippage can erase a meaningful portion of a 4 to 6-month offshore campaign, costing contractors valuable operating windows.
Vessel day rates remain payable during idle or partially idle periods caused by permitting delays. This exposure compresses project EBITDA by 300 to 700 basis points per affected campaign. The permitting bottleneck does not eliminate survey demand but repeatedly delays revenue recognition and raises compliance cost per survey kilometer, creating a structural drag of approximately -1.3 percentage points on the market CAGR.
| Restraint | (~) % Impact on CAGR Forecast | Geographic Relevance | Impact Timeline |
|---|---|---|---|
| Permitting and marine-fauna compliance | -1.3% | North America core, North Sea, Australia, Brazil | Short term (≤ 2 years) |
| E&P budget volatility | -1.1% | Global, acute in North America offshore, LatAm, West Africa | Medium term (2-4 years) |
| Tight high-spec vessel and equipment supply | -0.9% | North Sea, Brazil, Gulf of America, APAC offshore | Short term (≤ 2 years) |
| Tariff and import-cost inflation | -0.6% | U.S.-linked supply chains, North America core, selective APAC | Medium term (2-4 years) |
| Offshore project deferrals from licensing overlap | -0.8% | Brazil, North Sea, Australia, frontier APAC corridors | Medium term (2-4 years) |
| Multi-client monetization risk | -0.7% | North Sea, Latin America, frontier Africa, APAC basins | Long term (≥ 4 years) |
Challenges
The seismic sector faces a human-capital squeeze driven by demographic attrition and prior downcycle departures. US labor data shows only approximately 1,200 annual petroleum-engineer openings and roughly 2,000 annual geoscientist openings, largely tied to replacement rather than pipeline expansion. Experienced interpreters and processing specialists have moved into adjacent digital, mining, and energy-transition roles, thinning the middle layer of 10 to 20-year specialists.
This talent gap stretches interpretation turnaround by 2 to 5 weeks on complex 3D and 4D campaigns and pushes senior technical compensation up by an estimated 6% to 10% annually in hubs such as Houston, Oslo, Dubai, and Singapore. Companies need heavier automation in imaging workflows and centralized expert pools. The shortage is a demographic and career-perception issue that normal hiring alone is unlikely to resolve before the end of the decade.
| Challenge | (~) % CAGR Friction Drag | Geographic Relevance | Mitigation Horizon |
|---|---|---|---|
| Vessel Capacity Tightness | -1.1% | Atlantic basins, Brazil, India, West Africa | Medium term (2-4 years) |
| Geoscience Talent Thinning | -0.8% | North America core, North Sea, Middle East, APAC hubs | Long term (≥ 4 years) |
| Permitting Noise Scrutiny | -0.7% | EU regulatory hubs, North America offshore, Australia | Medium term (2-4 years) |
| High-Density Survey Inflation | -1.4% | Deepwater Brazil, Gulf of Mexico, North Sea, East Med | Long term (≥ 4 years) |
| E&P Budget Timing Swings | -0.9% | Global offshore portfolio markets | Short term (≤ 2 years) |
| Equipment Input Cost Drift | -0.6% | U.S. import channels, EU yards, APAC build chain | Medium term (2-4 years) |
Opportunities
Carbon capture and storage monitoring is an early-stage but structurally expanding opportunity for seismic firms. The EU targets at least 50 million tonnes per year of CO2 injection capacity by 2030, while global CCUS operational capture capacity has reached 73 Mtpa with nearly 1,300 projects in the pipeline. This creates demand for baseline characterization, plume tracking, caprock surveillance, and compliance-grade reporting that is not yet fully monetized.
A single CCS storage asset requires baseline surveys, pre-injection imaging, plume monitoring, and ongoing regulatory verification across its operational life. This shift lifts revenue per site by 2.0x to 3.5x compared to one-off exploration surveys and improves margins by 300 to 600 basis points through higher software and interpretation intensity. Firms that develop standardized monitoring packages and insurer-grade verification frameworks convert seismic capability into long-duration compliance infrastructure.
| Opportunity | (~) % Potential CAGR Upside | Geographic Relevance | Execution Window |
|---|---|---|---|
| CCS MMV platforms | +2.4% | EU, North America core, Middle East | Short term (≤ 2 years) |
| Offshore wind site intel | +1.8% | North Sea, US Atlantic, APAC emerging | Short term (≤ 2 years) |
| Natural hydrogen imaging | +1.3% | EU, MENA, Australia, Southern Africa | Medium term (2-4 years) |
| Mining passive seismic | +1.5% | Australia, Canada, LATAM, Africa | Medium term (2-4 years) |
| Monitoring-as-a-service | +2.0% | North America, EU, APAC developed | Medium term (2-4 years) |
| Data-library roll-ups | +1.1% | North America, Brazil, West Africa, North Sea | Long term (≥ 4 years) |
Key Company Insights
Abitibi Geophysics focuses on mineral exploration geophysics, positioning itself in the mining and base-metals segment where passive seismic and borehole techniques support ore-body delineation. This specialization insulates the company from oil price volatility. However, its narrow sector focus limits revenue diversification into the higher-volume oil and gas acquisition segment that drives 70.8% of overall seismic market demand. URL UNVERIFIED — flag for human review.
China Oilfield Services Limited operates as a fully integrated oilfield services provider backed by CNOOC, giving it preferential access to Chinese national oil company contracts and Asia Pacific survey programs. Asia Pacific holds a 32.1% regional market share, making this structural alignment a durable revenue advantage. By contrast, its dependence on state-directed capital allocation creates vulnerability during periods of Chinese upstream budget restraint.
Key Players
- Abitibi Geophysics
- China Oilfield Services Limited
- Dawson Geophysical Company
- EGS (International) Ltd
- Fugro
- Getech Group plc
- Gardline Limited
- Halliburton
- Paradigm Group B.V.
- SLB
- SAExploration
- Spectrum Geophysics
- TGS
- Weatherford
- Other Key Players
Report Scope
| Report Features | Description |
|---|---|
| Market Value (2025) | USD 9.2 Billion |
| Forecast Revenue (2035) | USD 16.3 Billion |
| CAGR (2026-2035) | 5.9% |
| Base Year for Estimation | 2025 |
| Historic Period | 2020-2024 |
| Forecast Period | 2026-2035 |
| Report Coverage | Revenue Forecast, Market Dynamics, Market Opportunity Analysis, Technology and Innovation Landscape, Competitive Landscape, Recent Developments |
| Segments Covered | By Survey Type (Land-based, Marine-based); By End Use (Oil and gas, Mining, Others) |
| Regional Analysis | North America (US and Canada), Europe (Germany, France, The UK, Spain, Italy, and Rest of Europe), Asia Pacific (China, Japan, South Korea, India, Australia, and Rest of APAC), Latin America (Brazil, Mexico, and Rest of Latin America), Middle East and Africa (GCC, South Africa, and Rest of MEA) |
| Competitive Landscape | Abitibi Geophysics, China Oilfield Services Limited, Dawson Geophysical Company, EGS (International) Ltd, Fugro, Getech Group plc, Gardline Limited, Halliburton, Paradigm Group B.V., SLB, SAExploration, Spectrum Geophysics, TGS, Weatherford, Other Key Players |
| Customization Scope | Customization for segments, region/country-level will be provided. Additional customization can be done based on requirements. |
| Purchase Options | We have three licenses to opt for: Single User License, Multi-User License (Up to 5 Users), Corporate Use License (Unlimited User and Printable PDF) |


