


Report Overview
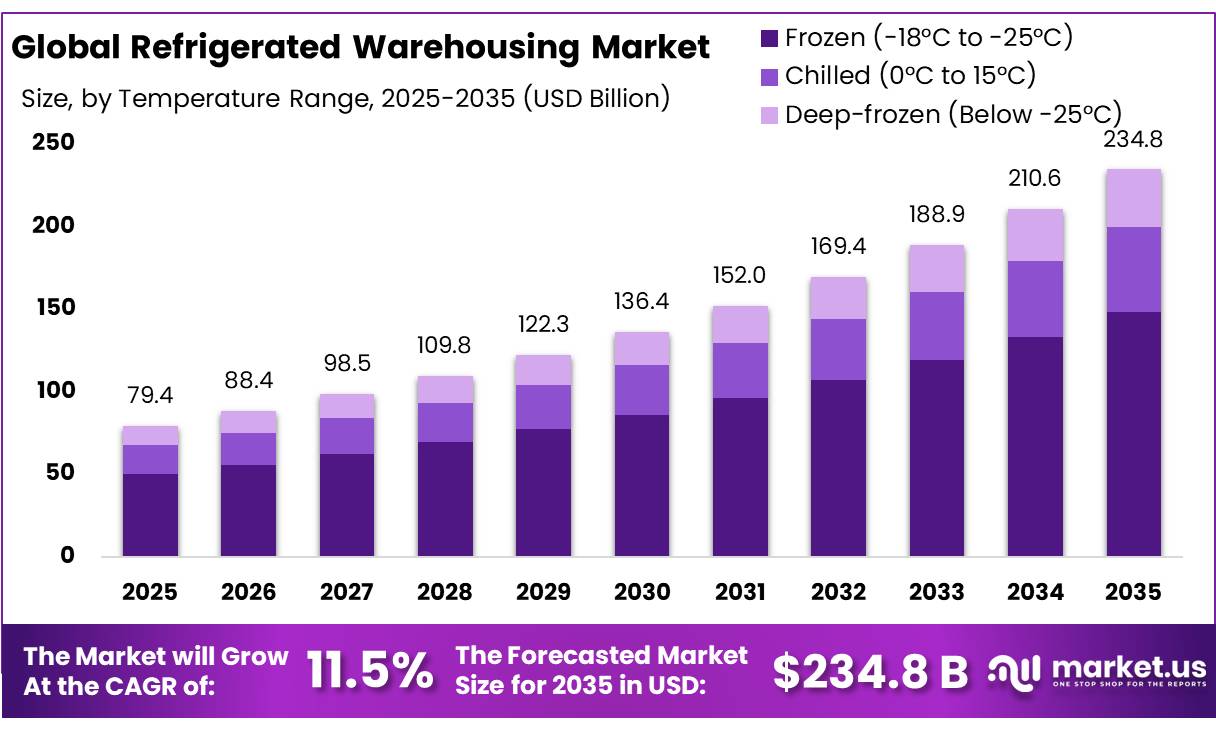
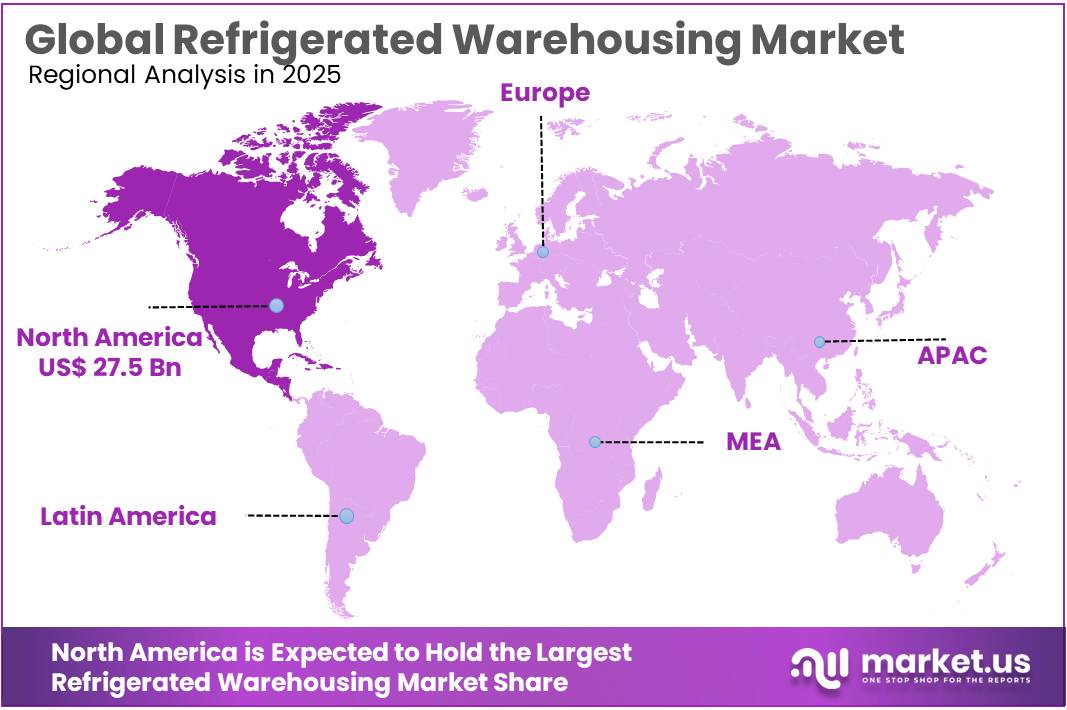
The Global Refrigerated Warehousing Market size is expected to be worth around USD 234.8 Billion by 2035, from USD 79.4 Billion in 2025, growing at a CAGR of 11.5% during the forecast period from 2026 to 2035. In 2025, North America held a dominant market position, capturing more than a 34.78% share, holding USD 27.5 Billion revenue.
Refrigerated warehousing is an important part of the cold chain industry, providing temperature-controlled storage for perishable food, meat, seafood, dairy products, fruits, vegetables, frozen goods and selected pharmaceutical products. These facilities use refrigeration systems, insulated structures, temperature sensors and inventory management technology to maintain product quality during storage and distribution. Warehouses may operate as public facilities serving multiple customers or as private facilities dedicated to a company’s own supply chain.
- According to the United States Department of Agriculture (USDA), the country had 931 refrigerated warehouses on October 1, 2025, with gross storage capacity of 3.99 billion cubic feet and usable capacity of 3.25 billion cubic feet. Public warehouses accounted for 2.46 billion cubic feet, representing 62% of total gross capacity. Freezer space made up 79% of usable refrigerated space, reflecting the importance of frozen food storage. These figures illustrate the scale of commercial cold-storage infrastructure and the role of warehousing in food distribution.
A major driver is the need to preserve food and limit losses between production and consumption. The Food and Agriculture Organization (FAO) reported in March 2026 that approximately 526 million tonnes of food, equal to around 12% of the global total, are lost or wasted due to insufficient refrigeration. This highlights the importance of reliable cold storage, rapid cooling after harvest and uninterrupted temperature control during transportation. Growth in frozen foods, ready-to-eat meals, seafood distribution and organized grocery retail further supports demand for modern warehousing facilities.
Operators are increasingly focused on energy-efficient compressors, improved temperature monitoring, automated storage systems and refrigerants with lower environmental impact. The International Energy Agency’s Energy Efficiency 2025 report highlights the wider importance of energy efficiency for affordability, competitiveness and energy security. These priorities are relevant to cold-storage operators seeking to manage operating expenses and reduce emissions.
Key Takeaways
- Refrigerated Warehousing Market size is expected to be worth around USD 234.8 Billion by 2035, from USD 79.4 Billion in 2025, growing at a CAGR of 11.5%.
- Public held a dominant market position, capturing more than a 66.56% share.
- Frozen (-18°C to -25°C) held a dominant market position, capturing more than a 63.00% share.
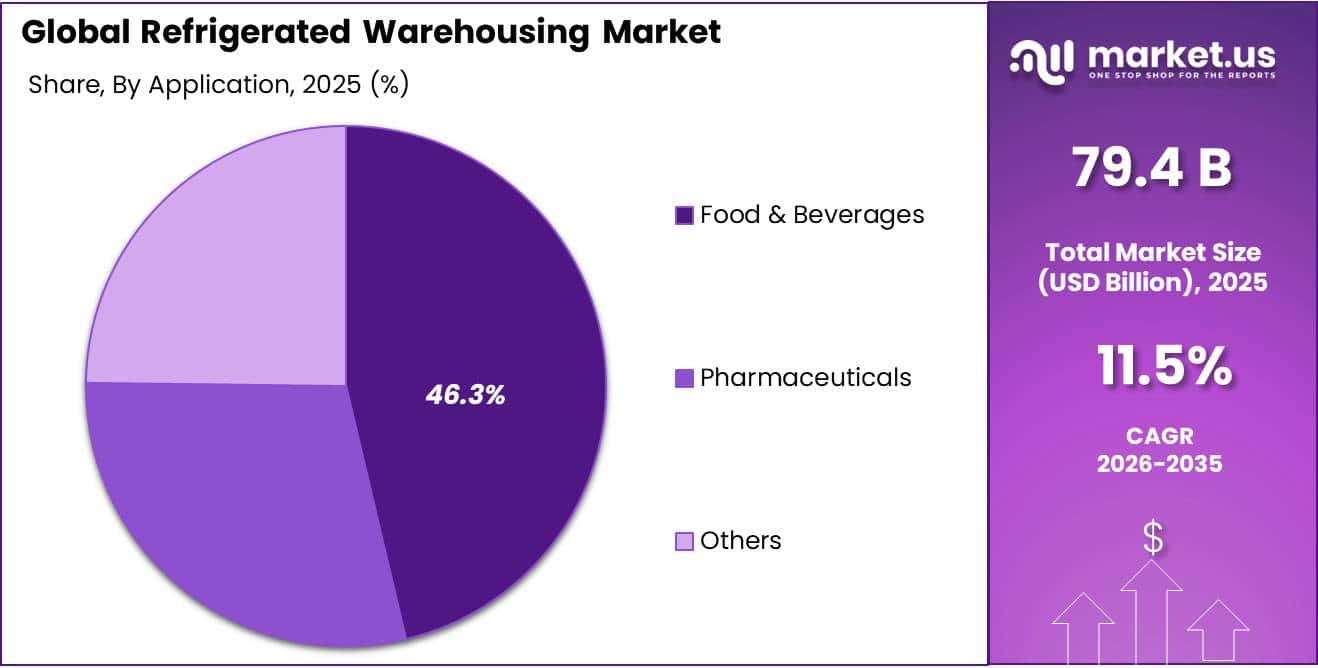
- Food & Beverages held a dominant market position, capturing more than a 46.34% share.
- North America held the dominant position in the refrigerated warehousing market, accounting for 34.78% and a market value of USD 27.5 billion.
By Type Analysis
Public Warehouses Lead Due to Their Larger Share of Commercial Cold-Storage Capacity
In 2025, “Public” held a dominant market position, capturing more than a 66.56% share, according to the supplied market data. Public refrigerated warehouses provide temperature-controlled storage services to multiple customers, including food processors, retailers, distributors and importers. Their flexible storage services help businesses manage seasonal demand and avoid the cost of operating dedicated facilities.
- According to the United States Department of Agriculture (USDA), the United States had 476 public refrigerated warehouses as of October 1, 2025, with gross storage capacity of 2.46 billion cubic feet, representing approximately 61.6% of the national total. The supplied 66.56% market share and the USDA’s capacity-based percentage measure different things.
In 2025, USDA data recorded 455 private and semi-private refrigerated warehouses in the United States, with gross capacity of approximately 1.53 billion cubic feet, equal to 38.4% of total national refrigerated warehouse capacity. The report also recorded 1.22 billion cubic feet of usable capacity for these facilities. Their role is important for food manufacturers and processors that require consistent storage for frozen and chilled products.
By Nature Analysis
Frozen Storage Dominates Due to Strong Demand for Long-Term Frozen Food Preservation
In 2025, “Frozen (-18°C to -25°C)” held a dominant market position, capturing more than a 63.00% share, according to the supplied market data. Frozen refrigerated warehouses support the storage of meat, seafood, frozen vegetables, ready meals and other temperature-sensitive products that require consistently low temperatures.
- The United States Department of Agriculture (USDA) reported that, on October 1, 2025, the United States had 3.25 billion cubic feet of usable refrigerated warehouse capacity, of which 79% was freezer space, equivalent to approximately 2.56 billion cubic feet. This government data highlights the importance of frozen storage in the cold-chain industry, although the USDA figure covers freezer capacity and does not specifically measure the market share of the stated temperature band.
Chilled (0°C to 15°C) refrigerated warehousing serves products such as fresh produce, dairy, meat and other perishable foods that require controlled temperatures without being frozen. These facilities help maintain freshness during storage and distribution while supporting retailers, food processors and wholesalers.
- According to the USDA’s 2025 warehouse capacity report, cooler space represented 21% of usable refrigerated capacity in the United States, or approximately 0.69 billion cubic feet. This provides a government-backed indication of the scale of chilled and cooler storage infrastructure. The USDA category does not exactly match the full 0°C to 15°C range, so the figure should be treated as a related capacity indicator rather than a direct market-share estimate.
By Distribution Channel Analysis
Food & Beverages Lead Due to the Need for Reliable Cold Storage Across the Food Supply Chain
In 2025, “Food & Beverages” held a dominant market position, capturing more than a 46.34% share, according to the supplied market data. Refrigerated warehouses play an important role in preserving meat, dairy products, seafood, frozen foods, fruits and vegetables before these products reach retailers and consumers. Demand is supported by food processing, supermarket distribution and the need to maintain product quality during storage and transportation. According to the United States Department of Agriculture (USDA), the United States had 3.25 billion cubic feet of usable refrigerated warehouse capacity in 2025.
Pharmaceuticals require refrigerated warehousing for selected vaccines, biologic medicines and other temperature-sensitive products. These facilities help maintain specified storage conditions, support inventory management and reduce the risk of product damage caused by temperature changes. Requirements differ by product, so storage operators must follow manufacturer instructions and applicable regulatory standards rather than applying one temperature range to all medicines. In the United States, the Food and Drug Administration (FDA) monitors drug and biologics manufacturing facilities through its inspection programs. Its fiscal year 2025 inspection dashboards provide official information on inspections related to human drugs and biologics.
Key Market Segments
By Type
- Private & Semi-Private
- Public
By Temperature Range
- Chilled (0°C to 15°C)
- Frozen (-18°C to -25°C)
- Deep-frozen (Below -25°C)
By Application
- Food & Beverages
- Pharmaceuticals
- Others
Driver Analysis
Frozen Food Growth and Omnichannel Grocery Demand
U.S. frozen food retail sales reached $87 billion in the 52 weeks to September 2025, more than 45% above 2019. Frozen processed meat and poultry more than doubled to $8 billion, and nearly 90% of online shoppers ordered frozen food digitally, up from 82% in 2020. Core frozen users now make up 40% of shoppers, up from 35% in 2019, and nearly 30% plan to buy more. China’s cold chain demand reached 381.4 million tonnes in 2025, up 4.50%, and revenue reached RMB 556.71 billion.
The federation credits instant retail and hour-level delivery for the new demand. In India, the five largest quick commerce platforms added about 900 dark stores in April to June 2026, reaching about 6,500. Swiggy Instamart alone grew its network from 1.95 million to 4.79 million sq ft between Q2 FY25 and Q3 FY26. Storage is moving away from long-stay bulk freezer space toward fast-moving, multi-temperature distribution centers and small city-based chilled and frozen nodes. As a result, more operator revenue comes from per-pallet handling, case picking and value-added services than from plain storage rent.
Drivers Impact Analysis
| Driver | (~) % Impact on CAGR | Geographic Relevance | Impact Timeline |
|---|---|---|---|
| Frozen food growth and omnichannel grocery demand | +1.3% | North America core, China, India metros | Short term (≤ 2 years) |
| Biologics and GLP-1 pharma cold chain scale-up | +1.1% | North America, EU, India pharma hubs | Medium term (2-4 years) |
| State-funded post-harvest cold chain buildout | +1.5% | India, China, Southeast Asia spill-over | Long term (≥ 4 years) |
| GCC food security and port-linked cold hubs | +0.6% | Saudi Arabia, UAE, MENA spill-over | Medium term (2-4 years) |
| Automation-led replacement of aging capacity | +0.9% | North America core, EU, APAC | Medium term (2-4 years) |
| Refrigerant phase-down and traceability compliance | +0.7% | US, EU, Canada and Mexico exporters | Long term (≥ 4 years) |
Restraint Analysis
Speculative Oversupply and Record Vacancy
Speculative building in 2023 to 2025 delivered more than 24 million sq ft, including a record of about 10 million sq ft in 2025. U.S. cold storage vacancy rose from 4.4% in Q1 2024 to 7.7% in Q2 2026, the highest in more than 20 years. Move-outs of about 56 million cubic feet against 41 million cubic feet delivered produced the first negative first-half net absorption since 2007. The overhang is split by building age. 2025 deliveries were still 23.3% available and post-2020 stock 12.0% available, while 2010 to 2019 stock was only 2.5% available.
Lease-up periods for speculative space have stretched to 24 to 36 months, against about 12 months before 2022. Operators are already absorbing the losses. Lineage closed 10 facilities in 2025 and 5 more by August 2026, and Americold took a $309.6 million impairment and is marketing 15 idled sites with about 350,000 pallet positions. Lineage’s share of storage revenue under minimum guarantees slipped to 44.5% from a 46.7% peak, and same-store NOI fell 2.9%. The result is pricing pressure in about 15% of U.S. markets, shorter renewal terms and fewer speculative starts, which holds back revenue per pallet until the surplus clears, likely around 2027.
Restraint Impact Analysis
| Restraint | (~) % Impact on CAGR | Geographic Relevance | Impact Timeline |
|---|---|---|---|
| Speculative oversupply and record vacancy | -1.4% | North America core | Short term (≤ 2 years) |
| High capex intensity and tighter financing | -1.0% | North America, EU, APAC tier-2 | Medium term (2-4 years) |
| Power price inflation and grid strain | -0.8% | U.S. PJM and West, India, EU | Medium term (2-4 years) |
| Trade policy volatility in protein flows | -0.7% | U.S. ports, China, Mexico corridors | Short term (≤ 2 years) |
| Labor inflation and ammonia safety compliance | -0.6% | North America, EU | Short term (≤ 2 years) |
| Commodity-skewed, underused capacity in emerging markets | -0.5% | India core, South and Southeast Asia | Long term (≥ 4 years) |
Opportunity Analysis
Roll-up and Upgrade of Legacy Cold Stock
Legacy stock is not a growth driver today; it is where vacancy is concentrated. Buildings completed before 2006 hold 221 million sq ft, or 70.8% of U.S. inventory, and half of all buildings are rated Class C. Older buildings trade at $100 to $200 per sq ft, against $300 to $700 for modern or credit-anchored product (MMCG Invest). The two listed operators are about to put more supply on the private market. Lineage’s $1 billion-plus divestiture program and Americold’s 15 idled sites, totaling about 3.2 million sq ft and 350,000 pallet positions, could release another 3 to 5 million sq ft (MMCG Invest).
The gap between public and private pricing shows the value on offer. Americold’s EQT joint venture priced at a 7.0% cap rate and about $3,300 per pallet position, against about $1,500 per pallet implied by public market values (MMCG Invest). On my own estimate, a buyer paying $150 per sq ft and spending $80 to $120 per sq ft on racking density, refrigeration controls and doors reaches $230 to $270 per sq ft all-in.
That is below a $200 to $350 per sq ft new freezer once land and 24-month construction carry are counted, and well located 2006 to 2019 stock is only 2.5% available. Modern freezers store 70% to 120% more pallets per sq ft than pre-1990 buildings. Upgrading density can therefore lift revenue per sq ft by 40% to 60% without adding net supply. The opportunity is a private equity or regional platform roll-up timed to buy during peak legacy move-outs in 2026 and 2027.
Opportunity Impact Analysis
| Opportunity | (~) % Potential CAGR | Geographic Relevance | Execution Window |
|---|---|---|---|
| Roll-up and upgrade of legacy cold stock | +0.9% | North America core, EU | Short term (≤ 2 years) |
| Conversion of India’s potato stores to multi-commodity use | +0.7% | India core, South Asia spill-over | Long term (≥ 4 years) |
| Grid flexibility and demand response revenue | +0.6% | U.S. PJM, ERCOT, CAISO, EU, Australia | Short term (≤ 2 years) |
| Cryogenic storage for cell and gene therapies | +0.5% | North America, EU, Japan, Korea | Medium term (2-4 years) |
| U.S.-Mexico border cold hubs | +0.5% | Texas, Arizona, northern Mexico | Short term (≤ 2 years) |
| Paid traceability and data services | +0.4% | U.S., Canada and Mexico exporters, EU | Medium term (2-4 years) |
Challenges Analysis
Refrigeration Technician Talent Gap
The industry needs skilled ammonia and CO2 operators, and that workforce is getting older faster than it is being replaced. The U.S. Bureau of Labor Statistics outlook has HVACR mechanic jobs growing from 425,200 in 2024 to 459,700 in 2034, an 8.1% rise against 3.1% for all occupations. That means about 40,100 openings a year, roughly 36,650 of which only replace people who leave, while only about 23,251 credentials are awarded each year. Industrial refrigeration has it worse.
An IIAR-cited estimate says about 40% of ammonia technicians will retire within 10 years. At some major facilities, 60% of refrigeration staff are already over 50. It takes years to replace them. RETA advises at least 4 years of field experience before the CIRO exam, and certifications must be renewed every 3 years with 24 PDH credits. Each new 250,000 sq ft freezer needs about 4 to 6 certified operators to run across shifts under OSHA PSM. We estimate this adds 6 to 9 months to commissioning in tight labor markets and raises pay for senior operators by 8% to 12% a year.
Operators will need in-house apprenticeships, central remote monitoring that lets one engineer cover 5 to 8 sites, low-charge packaged systems that may fall below the 10,000 lb PSM threshold, and partnerships with technical colleges.
Challenges Impact Analysis
| Challenge | (~) % CAGR Friction | Geographic Relevance | Mitigation Horizon |
|---|---|---|---|
| Refrigeration Technician Talent Gap | -0.8% | North America, Europe, Japan | Long term (≥ 4 years) |
| Refrigerant Transition Execution Risk | -0.7% | U.S., EU, APAC | Medium term (2-4 years) |
| Automation Integration Stranded Risk | -0.6% | North America, Europe | Medium term (2-4 years) |
| Panel Fire Catastrophic Loss | -0.6% | Global, U.S. West Coast | Medium term (2-4 years) |
| Cyber Risk to OT | -0.5% | Global, U.S. grocery chains | Short term (≤ 2 years) |
| Grid Outage and Climate Resilience | -0.5% | U.S. Gulf/Southeast, South Asia | Long term (≥ 4 years) |
Geopolitical Impact Analysis
Impact of the Iran War on the Refrigerated Warehousing Market
The ongoing Iran war is increasing cost and supply-chain risks for the refrigerated warehousing industry. Cold-storage facilities depend on continuous electricity, refrigeration equipment, transport services and reliable deliveries of perishable goods. Disruptions around the Strait of Hormuz have raised energy-price volatility, shipping costs and insurance premiums, increasing pressure on warehouse operators and food distributors. According to the United States Energy Information Administration (EIA), Brent crude oil prices reached US$118 per barrel on April 29, 2026, amid disruptions to oil flows through the Strait of Hormuz.
Higher fuel and electricity costs can increase warehouse operating expenses, while longer shipping routes may delay deliveries of frozen foods, seafood, dairy products and temperature-sensitive medicines. Delays can also increase the risk of spoilage when refrigeration or transport arrangements are disrupted. Smaller operators may face greater pressure because energy and equipment costs can reduce profit margins.
The conflict may also create opportunities for investment in energy-efficient refrigeration, backup power systems, improved insulation and real-time temperature monitoring. Warehousing companies may diversify suppliers, increase inventory buffers and strengthen contingency plans to maintain operations. The overall impact will depend on the duration of the conflict, energy-price movements and the reliability of shipping routes. Companies that improve energy efficiency and supply-chain resilience will be better positioned to manage continuing uncertainty.
Regional Insights
Dominating Region: North America
North America held the dominant position in the refrigerated warehousing market, accounting for 34.78% and a market value of USD 27.5 billion, according to the supplied market data. The region benefits from established food-processing networks, large grocery distribution systems, frozen-food consumption and extensive temperature-controlled logistics infrastructure. The United States is a major contributor to regional storage capacity.
According to the United States Department of Agriculture (USDA), the country had 931 refrigerated warehouses with total gross capacity of approximately 3.99 billion cubic feet as of October 1, 2025. Usable capacity reached 3.25 billion cubic feet, supporting storage and distribution for meat, dairy products, fruits, vegetables and other temperature-sensitive goods. Investment in automated facilities, energy-efficient refrigeration and digital temperature monitoring is expected to remain important as operators seek to control costs and protect product quality.
Asia-Pacific presents significant growth opportunities as food processing, organized retail, online grocery delivery and demand for frozen products expand across the region. Rising urban populations and changing food consumption patterns are encouraging investment in modern cold-storage facilities and temperature-controlled distribution networks. Demand is also supported by the need to preserve seafood, meat, dairy products and fresh produce across longer supply chains. Government-backed food infrastructure programs and private investment can help improve storage capacity and reduce post-harvest losses.
However, a comparable official regional dataset confirming Asia-Pacific as the fastest-growing region specifically for refrigerated warehousing was not identified. Its growth potential is therefore best understood as a market opportunity rather than a verified ranking. Companies expanding in the region are likely to focus on modern refrigeration systems, reliable power supplies, warehouse automation and strategically located facilities near production and distribution hubs.
Key Regions and Countries Insights
- North America
- US
- Canada
- Europe
- Germany
- France
- The UK
- Spain
- Italy
- Rest of Europe
- Asia Pacific
- China
- Japan
- South Korea
- India
- Australia
- Rest of APAC
- Latin America
- Brazil
- Mexico
- Rest of Latin America
- Middle East & Africa
- GCC
- South Africa
- Rest of MEA
Key Players Analysis
Lineage, Inc. operates a large temperature-controlled warehousing and logistics network serving food producers, retailers and distributors. As of December 31, 2025, the company operated 501 warehouses across 19 countries, with approximately 3.1 billion cubic feet of capacity and 88 million square feet of warehouse space. It served more than 11,000 customers and operated 248 port-centric facilities and 83 automated warehouses. In fiscal year 2025, Lineage generated approximately USD 5.355 billion in revenue, supported by warehousing and integrated logistics services.
Conestoga Cold Storage is a Canadian, family-owned cold-chain service provider established in 1974. The company operates 6 automated refrigerated warehouses with more than 87 million cubic feet of storage volume. Its services include blast freezing, refrigerated storage, distribution, cross-docking and inventory management. Its automated systems support accurate product tracking and efficient order handling. In 2025–2026, Conestoga continued highlighting automation and warehouse technology as important parts of its operations, serving food manufacturers, retailers and distributors across Canada.
Americold is a global refrigerated warehousing and temperature-controlled logistics provider serving food producers, processors, retailers and distributors. As of December 31, 2025, the company operated 231 warehouses worldwide, with approximately 1.4 billion cubic feet of capacity and facilities across 4 continents. Its network included 188 warehouses in North America, 23 in Europe, 18 in Asia-Pacific and 2 in South America. In 2025, Americold reported revenue of approximately USD 2.6 billion and focused on automation, customer service and cold-chain efficiency.
Top Key Players Outlook
- Lineage, Inc
- CONESTOGA COLD STORAGE
- Americold
- NewCold
- Burris Logistics
- Tippmann Group
- NICHIREI CORPORATION
- United States Cold Storage
- FreezPak Logistics
- Cole‑Parmer Instrument Company, LLC
- Spectris
- Industrial Test Systems, Inc.
- US WATER SYSTEMS INC
- Bartovation LLC
- Other Key Players
Recent Developments
- In February 2026, NewCold is announced a further investment of more than US$500 million at its Lebanon campus, including a new multi-temperature facility expected to create more than 200 permanent jobs.
- In April 2026, Burris Logistics reported having more than 950 team members across 15 locations, operating through 3 main businesses: Honor Foods, Trinity Logistics and Eagle Business Credit. Its refrigerated warehousing activities support foodservice distributors and businesses that require frozen, chilled and dry product handling, including cross-docking and temperature-controlled delivery.
Report Scope
| Report Features | Description |
|---|---|
| Market Value (2025) | USD 79.4 Bn |
| Forecast Revenue (2035) | USD 234.8 Bn |
| CAGR (2026-2035) | 11.5% |
| Base Year for Estimation | 2025 |
| Historic Period | 2020-2024 |
| Forecast Period | 2026-2035 |
| Report Coverage | Revenue Forecast, Market Dynamics, Competitive Landscape, Recent Developments |
| Segments Covered | By Type (Private & Semi-Private, Public), By Temperature Range (Chilled (0°C to 15°C), Frozen (-18°C to -25°C), Deep-frozen (Below -25°C)), By Application, Food & Beverages, Pharmaceuticals, Others) |
| Regional Analysis | North America – US, Canada; Europe – Germany, France, The UK, Spain, Italy, Rest of Europe; Asia Pacific – China, Japan, South Korea, India, Australia, Singapore, Rest of APAC; Latin America – Brazil, Mexico, Rest of Latin America; Middle East & Africa – GCC, South Africa, Rest of MEA |
| Competitive Landscape | Lineage, Inc, CONESTOGA COLD STORAGE, Americold, NewCold, Burris Logistics, Tippmann Group, NICHIREI CORPORATION, United States Cold Storage, FreezPak Logistics, Cole‑Parmer Instrument Company, LLC, Spectris, Industrial Test Systems, Inc., US WATER SYSTEMS INC, Bartovation LLC, Other Key Players |
| Customization Scope | Customization for segments, region/country-level will be provided. Moreover, additional customization can be done based on the requirements. |
| Purchase Options | We have three licenses to opt for: Single User License, Multi-User License (Up to 5 Users), Corporate Use License (Unlimited User and Printable PDF) |








