


Report Overview
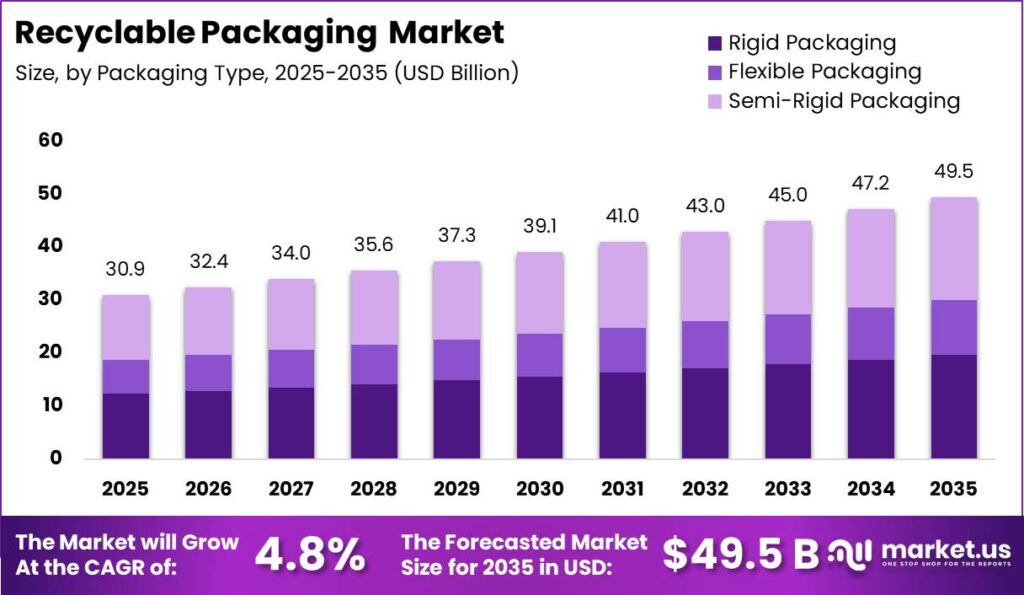
Global Recyclable Packaging Market size is expected to be worth around USD 49.50 Billion by 2035 from USD 30.90 Billion in 2025, growing at a CAGR of 4.8% during the forecast period 2026 to 2035. This trajectory reflects a structural shift toward mono-material and design-for-recycling formats. Buyers now treat recyclability as a purchasing filter, so vendors that certify formats early will lock in long-term supply contracts.
The recyclable packaging market covers paper, plastics, glass, metal, and fiber-based composites converted into rigid, flexible, and semi-rigid formats. This structure spans boxes, pouches, bottles, trays, cans, and films across food, healthcare, and e-commerce use. Therefore product demand tracks end-use conversion cycles, and suppliers aligned to fast-moving consumer goods win repeat volume across multiple packaging categories.
Key Takeaways
- Global Recyclable Packaging market size reached USD 30.90 Billion in 2025 and is projected to hit USD 49.50 Billion by 2035 at a CAGR of 4.8%.
- Paper and Paperboard led the By Material Type segment with a 39.80% share.
- Rigid Packaging dominated the By Packaging Type segment with a 56.40% share.
- Boxes and Cartons led the By Product Type segment with a 31.70% share.
- Food and Beverage led the By Application segment with a 44.90% share.
- Food and Beverage Manufacturers led the By End User segment with a 41.60% share.
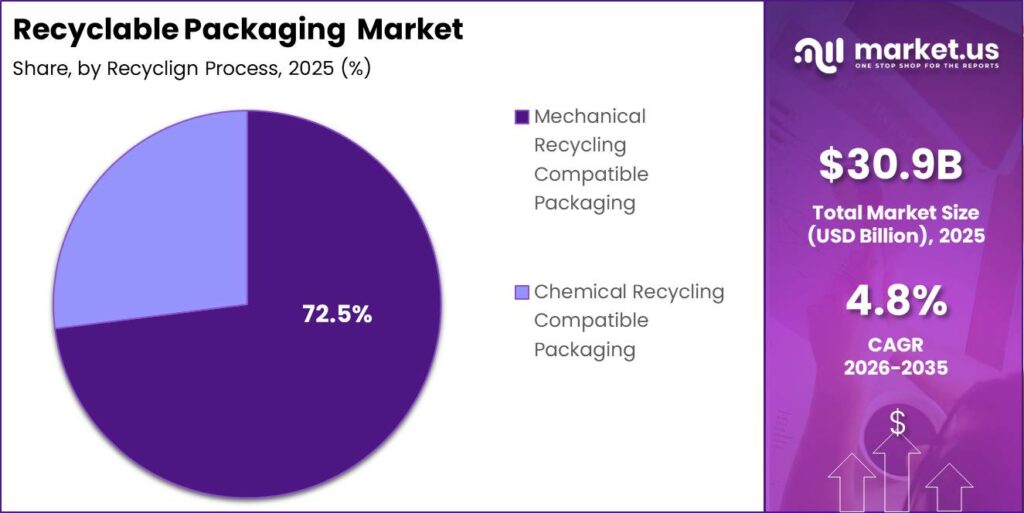
- Mechanical Recycling Compatible Packaging led the By Recycling Process segment with a 72.5% share.
- Direct Sales (B2B) led the By Distribution Channel segment with a 69.20% share.
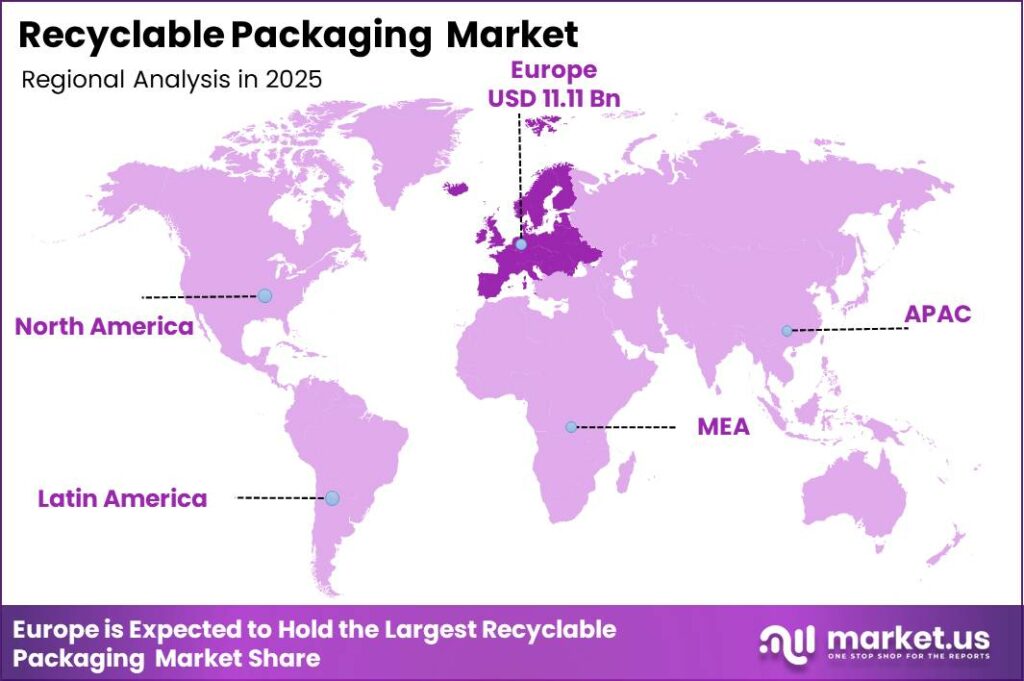
- Europe dominated with a 35.90% share, valued at USD 11.11 Billion.
Government regulation now anchors demand across the sector. Extended Producer Responsibility rules and recyclability thresholds push brand owners to reformulate packaging before compliance deadlines. This creates a compulsory conversion pipeline, so recyclable format suppliers gain predictable multi-year order books rather than one-off pilot volumes from consumer goods clients.
According to Eurostat, plastic accounted for 19% of all packaging waste generated in the European Union in 2022. This concentration marks plastics as the primary regulatory target. Suppliers offering recyclable polymer substitutes can therefore capture displaced volume as brands retire non-recyclable plastic formats to avoid penalty fees.
Data from Eurostat shows plastic packaging waste per capita rose 7.6 kg between 2012 and 2022, while recycled plastic packaging rose only 4.0 kg per capita. This widening gap exposes weak recovery infrastructure. As per our research, the Ellen MacArthur Foundation estimates only about 14% of plastic packaging is collected for recycling globally, so investors backing collection and sorting capacity face large unmet demand.
Material Type Analysis
Paper and Paperboard dominates with 39.80% due to strong fiber recovery and recyclability.
In 2025, Paper and Paperboard held a dominant market position in the By Material Type segment of Recyclable Packaging Market, with a 39.80% share. Figures from Statista show global packaging paper and board production reached 277.9 Million metric tons in 2024. This scale gives paper suppliers cost advantages that recyclable plastics cannot match, so brand owners default to fiber formats when barrier needs allow substitution.
Recyclable Plastics serve as the fastest growing sub-segment because mono-material polyethylene and polypropylene structures now replace multilayer laminates. As reported by Eurostat, the EU recycled 40.7% of its total plastic packaging waste in 2022. This recovery rate signals viable end-of-life value, so converters investing in mono-material lines capture premium contracts from FMCG brands chasing recyclability targets.
Glass and Metal anchor the high-recovery end of the material mix. Data from Eurostat shows metal packaging reached a 76.0% recycling rate and glass packaging achieved a 75.8% recycling rate across the European Union in 2022. These proven rates make both materials safe compliance choices, so premium beverage and food brands adopt them to guarantee verified recyclability claims.
Fiber-Based Composite Materials complete the material group as an emerging category. Mondi celebrated the commercial start-up of its Duino recycled containerboard mill in September 2025, increasing supply of high-quality recycled paper for packaging applications. This capacity expansion strengthens fiber composite availability, so packaging designers gain reliable recycled feedstock for barrier applications previously served by plastic-coated formats.
Packaging Type Analysis
Rigid Packaging dominates with 56.40% due to protection strength and reuse suitability.
In 2025, Rigid Packaging held a dominant market position in the By Packaging Type segment of Recyclable Packaging Market, with a 56.40% share. As per our research, UNECE and FAO data records global paper packaging material production at 55.8 Million tonnes in the latest reporting year. This volume supports the dominance of rigid formats like cartons and bottles, so suppliers with molding and forming capacity secure steady industrial demand.
Flexible Packaging functions as the fastest growing sub-segment because brands shift toward lightweight pouches and films. As per our research, flexible packaging accounts for roughly 35% to 40% of total EU packaging volume by weight. This large base creates a major recyclability conversion opportunity, so converters that solve barrier performance early will capture the fastest revenue growth in the sector.
Semi-Rigid Packaging holds the remaining share by bridging strength and flexibility needs. As per our research, EU packaging waste reached 79.7 Million tonnes in 2023 across all formats. This total waste stream signals scale for trays and semi-rigid tubs, so manufacturers offering recyclable semi-rigid designs gain entry into dairy, produce, and ready-meal categories.
Product Type Analysis
Boxes and Cartons dominate with 31.70% due to widespread e-commerce and retail use.
In 2025, Boxes and Cartons held a dominant market position in the By Product Type segment of Recyclable Packaging Market, with a 31.70% share. As per our research, EU packaging waste reached 177.8 kg per inhabitant in 2023. Corrugated boxes drive a large slice of that volume, so producers of recyclable containerboard win repeat orders from expanding online retail networks.
Pouches and Bags rank as the fastest growing sub-segment because flexible formats reduce material use. As per our research, European plastics production reached 57.2 Million tonnes in 2021, supplying the polymer base for these formats. This feedstock scale supports pouch growth, so early movers in recyclable mono-material pouches gain advantage in snacks and personal care lines.
Bottles and Jars, Trays and Containers, Cans, and Wraps and Films collectively hold the remaining share. As per our research, global paperboard production exceeded 423 Million metric tons in 2024, underpinning carton-based containers. These formats spread across beverage, food, and industrial use, so diversified converters reduce category risk by serving multiple product types at once.
Application Analysis
Food and Beverage dominates with 44.90% due to high volume consumption packaging needs.
In 2025, Food and Beverage held a dominant market position in the By Application segment of Recyclable Packaging Market, with a 44.90% share. As per our research, the average EU resident generated 35.3 kg of plastic packaging waste in 2023, much of it food related. This consumption scale locks food into the largest demand pool, so suppliers focused on food-grade recyclable formats capture the deepest revenue base.
Healthcare and Pharmaceuticals form the fastest growing application because barrier and safety standards tighten. As per our research, EU packaging waste generation fell 8.7 kg per inhabitant in 2023 as reduction rules took hold. This regulatory pressure pushes pharma toward compliant recyclable barrier packs, so vendors solving migration safety win high-margin contracts.
Personal Care, Consumer Electronics, Industrial Packaging, and E-Commerce and Retail hold the remaining application share collectively. As per our research, EU packaging waste per resident rose more than 20% over the decade to 2021, reaching 189 kg. This broad growth spans all end uses, so suppliers serving multiple applications diversify against single-sector demand swings.
End User Analysis
Food and Beverage Manufacturers dominate with 41.60% due to constant high-volume packaging demand.
In 2025, Food and Beverage Manufacturers held a dominant market position in the By End User segment of Recyclable Packaging Market, with a 41.60% share. As per our research, global packaging paper and board output reached 277.9 Million metric tons in 2024, largely feeding this group. This dependence makes food makers the primary buyer, so suppliers offering scaled recyclable supply secure anchor accounts.
Pharmaceutical Companies stand as the fastest growing end user because compliance and safety demand rises. As per our research, EU packaging waste totaled 79.7 Million tonnes in 2023 across producers. This volume signals strong reformulation need in regulated sectors, so vendors with certified barrier solutions gain premium pharma contracts ahead of rivals.
Consumer Goods Companies, E-Commerce Companies, and Industrial Manufacturers hold the remaining end user share collectively. As per our research, EU residents recycled 14.7 kg of plastic packaging per capita in 2022. This partial recovery exposes an untapped base among diversified buyers, so suppliers targeting these groups capture volume as recyclability mandates widen.
Recycling Process Analysis
Mechanical Recycling Compatible Packaging dominates with 63.50% due to mature low-cost recovery infrastructure.
In 2025, Mechanical Recycling Compatible Packaging held a dominant market position in the By Recycling Process segment of Recyclable Packaging Market, with a 72.50% share. As per our research, metal packaging achieved a 76.0% recovery rate in the EU during 2022 through mechanical routes. This proven infrastructure keeps mechanical formats cheapest, so brands default to them for mainstream recyclable claims.
Chemical Recycling Compatible Packaging is the fastest growing process because it unlocks food-grade recycled content. As per our research, EU rules require plastic packaging to contain minimum 30% recycled content by 2030. This mandate creates structural demand for chemically recycled feedstock, so early investors in chemical recycling secure premium offtake positions before capacity tightens.
Distribution Channel Analysis
Direct Sales (B2B) dominates with 69.20% due to high-volume contract manufacturing relationships.
In 2025, Direct Sales (B2B) held a dominant market position in the By Distribution Channel segment of Recyclable Packaging Market, with a 69.20% share. As per our research, global paperboard production topped 423 Million metric tons in 2024, moving mostly through direct contracts. This volume flows through negotiated supply deals, so producers with direct account teams control the bulk of sector revenue.
Packaging Distributors and Online Procurement rank as the fastest growing channel because digital buying spreads. As per our research, European plastics production reached 57.2 Million tonnes in 2021, feeding distributor stock. This supply base supports intermediary growth, so vendors adding online procurement options reach smaller buyers that direct sales teams cannot serve efficiently.
Retail Packaging Suppliers hold the remaining channel share by serving fragmented small-order demand. As per our research, EU packaging waste reached 177.8 kg per inhabitant in 2023. This spread of retail-level consumption keeps this channel relevant, so suppliers with retail-ready recyclable ranges capture niche and regional accounts.
Key Market Segments
By Material Type
- Paper & Paperboard
- Recyclable Plastics
- Glass
- Metal (Aluminum & Steel)
- Fiber-Based Composite Materials
By Packaging Type
- Rigid Packaging
- Flexible Packaging
- Semi-Rigid Packaging
By Product Type
- Boxes & Cartons
- Pouches & Bags
- Bottles & Jars
- Trays & Containers
- Cans
- Wraps & Films
By Application
- Food & Beverage
- Healthcare & Pharmaceuticals
- Personal Care & Cosmetics
- Consumer Electronics
- Industrial Packaging
- E-Commerce & Retail
By End User
- Food & Beverage Manufacturers
- Pharmaceutical Companies
- Consumer Goods Companies
- E-Commerce Companies
- Industrial Manufacturers
By Recycling Process
- Mechanical Recycling Compatible Packaging
- Chemical Recycling Compatible Packaging
By Distribution Channel
- Direct Sales (B2B)
- Packaging Distributors & Online Procurement
- Retail Packaging Suppliers
Regional Analysis
Europe Dominates the Recyclable Packaging Market with a Market Share of 35.90%, Valued at USD 11.11 Billion
Europe leads the recyclable packaging market with a 35.90% share worth USD 11.11 Billion. Strict recyclability rules and mature recovery systems drive this position. Mondi started up its €200 Million recycled containerboard machine at its Duino mill in Italy in April 2025, expanding recyclable corrugated capacity. This investment deepens regional supply, so European converters strengthen their lead in certified recyclable formats.
Asia Pacific ranks as the fastest growing region because manufacturing output and consumption expand together. Rising retail and e-commerce mandates push suppliers to reformulate packaging across China, India, and Southeast Asia. This creates strong conversion demand, so early entrants in the region capture share before local recyclability standards fully mature and competition intensifies.
North America, Latin America, and the Middle East and Africa hold the remaining regional share collectively. Extended Producer Responsibility programs and brand net-zero targets drive adoption across these markets. This spread of regulation broadens the addressable base, so suppliers with multi-region certification capability win contracts from multinational brand owners seeking consistent recyclable supply.
Key Regions and Countries
North America
- US
- Canada
Europe
- Germany
- France
- The UK
- Spain
- Italy
- Rest of Europe
Asia Pacific
- China
- Japan
- South Korea
- India
- Australia
- Rest of APAC
Latin America
- Brazil
- Mexico
- Rest of Latin America
Middle East and Africa
- GCC
- South Africa
- Rest of MEA
Market Dynamics
Market Opportunity Analysis - Underpenetrated flexible formats, emerging regions, and adjacent verticals open entry points for new players
Recyclable Plastics remain underexploited despite fastest-growing status in the By Material Type segment. Mono-material conversion lags the pace regulation requires, leaving demand unmet. This gap favors converters that solve barrier limits early, so new entrants with proven mono-material lines can win share before incumbents fully retool their capacity.
Flexible Packaging offers the widest opening within the By Packaging Type segment as the fastest-growing format. Conversion from laminates runs far below target pace, exposing a large addressable pool. Therefore specialists in recyclable pouches and films can capture accounts that rigid-focused incumbents cannot serve, positioning early movers ahead of slower generalist suppliers.
Asia Pacific stands out as the most underexploited region behind Europe’s 35.90% lead. Regulation and consumption rise together, yet recyclable supply remains thin. This creates first-mover advantage, so investors backing regional capacity can secure demand before local standards harden and larger players enter at scale.
Pharmaceutical Companies form an underpenetrated end user group as the fastest-growing buyer segment. Compliance needs outpace available certified barrier solutions. Consequently vendors that clear migration safety hurdles early gain premium contracts, so focused entrants can build defensible positions in a category most generalist suppliers underserve today.
Technology and Innovation Landscape - Digital watermarking, mono-material design, and paper-based barriers redefine recyclable packaging competitiveness
Mono-material polyethylene and polypropylene structures now replace multilayer laminates across the sector. This shift simplifies sorting and recovery in mechanical streams. As a result, converters that master mono-material design win specification approval faster, so early adopters gain a durable edge over suppliers still reliant on mixed-material formats.
Digital watermarks and smart labeling improve automated waste sorting accuracy. As per our research, the EU’s harmonized labeling framework allows QR codes alongside standardized sorting symbols to raise sorting accuracy. This technology lifts recovery quality, so packaging designers embedding digital sorting cues help brands meet recyclability claims and protect shelf positioning.
Paper-based barrier packaging now replaces plastic-coated formats in commercial use. Design-for-recycling guidelines guide packaging development during product launches. This means suppliers investing in recyclable paper barriers capture demand from brands retiring coated structures, so material innovation directly converts into new contract wins across food and beverage lines.
Drivers
The EU Packaging and Packaging Waste Regulation drives the market through the largest overhaul of packaging law in three decades. Regulation (EU) 2025/40 sets binding recyclability requirements for all packaging on the EU market. Packaging must meet at least Grade C recyclability by 1 January 2030 and Grade B by 1 January 2035. This forces reformulation, so suppliers of compliant recyclable formats gain a compulsory conversion pipeline.
Roughly 40% of packaging formats now circulating in the EU are estimated to fail Grade C standards, including multilayer laminates and carbon-black trays. This means a large share of active specifications must change before 2030. France’s eco-modulation fees range from a +100% surcharge on non-recyclable packaging to a 20% to 50% discount for compliant formats. This creates a per-tonne advantage that pushes brands to convert fast.
| Driver | (~) % Impact on CAGR Forecast | Geographic Relevance | Impact Timeline |
|---|---|---|---|
| EU Packaging & Packaging Waste Regulation (PPWR) Mandating Recyclability Thresholds Across All Packaging Categories | +1.6% | European Union — all 27 member states; direct trade spillover to UK, Switzerland, Turkey, MENA exporters | Short term (≤ 2 years) |
| Corporate Net-Zero & Science-Based Targets (SBTi) Packaging Commitments Driving Mandatory Supplier Transitions | +1.1% | Global, led by United States, Western Europe, Japan, Australia — multinational FMCG & retail supply chains | Short term (≤ 2 years) |
| Extended Producer Responsibility (EPR) Fee Structures Making Recyclable Packaging Economically Preferable to Non-Recyclable | +0.9% | France, Germany, United Kingdom, Canada, India (PWM Rules), Australia | Short term (≤ 2 years) |
| Retail & E-Commerce Sector Packaging Sustainability Mandates Pushing Supplier Specification Changes | +0.6% | United States, Europe, China, India, Southeast Asia | Medium term (2–4 years) |
| Consumer Preference Shift Toward Verified Recyclable Packaging Driving Retail Shelf Conversion | +0.4% | United States, United Kingdom, Germany, France, Australia, Urban India | Medium term (2–4 years) |
Restraints
Recyclable mono-material formats still trail conventional multilayer laminates on barrier performance. Oxygen and moisture protection in recyclable structures remains structurally weaker despite years of research. Ambient and chilled foods needing 12 to 24 month shelf-life require oxygen transmission below 1 to 5 cm³/m²/day. This gap blocks adoption, so brand owners delay commercial rollout in critical food and pharma categories.
Flexible packaging shows the sharpest constraint, making up about 35% to 40% of EU packaging volume by weight. Conversion to recyclable equivalents runs at 4% to 7% per year versus the 15% to 20% pace needed to meet the 2030 threshold. This creates a conversion gap. Brand owners run 6 to 18 month validation trials, so manufacturers absorb trial costs without near-term revenue.
| Restraint | (~) % Impact on CAGR Forecast | Geographic Relevance | Impact Timeline |
|---|---|---|---|
| Recyclable Packaging Performance Gap vs. Conventional Multi-Layer Laminates Blocking Adoption in Critical Food & Pharma Categories | -1.5% | Global, most acute in fresh food, ambient shelf-life, and pharmaceutical barrier packaging segments | Short term (≤ 2 years) |
| Fragmented & Inconsistent National Recycling Infrastructure Undermining Actual End-of-Life Value Recovery | -1.0% | United States, India, Southeast Asia, Latin America, Eastern Europe, Sub-Saharan Africa | Medium term (2–4 years) |
| Recycled Content Price Volatility & PCR Material Supply Shortage Constraining Adoption at Scale | -0.7% | Global; most acute for food-grade PCR-PET and PCR-HDPE | Short term (≤ 2 years) |
| EU Green Claims Directive Enforcement Restricting Recyclability Marketing Claims Not Substantiated by Systemic Collection Data | -0.4% | European Union, United Kingdom | Short term (≤ 2 years) |
| China National Sword & Import Restrictions on Recyclable Material Grades Collapsing Export Recovery Economics | -0.2% | Global; most impactful for mixed paper & plastic export-dependent collection systems in US, UK, Australia | Medium term (2–4 years) |
Challenges
Recyclability certification standards remain globally incoherent, so one format certified in one market may fail in another. A multinational brand serving the EU, US, UK, and Australia must navigate at least 4 distinct assessment frameworks at once. The EU framework requires curbside sortability in at least 75% of member state systems. This fragmentation raises compliance burden, so brands face rising cost to manage multi-market claims.
Certifying one new format across all 4 frameworks costs an estimated USD 180,000 to USD 450,000 plus 12 to 24 months of processing. This delays commercial launch by 1 to 2 years versus non-certified formats. Ongoing regulatory staffing runs USD 300,000 to USD 600,000 per year. This favors scale, so smaller manufacturers face consolidation pressure they cannot easily absorb.
| Challenge | (~) % CAGR Friction Drag | Geographic Relevance | Mitigation Horizon |
|---|---|---|---|
| Recyclability Certification Standard Fragmentation | -0.8% | Global; divergence between EU (EN 13430/PPWR RAM), US (How2Recycle/APR), Australia (PREP) | Long term (≥ 4 years) |
| Consumer Contamination & Sorting Behavior Gap | -0.6% | Global; acute in single-stream collection markets — United States, United Kingdom, Canada, Australia | Long term (≥ 4 years) |
| Recycled-Content Food-Contact Migration Safety Compliance | -0.5% | European Union (EU 10/2011), United States (FDA), Japan, South Korea | Medium term (2–4 years) |
| Digital Watermarking & Sorting Technology Deployment Lag | -0.4% | European Union — HolyGrail 2.0 program rollout; United States, Australia | Medium term (2–4 years) |
| Emerging Market Informal Waste Sector Disruption from Formalization | -0.2% | India, Brazil, Indonesia, Egypt, Nigeria | Long term (≥ 4 years) |
Opportunities
Chemical recycling scale-up opens food-grade recycled content for flexible and multilayer categories that mechanical recycling cannot serve. Chemical processes convert waste back to virgin-equivalent feedstock, enabling 30% to 100% recycled content in food-contact packaging. Certified food-grade recycled polymer commands a premium of €400 to €900 EUR per tonne over virgin material. This lifts margins, so early movers gain pricing power.
The upside stays future-state because commercial plants producing 50,000+ tonnes per year remain limited to a few early operations. Most announced projects reach full output only between 2027 and 2029. This creates a 3 to 5 year first-mover window. Manufacturers securing offtake and co-investment now will lock in scarce certified feedstock ahead of rivals.
| Opportunity | (~) % Potential CAGR Upside | Geographic Relevance | Execution Window |
|---|---|---|---|
| Chemical Recycling Scale-Up Enabling Food-Grade PCR for Flexible & Multi-Layer Packaging Categories | +1.2% | European Union, United States, Japan, South Korea, Australia | Long term (≥ 4 years) |
| Deposit Return Scheme (DRS) Expansion Creating Closed-Loop High-Purity Material Streams for Premium Recyclable Packaging | +0.9% | United Kingdom (DRS live October 2027), Canada, Australia, India (piloting), EU member states | Medium term (2–4 years) |
| Recyclable Packaging Digital Product Passport (DPP) as a Brand Transparency & Premium Positioning Tool | +0.6% | European Union (ESPR mandate), United Kingdom, United States | Medium term (2–4 years) |
| India Formal Recyclable Packaging Sector Development under Extended PWM Rules & PRO Framework | +0.5% | India — formal EPR credit market under MoEFCC Plastic Waste Management Amendment Rules 2022 | Medium term (2–4 years) |
| Agricultural & Industrial B2B Recyclable Packaging Conversion as an Underpenetrated Adjacent Vertical | +0.3% | Global, most actionable in Europe, North America, Australia | Long term (≥ 4 years) |
Key Company Insights
Amcor Plc holds a structural advantage after completing its all-stock merger with Berry Global in April 2025, creating one of the world’s largest consumer and healthcare packaging companies. As per our research, EU residents recycled 14.7 kg of plastic packaging per capita against 36.1 kg generated in 2022, exposing a recovery gap Amcor can serve. This scale creates cost and innovation leverage, so Amcor can absorb reformulation costs that smaller rivals cannot.
Berry Global Group, Inc. now operates inside the enlarged combined entity, adding recyclable packaging capacity and sustainability-focused product innovation. As per our research, EU packaging waste rose more than 20% over the decade to 2021, reaching 189 kg per resident. This rising base expands Berry’s addressable demand, so its broadened portfolio positions it to win multi-category conversion contracts across food and healthcare clients.
Key Players
- Amcor Plc
- Berry Global Group, Inc.
- Mondi Plc
- Smurfit Westrock
- Ds Smith Plc
- Sonoco Products Company
- Sealed Air Corporation
- Huhtamaki Oyj
- Graphic Packaging Holding Company
- International Paper Company
- Stora Enso Oyj
- Upm-Kymmene Corporation
- Ranpak Holdings Corp.
- Sig Group Ag
- Tetra Pak International S.A.
Recent Developments
- February 2025: Sonoco’s EnviroCan rigid paper container with a metal bottom received pre-qualification for the How2Recycle label, strengthening its position as a recyclable paper-based solution with a body made from 100% recycled fiber.
- February 2025: Shareholders of both Amcor and Berry Global overwhelmingly approved their proposed combination, supporting the creation of a larger sustainable packaging leader.
- April 2025: Amcor and Berry Global received unconditional approval from the European Commission, clearing the final regulatory hurdle before completing their merger focused on sustainable packaging solutions.
- July 2025: Mondi announced it would showcase new recyclable paper-based barrier, flexible, and corrugated packaging innovations at Fachpack 2025 to support customers’ circular packaging goals.
- November 2025: Mondi launched an expanded corrugated and solid-board food packaging portfolio, adding recyclable solutions following the integration of Schumacher Packaging’s Western European operations.
Geopolitical Impact Analysis
Trade tensions and shipping disruption reshape recyclable packaging supply chains. As reported by UNCTAD, Red Sea rerouting around the Cape of Good Hope added roughly 10 to 14 extra transit days and lifted container freight rates sharply through 2024. According to the World Shipping Council, Suez transits fell more than 60% during peak disruption. This raises landed costs for imported recycled feedstock, so European converters favor local supply to protect margins.
Energy volatility directly hits recyclable packaging production costs. According to the IEA, natural gas prices in Europe stayed well above pre-2021 levels, and industrial energy costs remained roughly 2 to 3 times US levels through 2024. As reported by the World Bank, commodity price swings continue to pressure pulp, resin, and aluminum inputs. This squeezes converter margins, so manufacturers hedge feedstock and localize sourcing to limit exposure to imported input shocks.
Report Scope
| Report Features | Description |
|---|---|
| Market Value (2025) | USD 30.90 Billion |
| Forecast Revenue (2035) | USD 49.50 Billion |
| CAGR (2026-2035) | 4.8% |
| Base Year for Estimation | 2025 |
| Historic Period | 2020-2024 |
| Forecast Period | 2026-2035 |
| Report Coverage | Revenue Forecast, Market Dynamics, Market Opportunity Analysis, Technology and Innovation Landscape, Competitive Landscape, Recent Developments |
| Segments Covered | By Material Type (Paper & Paperboard, Recyclable Plastics, Glass, Metal, Fiber-Based Composite Materials), By Packaging Type (Rigid, Flexible, Semi-Rigid), By Product Type (Boxes & Cartons, Pouches & Bags, Bottles & Jars, Trays & Containers, Cans, Wraps & Films), By Application (Food & Beverage, Healthcare & Pharmaceuticals, Personal Care & Cosmetics, Consumer Electronics, Industrial Packaging, E-Commerce & Retail), By End User (Food & Beverage Manufacturers, Pharmaceutical Companies, Consumer Goods Companies, E-Commerce Companies, Industrial Manufacturers), By Recycling Process (Mechanical Recycling Compatible, Chemical Recycling Compatible), By Distribution Channel (Direct Sales B2B, Packaging Distributors & Online Procurement, Retail Packaging Suppliers) |
| Regional Analysis | North America (US and Canada), Europe (Germany, France, The UK, Spain, Italy, and Rest of Europe), Asia Pacific (China, Japan, South Korea, India, Australia, and Rest of APAC), Latin America (Brazil, Mexico, and Rest of Latin America), Middle East and Africa (GCC, South Africa, and Rest of MEA) |
| Competitive Landscape | Amcor Plc, Berry Global Group Inc., Mondi Plc, Smurfit Westrock, Ds Smith Plc, Sonoco Products Company, Sealed Air Corporation, Huhtamaki Oyj, Graphic Packaging Holding Company, International Paper Company, Stora Enso Oyj, Upm-Kymmene Corporation, Ranpak Holdings Corp., Sig Group Ag, Tetra Pak International S.A. |
| Customization Scope | Customization for segments, region / country-level will be provided. Additional customization can be done based on requirements. |
| Purchase Options | We have three licenses to opt for: Single User License | Multi-User License (Up to 5 Users) | Corporate Use License (Unlimited User and Printable PDF) |





































