


Report Overview
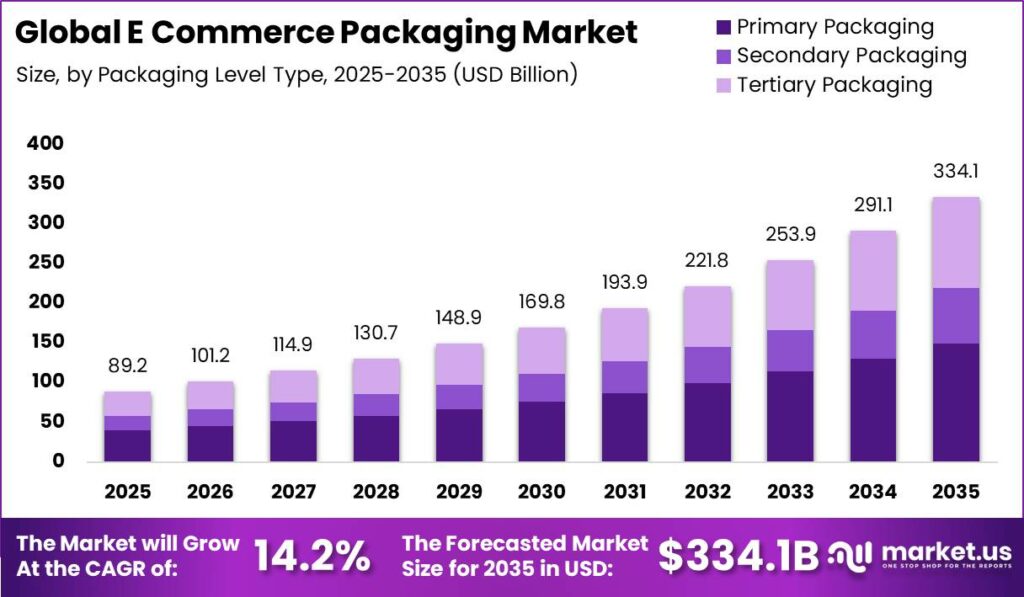
Global E Commerce Packaging Market size is expected to be worth around USD 334.1 Billion by 2035 from USD 89.2 Billion in 2025, growing at a CAGR of 14.2% during the forecast period 2026 to 2035. This trajectory reflects the tight link between rising parcel volumes and packaging units. Suppliers who scale capacity early will capture the widening gap between order growth and available conversion output.
E commerce packaging covers every material that protects and presents goods shipped directly to buyers. Industrial Packaging structures divide into primary containers, secondary cartons, and tertiary transit layers. This means vendors compete across corrugated board, flexible mailers, protective fillers, and labeling systems. Buyers select formats by product fragility, brand goals, and shipping cost. This creates distinct pricing tiers that reward specialization over broad commodity supply.
Key Takeaways
- Global market reaches USD 334.1 Billion by 2035 from USD 89.2 Billion in 2025 at 14.2% CAGR.
- Corrugated Cardboard leads Material Type with a 41.60% share.
- Boxes and Cartons dominate Packaging Type at 46.30%.
- Apparel and Fashion leads Application at 29.40%.
- Protective Packaging tops Packaging Function at 52.10%.
- E-Commerce Retailers lead End User at 38.70%.
- Primary Packaging leads Packaging Level at 44.80%.
- Recyclable Packaging leads Sustainability Type at 49.30%.
- Direct Sales dominate Distribution Channel at 63.50%.
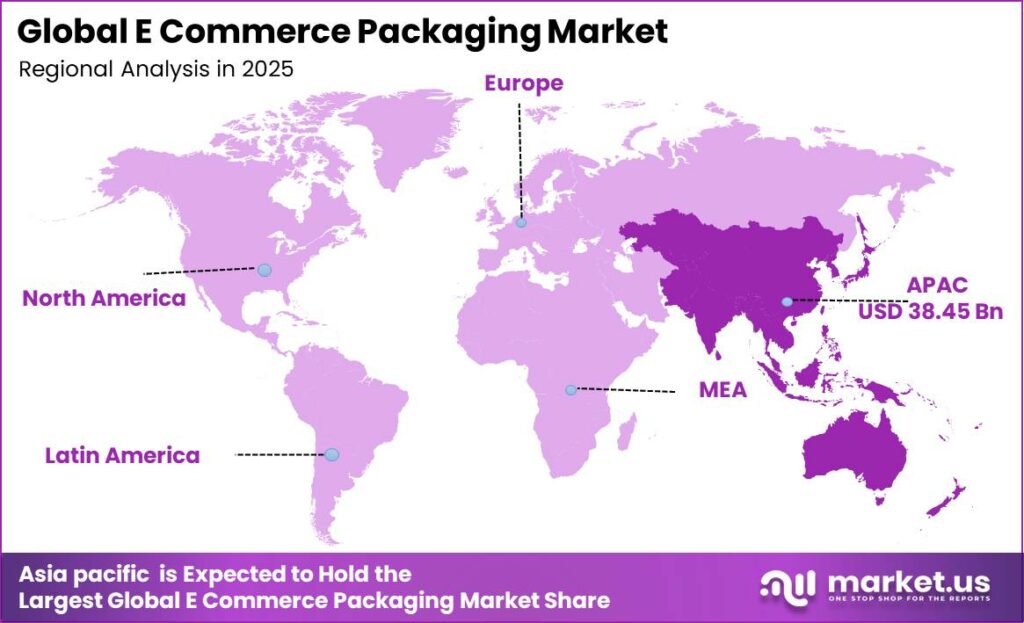
- Asia-Pacific leads all regions with a 43.10% share, valued at USD 38.45 Billion.
Government bodies now shape demand through packaging waste rules and plastic taxes. Extended Producer Responsibility fees push brands toward recyclable and fiber based formats. This signals higher near-term costs but durable demand for compliant material. Converters that certify recyclable lines early will win regulated contracts. As a result, sustainability compliance shifts from a cost center to a sales advantage across European and North American accounts.
According to OECD, e commerce packaging contributes to roughly 141 Million tonnes of plastic packaging waste annually. This scale draws regulatory scrutiny and reshapes material choices at the source. Brands that switch to fiber based mailers cut compliance exposure. This creates a clear runway for paper focused converters to displace plastic incumbents in mandated markets.
McKinsey found that retail returns generate up to 30% additional packaging waste per order in fashion and electronics. Reverse logistics therefore multiplies packaging consumption beyond the first shipment. This means resealable and returnable formats carry outsized value for high-return categories. Vendors building return-ready designs will lock in apparel and electronics clients seeking waste reduction.
Material Type Analysis
Corrugated Cardboard dominates with 41.60% due to strength, recyclability, and low unit cost.
In 2025, Corrugated Cardboard held a dominant market position in the By Material Type segment of E Commerce Packaging Market, with a 41.60% share. Data from FAO shows global paper and paperboard packaging consumption reached over 250 Million tonnes annually, driven heavily by corrugated box demand. This scale gives corrugated the lowest cost per unit at volume. Converters with fiber sourcing contracts therefore protect margin best during price swings.
Plastic Packaging serves lightweight apparel and soft-goods shipments where cushioning needs stay low. As reported by UPU, global parcel volumes surpassed 161 Billion parcels in 2024, lifting mailer demand sharply. This ranks plastic as the fastest growing material by shipment count. Suppliers offering recyclable poly mailers will capture brands facing plastic bans while holding cost advantages.
Paper and Paperboard formats replace plastic mailers as brands chase recyclable presentation. RISI indicates that paper packaging demand rises consistently above 4% to 5% annually in retail logistics. This steady climb rewards early investment in paper-padded mailer lines. Converters that certify curbside recyclability will win regulated European and North American accounts first.
Foam Packaging protects fragile electronics and high-value goods needing rigid cushioning support. Molded Fiber Packaging serves as the sustainable alternative for shaped protective inserts. As per our research, these two formats together hold the remaining share of the material mix behind the leaders. This means niche protection suppliers can defend premium pricing in fragile-goods categories.
Packaging Type Analysis
Boxes and Cartons dominates with 46.30% due to stacking strength for varied parcel sizes.
In 2025, Boxes and Cartons held a dominant market position in the By Packaging Type segment of E Commerce Packaging Market, with a 46.30% share. As per our research, global corrugated box shipments exceed 120 Billion square meters annually. This volume anchors boxes as the default transit format across categories. Vendors with automated box-making lines will cut waste and win high-throughput fulfillment contracts.
Mailers and Envelopes suit flat, non-fragile items like apparel and documents. As per our research, rising parcel frequency from same-day networks lifts mailer use above 8% yearly. This ranks mailers as the fastest growing packaging type. Suppliers offering paper mailers will convert plastic-restricted brands seeking lighter, compliant options.
Protective Packaging such as bubble wrap and air pillows guards fragile contents in transit. Tapes and Labels secure closures and carry shipping and branding data across every parcel. Void Fill Packaging stabilizes loose contents inside oversized cartons. As per our research, these three formats collectively hold the remaining share behind boxes and mailers. This creates steady add-on demand tied directly to box volume.
Application Analysis
Apparel and Fashion dominates with 29.40% due to high parcel frequency and return volume.
In 2025, Apparel and Fashion held a dominant market position in the By Application segment of E Commerce Packaging Market, with a 29.40% share. As per our research, apparel drives more than 25% of soft-goods parcel flows globally. This concentration favors flexible mailers over rigid boxes for cost control. Suppliers serving fashion brands must design for both first shipment and frequent returns.
Electronics buyers demand rigid protection for fragile, high-value devices in transit. As per our research, electronics parcels grow faster than 10% annually across major corridors. This ranks electronics as the fastest growing application. Vendors offering engineered molded-fiber inserts will win brands seeking damage reduction and sustainability together.
Food and Grocery Delivery needs temperature-control and leak-resistant formats for perishable orders. Personal Care and Cosmetics rely on premium unboxing designs to build brand loyalty. Books and Media, Household Goods, and Pharmaceuticals round out demand with durability and compliance needs. As per our research, these categories together hold the remaining share behind apparel and electronics. This spreads specialized packaging demand across many niche buyers.
Packaging Function Analysis
Protective Packaging dominates with 52.10% due to transit damage reduction across all categories.
In 2025, Protective Packaging held a dominant market position in the By Packaging Function segment of E Commerce Packaging Market, with a 52.10% share. As per our research, damaged parcels can cost brands over 17 times the price of the packaging saved. This math makes protection the highest-priority function for shippers. Vendors proving lower damage rates will command premium pricing across every application.
Branding and Custom Packaging turns the parcel into a marketing surface for brand recall. As per our research, premium unboxing formats grow faster than 9% yearly in beauty and D2C segments. This ranks branding as the fastest growing function. Suppliers offering custom print at low minimums will win small D2C brands.
Returnable Packaging supports closed-loop delivery for repeat and subscription orders. Temperature-Control Packaging safeguards perishables and pharmaceuticals across the cold chain. As per our research, these two functions hold the remaining share behind protection and branding. This means specialized function suppliers can defend margin in high-value niches.
End User Analysis
E-Commerce Retailers dominates with 38.70% due to direct control over packaging standards.
In 2025, E-Commerce Retailers held a dominant market position in the By End User segment of E Commerce Packaging Market, with a 38.70% share. As per our research, large retailers set packaging specifications for more than 35% of shipped parcels. This buying power drives standardization and volume discounts. Converters winning retailer contracts secure the most stable, high-volume revenue base.
Third-Party Logistics providers manage packaging across many client brands at scale. As per our research, 3PL parcel handling expands faster than 11% yearly worldwide. This ranks 3PLs as the fastest growing end user. Suppliers offering standardized, machine-ready formats will win 3PL fulfillment accounts.
Online Marketplaces aggregate seller shipments under shared packaging guidelines. Direct-To-Consumer Brands internalize packaging to control cost and presentation. Subscription Box Companies rely on recurring, unboxing-focused formats. As per our research, these three groups hold the remaining share behind retailers and 3PLs. This spreads demand across many mid-sized buyers seeking tailored solutions.
Packaging Level Analysis
Primary Packaging dominates with 44.80% due to direct product contact in every shipment.
In 2025, Primary Packaging held a dominant market position in the By Packaging Level segment of E Commerce Packaging Market, with a 44.80% share. As per our research, primary containers ship with over 90% of direct-to-consumer orders. This universality makes primary the highest-volume level. Vendors optimizing primary formats for right-sizing will cut dimensional weight costs for buyers.
Secondary Packaging groups primary units for retail and transit efficiency. As per our research, secondary format use rises faster than 7% yearly with bundled shipping. This ranks secondary as the fastest growing level. Suppliers offering modular secondary cartons will win multi-item order fulfillment.
Tertiary Packaging protects palletized bulk loads across long-haul transit. As per our research, tertiary formats hold the remaining share behind primary and secondary. This means bulk transit suppliers serve steady but lower-volume demand. Converters here compete mainly on strength and freight optimization.
Sustainability Type Analysis
Recyclable Packaging dominates with 49.30% due to broad curbside acceptance and regulation.
In 2025, Recyclable Packaging held a dominant market position in the By Sustainability Type segment of E Commerce Packaging Market, with a 49.30% share. As per our research, recyclable fiber formats cover more than 45% of regulated-market shipments. This alignment with EPR rules makes recyclable the default compliant choice. Converters certifying recyclability early will win brands facing packaging taxes.
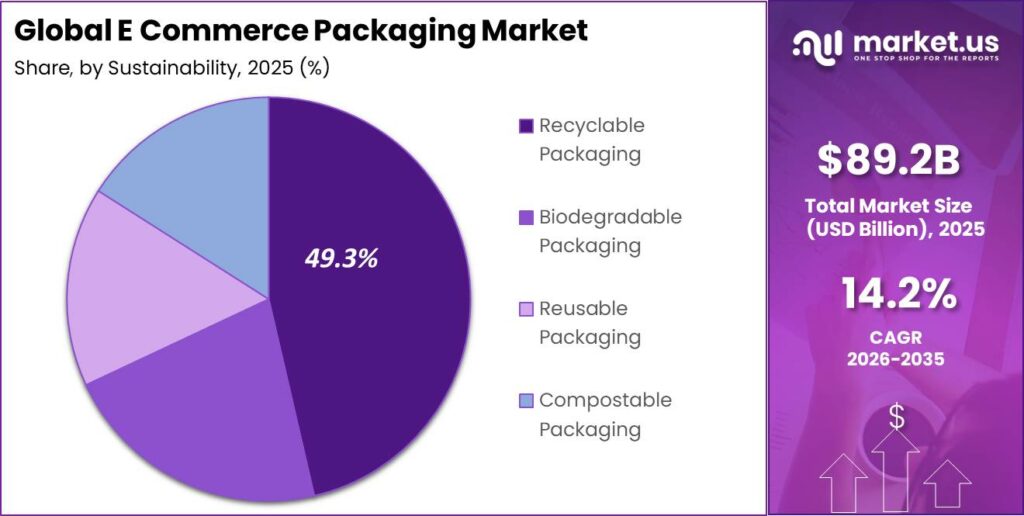
Biodegradable Packaging appeals to eco-focused D2C fashion and lifestyle brands. As per our research, biodegradable format adoption grows faster than 12% yearly in premium niches. This ranks biodegradable as the fastest growing sustainability type. Suppliers offering compostable bio-polymer mailers will capture green-positioned brands.
Reusable Packaging supports closed-loop subscription and repeat delivery models. Compostable Packaging serves premium void-fill and food-adjacent niches. As per our research, these two types hold the remaining share behind recyclable and biodegradable. This creates room for service-based reuse models to scale in urban corridors.
Distribution Channel Analysis
Direct Sales dominates with 63.50% due to volume B2B contracts with large shippers.
In 2025, Direct Sales held a dominant market position in the By Distribution Channel segment of E Commerce Packaging Market, with a 63.50% share. As per our research, B2B contracts cover more than 60% of converter volume globally. This concentration rewards suppliers with dedicated account teams. Vendors securing multi-year contracts lock in predictable, high-margin revenue.
Online Packaging Suppliers serve small brands needing fast, low-minimum ordering. As per our research, online packaging sales grow faster than 13% yearly among D2C sellers. This ranks the online channel as the fastest growing. Suppliers building e-commerce storefronts will capture the fragmented long-tail of small buyers.
Retail and Industrial Distributors supply mid-sized regional buyers with stocked inventory. As per our research, distributors hold the remaining share behind direct and online channels. This means regional distributors serve buyers needing speed over customization. Converters partnering with distributors extend reach without direct sales overhead.
Key Market Segments
By Material Type
- Corrugated Cardboard
- Plastic Packaging (Poly Mailers, Films)
- Paper and Paperboard
- Foam Packaging
- Molded Fiber Packaging
By Packaging Type
- Boxes and Cartons
- Mailers and Envelopes
- Protective Packaging (Bubble Wrap, Air Pillows)
- Tapes and Labels
- Void Fill Packaging
By Application
- Apparel and Fashion
- Electronics
- Food and Grocery Delivery
- Personal Care and Cosmetics
- Books and Media
- Household Goods
- Pharmaceuticals
By Packaging Function
- Protective Packaging
- Branding and Custom Packaging
- Returnable Packaging
- Temperature-Control Packaging
By End User
- E-Commerce Retailers
- Third-Party Logistics (3PL) Providers
- Online Marketplaces
- Direct-To-Consumer Brands
- Subscription Box Companies
By Packaging Level
- Primary Packaging
- Secondary Packaging
- Tertiary Packaging
By Sustainability Type
- Recyclable Packaging
- Biodegradable Packaging
- Reusable Packaging
- Compostable Packaging
By Distribution Channel
- Direct Sales (B2B Contracts)
- Online Packaging Suppliers
- Retail and Industrial Distributors
Regional Analysis
Asia Pacific Dominates the E Commerce Packaging Market with a Market Share of 43.10%, Valued at USD 38.45 Billion
Asia Pacific leads the E Commerce Packaging Market with a 43.10% share, valued at USD 38.45 Billion in 2025. High online penetration and dense parcel networks across China and India drive this lead. This scale pulls corrugated and mailer demand faster than any other region. Last Mile Delivery Market growth here rewards suppliers with local conversion capacity near fulfillment hubs.
North America ranks as a fast-growing region on premium unboxing and D2C expansion. Brand-led presentation spending lifts custom packaging value per order sharply. This means converters offering short-run custom print will capture rising D2C demand. Vendors positioned near urban fulfillment centers will win same-day delivery packaging contracts.
Europe advances on strict EPR fees and plastic-packaging taxes that favor recyclable formats. Regulatory pressure shifts brands toward fiber-based mailers and mono-material designs. This creates durable demand for certified recyclable suppliers across the region. Latin America and Middle East and Africa hold emerging demand as online retail deepens in tier-2 cities.
Key Regions and Countries
North America
- US
- Canada
Europe
- Germany
- France
- The UK
- Spain
- Italy
- Rest of Europe
Asia Pacific
- China
- Japan
- South Korea
- India
- Australia
- Rest of APAC
Latin America
- Brazil
- Mexico
- Rest of Latin America
Middle East and Africa
- GCC
- South Africa
- Rest of MEA
Market Dynamics
Market Opportunity Analysis - Emerging regions and reuse-based niches offer the clearest entry points for new packaging players
Untapped rural and tier-2 and tier-3 e-commerce demand in emerging markets stands out as underexploited. Asia Pacific already leads with a 43.10% share, yet inland districts remain thinly served. This means new entrants can build local conversion near growing fulfillment hubs before incumbents arrive. Instead of competing in saturated urban corridors, they can lock in regional retailer contracts early.
Reusable packaging within the Sustainability Type segment, holding recyclable-led demand at 49.30%, remains barely tapped. Returnable formats serve subscription and repeat buyers who ship frequently. This creates recurring service revenue rather than one-time unit sales. Therefore, operators building closed-loop networks in urban Asia and Europe can secure defensible, annuity-style contracts.
Biodegradable packaging, the fastest-growing sustainability type, targets premium D2C fashion and lifestyle brands. These brands accept higher unit costs to protect green positioning. This means suppliers offering compostable mailers can charge premium pricing with low volume risk. As a result, early movers capture brand loyalty before mass-market converters enter the niche.
The Online Packaging Suppliers channel, the fastest-growing distribution route, serves small D2C sellers underserved by direct B2B contracts. These buyers need low minimums and fast shipping. This creates a long-tail opportunity for digital-first suppliers. Therefore, firms building e-commerce storefronts can aggregate fragmented small-brand demand at scale.
Technology and Innovation Landscape - Automation, smart tags, and material science reshape competitive edges
On-demand, automated right-size box-making integrated into fulfillment centers stands as a core innovation. These systems cut void fill and dimensional-weight shipping costs by matching box size to contents. This means retailers reduce freight spend while trimming material waste. Converters supplying machine-compatible corrugated standards will win high-throughput fulfillment accounts first.
Smart and connected packaging using QR, NFC, and track-and-trace adds a monetizable digital layer. These tags authenticate high-value parcels and enable real-time tracking. This means brands turn packaging into a data and security asset beyond protection. Therefore, suppliers embedding RFID-enabled formats can charge premium pricing for high-value electronics and pharmaceutical shipments.
Compostable and fiber-based void-fill innovation replaces plastic bubble wrap in urban delivery systems. Paper-padded protective solutions meet recyclability rules while cushioning fragile goods. This means converters solving the protection-versus-recyclability trade-off unlock regulated demand. As a result, early material-science investment builds a defensible edge in premium sustainable niches.
AI-based packaging optimization tools minimize dimensional-weight costs across large retailer networks. These tools calculate the lightest, strongest format for each order profile. This means shippers cut freight spend without raising damage rates. Therefore, suppliers bundling software with materials will deepen client lock-in beyond commodity supply.
Drivers
Sustained double-digit growth in global online retail order volumes anchors demand for e commerce packaging. Online penetration reached roughly 15% to 20% of retail sales across developed economies through 2024 and 2025. Because every order needs at least one shipping container, packaging units scale almost one-for-one with parcel counts. This means order growth of 8% to 12% yearly pulls through matching demand for boxes, mailers, and fillers.
This tight coupling makes online retail the largest structural driver of the market. Quick-commerce and same-day networks add parcel frequency that lifts packaging intensity further. Therefore, converters who expand capacity ahead of demand will capture share as digital commerce keeps taking ground from physical stores. This driver alone underpins an estimated +4.6% of the baseline CAGR of 14.2%.
| Driver | (~) % Impact on CAGR Forecast | Geographic Relevance | Impact Timeline |
|---|---|---|---|
| Sustained double-digit growth in global online retail order volumes | +4.6% | Global | Short term (≤ 2 years) |
| Rapid expansion of quick-commerce and same-day delivery increasing parcel frequency | +2.7% | Asia-Pacific, North America, Europe | Short term (≤ 2 years) |
| Brand-led unboxing and premium presentation elevating packaging spend per order | +1.8% | North America, Europe, East Asia | Medium term (2–4 years) |
| Growth of direct-to-consumer models internalizing packaging decisions | +1.3% | Global | Medium term (2–4 years) |
| Cross-border e-commerce demanding more protective, transit-optimized packaging | +0.9% | Global trade corridors | Medium term (2–4 years) |
Restraints
Volatility in paper, resin, and corrugated raw-material prices disrupts cost stability across the market. Containerboard and kraft prices have moved by double digits within single years since 2022, while resin grades swung 15% to 30%. Because material can exceed half the cost of a finished box, converters on 10% to 20% gross margins cannot absorb sudden spikes. This means buyers trim order sizes or down-specify during price peaks.
This cost volatility restrains sales as pass-through to price-sensitive customers stays slow and contested. Regulatory fees and plastic taxes add further unit cost pressure across Europe and North America. Therefore, converters adopting indexed pricing contracts will protect margin best. This restraint subtracts an estimated -2.4% from the baseline CAGR of 14.2% until raw-material markets stabilize.
| Restraint | (~) % Impact on CAGR Forecast | Geographic Relevance | Impact Timeline |
|---|---|---|---|
| Volatility in paper, resin, and corrugated raw-material prices | -2.4% | Global | Short term (≤ 2 years) |
| Extended Producer Responsibility fees and plastic-packaging taxes raising unit costs | -1.9% | European Union, UK, parts of North America | Medium term (2–4 years) |
| Retailer pressure to minimize packaging cost per shipment | -1.3% | Global | Short term (≤ 2 years) |
| Bans and restrictions on single-use plastic void fill and films | -1.0% | EU, India, China | Medium term (2–4 years) |
| Macroeconomic softness dampening discretionary online spending | -0.8% | Global | Short term (≤ 2 years) |
Challenges
Reconciling recyclability with protective-performance requirements creates a core structural tension in this market. Mono-material recyclable formats often deliver less cushioning and moisture resistance than the multilayer solutions they replace. Because inadequate protection lifts transit damage by several percentage points, each damaged parcel triggers replacement and return costs many times the packaging value. This means brands face a direct trade-off between sustainability pledges and damage economics.
Engineering fiber-based alternatives that match incumbent protection requires sustained R&D and carrier drop-test revalidation lasting months per SKU. Warehousing Market operators must also requalify formats across vibration standards. Therefore, converters investing early in material science will control the recyclable-protective niche. This challenge imposes an ongoing friction drag estimated at around -2.0% on the market’s maximum growth.
| Challenge | (~) % CAGR Friction Drag | Geographic Relevance | Mitigation Horizon |
|---|---|---|---|
| Reconciling recyclability with protective-performance requirements | -2.0% | Global | Long term (≥ 4 years) |
| Fragmented recycling and labeling standards across jurisdictions | -1.5% | Global | Long term (≥ 4 years) |
| Right-sizing and dimensional-weight optimization complexity | -1.2% | Global | Medium term (2–4 years) |
| High return rates driving reverse-logistics packaging demands | -1.0% | North America, Europe | Medium term (2–4 years) |
| CapEx and lead-times for automated packaging line upgrades | -0.8% | Global | Medium term (2–4 years) |
Opportunities
Reusable and returnable packaging-as-a-service models represent largely uncaptured white space in this market. Durable mailers cycled back under deposit models shift economics from selling disposables to monetizing recurring service. A single reusable mailer engineered for 20 to 50 return trips displaces dozens of single-use equivalents. This means once collection rates pass 70% to 80%, per-shipment cost falls below disposable alternatives.
This model requires new reverse-logistics, cleaning, and digital tracking rather than converting existing box demand. Logistics Automation Market and Supply Chain Management Market infrastructure make early operators defensible. Therefore, firms building closed-loop networks can command service margins above thin commodity conversion. Capturing modest urban parcel flows could add an estimated +2.3% upside to the baseline CAGR of 14.2%.
| Opportunity | (~) % Potential CAGR Upside | Geographic Relevance | Execution Window |
|---|---|---|---|
| Reusable and returnable packaging-as-a-service models for closed-loop delivery | +2.3% | Europe, North America, urban Asia | Long term (≥ 4 years) |
| Smart and connected packaging with QR, NFC, and track-and-trace monetization | +1.7% | Global | Medium term (2–4 years) |
| On-demand, automated right-size box-making integrated into fulfillment centers | +1.4% | Global | Medium term (2–4 years) |
| Untapped rural and tier-2/3 e-commerce packaging demand in emerging markets | +1.2% | India, Southeast Asia, Africa, Latin America | Long term (≥ 4 years) |
| Compostable and fiber-based void-fill innovation for premium sustainable niches | +0.9% | Europe, North America | Medium term (2–4 years) |
Key Company Insights
Amcor Plc holds a structural advantage through its global flexible and fiber packaging footprint spanning many countries. This scale lets the company serve large retailers with standardized, machine-ready formats across regions. Amcor’s investment in recyclable mono-material lines positions it well against tightening EPR rules. However, heavy exposure to flexible plastics creates risk as single-use bans widen across the EU and Asia.
Westrock Company anchors its position in corrugated board, the material holding a 41.60% share of the market. This focus aligns the company with the highest-volume, most recyclable segment. Westrock’s integrated fiber sourcing protects margin during raw-material price swings. This creates an advantage in regulated markets, though its lighter presence in flexible mailers leaves the fastest-growing plastic-alternative niche partly open to rivals.
Key Players
- Amcor Plc
- Westrock Company
- Smurfit Kappa Group
- International Paper Company
- Mondi Plc
- DS Smith Plc
- Sealed Air Corporation
- Sonoco Products Company
- Huhtamaki Oyj
- Berry Global Group, Inc.
- Crown Holdings, Inc.
- AptarGroup, Inc.
- Coveris Holdings S.A.
- Pregis Llc
- Uline, Inc.
Recent Developments
- 2024: Amazon reduced global plastic packaging by 16.4% compared to the previous year baseline, signaling accelerating brand-led demand for fiber-based mailer alternatives.
- 2015: Amazon eliminated over 2 Million tons of packaging material through its Frustration-Free Packaging initiatives, setting a reduction benchmark that reshaped supplier specifications.
- 2015: Amazon avoided 4.2 Million metric tons of packaging materials through cumulative packaging reduction programs, pushing converters toward right-sized formats.
Geopolitical Impact Analysis
According to the WTO, tariff actions across major trade corridors have raised input costs for packaging converters. Duties on pulp, containerboard, and resin imports have climbed by double-digit percentages in several markets since 2024. This means converters sourcing across borders face higher landed costs for fiber and polymer feedstock. As a result, suppliers with regional raw-material sourcing gain a clear cost advantage over import-dependent rivals.
Data from UNCTAD shows that supply chain rerouting has extended some ocean transit times by more than 10 days on affected lanes. IEA figures indicate energy price swings above 20% that lift resin and paper production costs. This means packaging makers face both slower material inflows and volatile conversion costs. Therefore, firms holding buffer inventory and indexed contracts will protect delivery reliability and margin through ongoing disruption.
Report Scope
| Report Features | Description |
|---|---|
| Market Value (2025) | USD 89.2 Billion |
| Forecast Revenue (2035) | USD 334.1 Billion |
| CAGR (2026-2035) | 14.2% |
| Base Year for Estimation | 2025 |
| Historic Period | 2020-2024 |
| Forecast Period | 2026-2035 |
| Report Coverage | Revenue Forecast, Market Dynamics, Market Opportunity Analysis, Technology and Innovation Landscape, Competitive Landscape, Recent Developments |
| Segments Covered | By Material Type (Corrugated Cardboard, Plastic Packaging, Paper and Paperboard, Foam Packaging, Molded Fiber Packaging), By Packaging Type (Boxes and Cartons, Mailers and Envelopes, Protective Packaging, Tapes and Labels, Void Fill Packaging), By Application (Apparel and Fashion, Electronics, Food and Grocery Delivery, Personal Care and Cosmetics, Books and Media, Household Goods, Pharmaceuticals), By Packaging Function (Protective Packaging, Branding and Custom Packaging, Returnable Packaging, Temperature-Control Packaging), By End User (E-Commerce Retailers, 3PL Providers, Online Marketplaces, Direct-To-Consumer Brands, Subscription Box Companies), By Packaging Level (Primary, Secondary, Tertiary), By Sustainability Type (Recyclable, Biodegradable, Reusable, Compostable), By Distribution Channel (Direct Sales, Online Packaging Suppliers, Retail and Industrial Distributors) |
| Regional Analysis | North America (US and Canada), Europe (Germany, France, The UK, Spain, Italy, and Rest of Europe), Asia Pacific (China, Japan, South Korea, India, Australia, and Rest of APAC), Latin America (Brazil, Mexico, and Rest of Latin America), Middle East and Africa (GCC, South Africa, and Rest of MEA) |
| Competitive Landscape | Amcor Plc, Westrock Company, Smurfit Kappa Group, International Paper Company, Mondi Plc, DS Smith Plc, Sealed Air Corporation, Sonoco Products Company, Huhtamaki Oyj, Berry Global Group Inc., Crown Holdings Inc., AptarGroup Inc., Coveris Holdings S.A., Pregis Llc, Uline Inc. |
| Customization Scope | Customization for segments, region / country-level will be provided. Additional customization can be done based on requirements. |
| Purchase Options | We have three licenses to opt for: Single User License | Multi-User License (Up to 5 Users) | Corporate Use License (Unlimited User and Printable PDF) |





































