


Report Overview
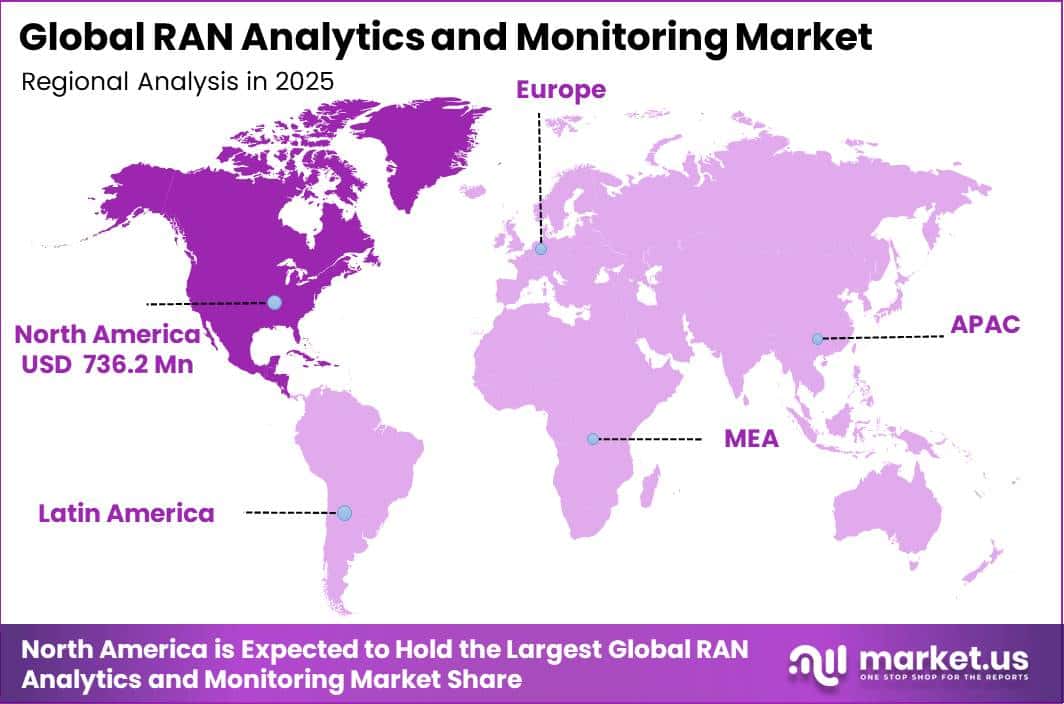
In 2025, the Global RAN Analytics and Monitoring Market was valued at USD 1,994.7 million. The market is projected to grow at a CAGR of 11.3% during 2026–2035, reaching approximately USD 5,818.6 million by 2035. North America dominated the global market in 2025, accounting for more than 36.5% of the total market share and generating approximately USD 736.2 million in revenue.
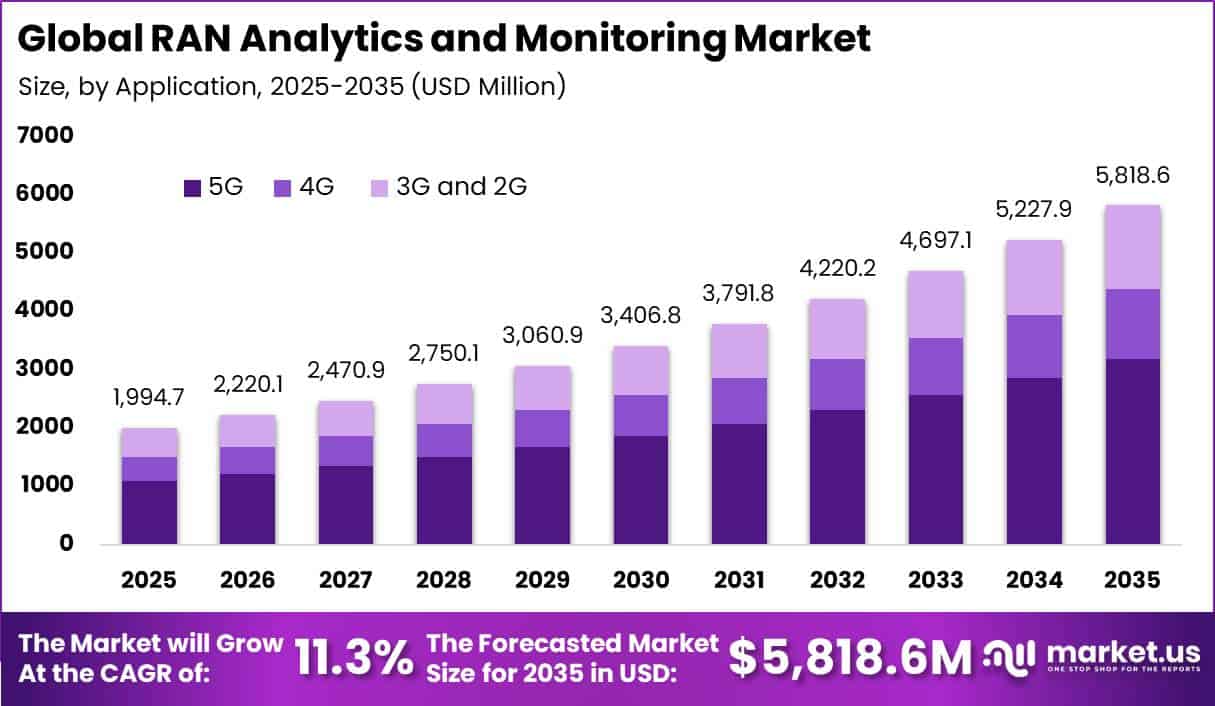
Market growth is supported by rising mobile traffic, expanding 5G networks, and increasing radio-network complexity. ITU reported 9.2 billion mobile-cellular subscriptions in 2025, equal to 112 subscriptions per 100 people. Mobile broadband represented 89% of subscriptions, compared with less than 50% in 2015, while 5G accounted for 36% of mobile-broadband subscriptions.
In 2025, 5G covered 55% of the global population, 4G covered 93%, and 3G-or-higher networks reached 96%. Global mobile-broadband traffic also reached about 1.5 zettabytes, increasing the need for real-time network monitoring, congestion management, automated optimization, and failure prediction.
The Americas recorded 132 mobile-broadband subscriptions per 100 people, versus the global average of 99 per 100. In the United States, 97% of the population had access to at least one 5G provider at 7/1 Mbps by December 2023, while 93% had access at 35/3 Mbps. CTIA recorded 579.3 million wireless connections in 2024, including 259 million 5G-enabled devices.
Wireless traffic increased from 100.1 trillion MB in 2023 to 132.5 trillion MB in 2024, adding more than 32 trillion MB. The country also operated 447,605 cell sites, including 166,264 small cells, by the end of 2024. Further, up to USD 450 million in U.S. government funding for Open RAN supports stronger adoption of analytics, automation, and monitoring solutions.
Key Takeaway
- The RAN Analytics and Monitoring Market was valued at USD 1,994.7 Million in 2025 and is projected to reach USD 5,818.6 Million by 2035 at a CAGR of 11.3%.
- The Solution segment was dominated by the component with a 62.7% share, driven by demand for real-time radio-network data platforms.
- The 5G application segment led with a 54.6% share, supported by 2.4 billion global 5G connections as of Q1 2025.
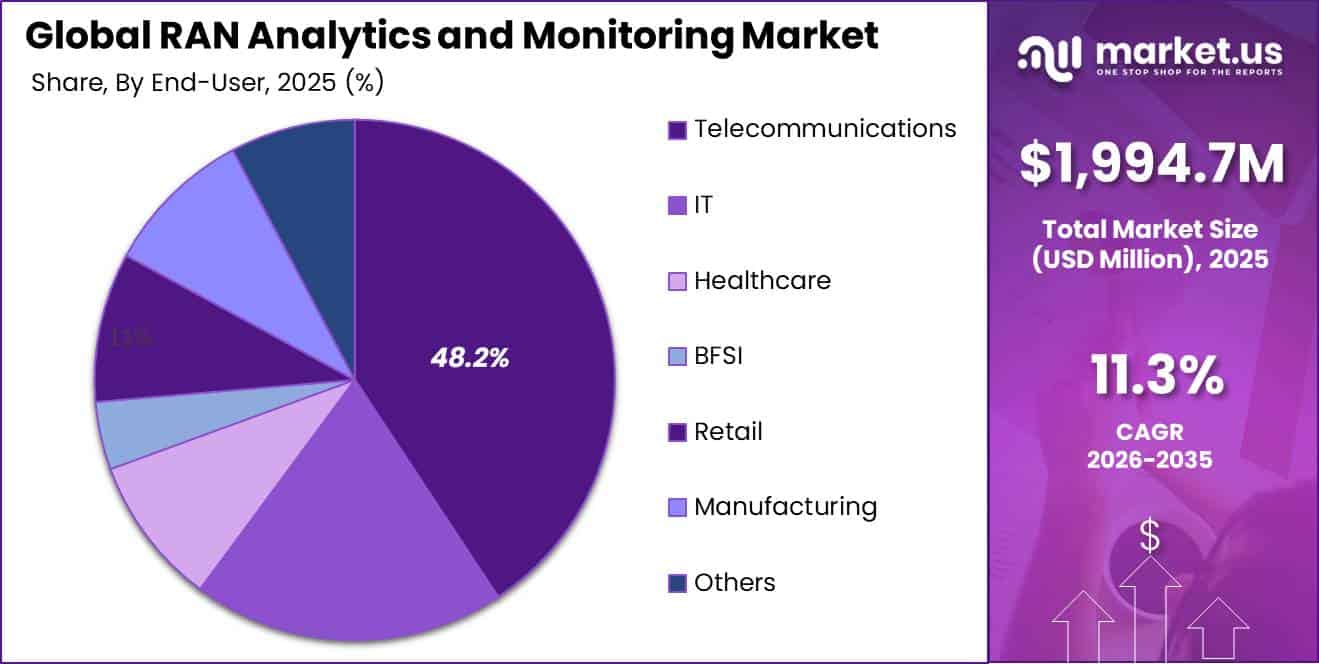
- The Telecommunications end-user segment led with a 48.2% share, reflecting operators’ direct ownership of radio access networks.
- North America led the market in 2025 with a 36.5% share, generating approximately USD 736.2 million in revenue.
By Component
The Solution segment dominated the RAN Analytics and Monitoring Market with a 62.7% share, mainly because telecom operators require dedicated software platforms to collect, analyze, and use large volumes of real-time radio-network data. This requirement is increasing as 5G networks become more automated and involve multiple technology vendors.
The 3GPP introduced Network Data Analytics Function capabilities in 5G Release 15 and further expanded them through Releases 16, 17, and 18. These standards allow network systems to use data for abnormal-device detection, handover analysis, traffic steering, fault management, energy optimization, and mobility management.
Release 19, finalized in December 2025, further strengthened 5G-Advanced specifications, creating greater demand for software capable of managing advanced radio-network functions across different suppliers. Open RAN development is also supporting this segment. In the United States, the National Telecommunications and Information Administration received 94 applications requesting nearly USD 3 billion for Open RAN projects in 2025, alongside more than USD 1.3 billion in proposed private investment.
By Application
The 5G Application segment led the RAN Analytics and Monitoring Market with a 54.6% share, supported by the higher monitoring and automation needs of advanced 5G networks. The global industry had already reached 2.4 billion 5G connections by the first quarter of 2025, while 5G Americas projected the total to rise to around 8 billion connections by 2029. Commercial deployment is also expanding quickly, with 341 commercial 5G networks operating worldwide by December 2024.
This rapid growth is increasing the need to monitor new spectrum bands, massive-MIMO systems, network slices, edge infrastructure, and cloud-based network functions. Compared with 4G, 5G supports not only faster consumer data services but also industrial automation, connected vehicles, private networks, IoT applications, and low-latency services.
RAN analytics platforms help operators detect weak cells, forecast congestion, manage handovers, optimize traffic, and automate network corrections in real time. GSMA reported that mobile technologies and services generated USD 6.5 trillion in economic value in 2024 and could contribute nearly USD 11 trillion by 2030, with 5G, IoT, and AI playing a major role in this growth.
By End-User
The Telecommunications segment dominated the RAN Analytics and Monitoring Market with a 48.2% share, mainly because mobile operators directly own, operate, and invest in radio access networks that require continuous monitoring and optimization. According to OECD data, 195 major communication companies generated approximately USD 1.9 trillion in revenue in 2022, largely from fixed and mobile broadband services.
Global mobile-service revenue reached USD 612.9 billion in 2023, with the United States and Canada contributing around USD 305 billion, representing 50% of the total. Protecting these large revenue streams requires operators to reduce network outages, dropped calls, slow data speeds, and congestion.
Telecom companies also maintain significant infrastructure spending, with the average capital-expenditure-to-sales ratio reaching 15.6% in the United States and Canada, 16.3% in Europe, and 14.6% in Asia-Pacific. RAN analytics platforms help operators improve returns on these investments by identifying overloaded cells, weak coverage, equipment faults, and inefficient energy use.
Key Market Segments
By Component
- Solution
- Services
By Application
- 5G
- 4G
- 3G and 2G
By End-User
- Telecommunications
- IT
- Healthcare
- BFSI
- Retail
- Manufacturing
- Others
Geopolitical Impact Analysis
Geopolitical disruption is increasing both the cost and deployment risk of RAN analytics and monitoring systems. These platforms depend on imported servers, processors, storage systems, optical modules, switches, radio-interface equipment, power systems, and edge-computing hardware. Trade restrictions are adding pressure to this supply chain.
U.S. tariff measures introduced a 10% baseline tariff from April 2025, while country-specific rates ranged from 10% to 41%. Separate Section 301 tariffs also apply to selected Chinese products, while semiconductor-related measures remain under policy review. These duties can increase the landed cost of servers, network appliances, printed-circuit assemblies, and replacement components, potentially delaying telecom capital spending.
UNCTAD reported that Suez Canal ship tonnage in early May 2025 remained around 70% below the 2023 average, as vessels continued to avoid the Red Sea and reroute around the Cape of Good Hope. Longer shipping routes increase freight costs, delivery times, inventory needs, and supply uncertainty for radio equipment, server racks, optics, and spare parts. Energy costs are also becoming important.
The IEA projects telecommunications-network electricity demand to reach 110 TWh in 2027 and about 125 TWh by 2030, mainly due to growing 5G usage. The IEA also expects average EU electricity prices in 2025 to be roughly 2 times the U.S. level and around 50% higher than China’s. This supports demand for energy-aware RAN analytics that optimize radio power while maintaining coverage and service quality.
Regional Analysis
North America led the RAN Analytics and Monitoring Market in 2025, accounting for 36.5% of global revenue and reaching an estimated value of USD 736.2 million. The region’s strong position is supported by early 5G deployment, a large base of advanced mobile networks, high enterprise connectivity needs, and continued public investment in broadband infrastructure.
In the United States, the National Telecommunications and Information Administration’s Broadband Equity, Access, and Deployment program provides USD 42.45 billion to expand high-speed internet infrastructure across states and territories. This investment supports fiber networks, mobile backhaul, rural connectivity, and network upgrades, increasing the need to monitor radio performance, capacity, outages, and service quality.
Asia Pacific is expected to be the fastest-growing region, driven by its large mobile-user base, increasing 5G investment, and growing adoption of cloud services, industrial IoT, smart manufacturing, and digital public services. GSMA reported that mobile technologies and services contributed USD 950 billion to the region’s economy in 2024 and could contribute USD 1.4 trillion by 2030.
The share of 5G in total mobile connections is projected to increase from 18% in 2024 to 50% by 2030. Operators also invested nearly USD 220 billion in 5G networks between 2019 and 2024, supporting stronger demand for traffic forecasting, automated fault detection, network optimization, and cost-control solutions.
Key Regions and Countries
North America
- US
- Canada
Europe
- Germany
- France
- The UK
- Spain
- Italy
- Rest of Europe
Asia Pacific
- China
- Japan
- South Korea
- India
- Australia
- Rest of APAC
Latin America
- Brazil
- Mexico
- Rest of Latin America
Middle East & Africa
- GCC
- South Africa
- Rest of MEA
Market Dynamics
Drivers
| Driver | (~) % CAGR | Geographic Relevance | Impact Timeline |
|---|---|---|---|
| 5G-Advanced Network Automation | +2.4% | Global | Short term (2 years or less) |
| Open RAN Software Adoption | +1.7% | North America, Europe, Asia Pacific | Medium term (2 to 4 years) |
| Cloud-Native RAN Migration | +1.5% | Global | Medium term (2 to 4 years) |
| Private 5G Enterprise Networks | +1.1% | North America, Europe, Asia Pacific | Medium term (2 to 4 years) |
| Energy Efficiency Optimization | +0.8% | Europe, Asia Pacific | Short term (2 years or less) |
5G-Advanced Network Automation
The strongest active driver is the shift from manual radio optimization toward automated 5G-Advanced operations. ITU estimated that global 5G subscriptions reached about 3 billion in 2025, while 5G networks covered 55% of the world’s population. Mobile-broadband traffic also reached around 1.5 zettabytes in 2025, increasing the need for real-time congestion prediction, performance monitoring, and automated radio-resource management.
The technology shift is accelerating further as 3GPP completed Release 19 feature work in September 2025 and stabilized related protocols in December 2025. These developments support more advanced analytics-led network management. For vendors, this creates opportunities in recurring software licenses, cloud subscriptions, and automated assurance modules, while operators can reduce manual network interventions, improve availability, and lower operating costs per managed site.
Restraints
| Restraint | (~) % CAGR | Geographic Relevance | Impact Timeline |
|---|---|---|---|
| Operator Capital Spending Limits | -1.9% | Global | Short term (2 years or less) |
| Telecom Revenue Pressure | -1.3% | Europe, Asia Pacific, Africa | Short term (2 years or less) |
| Public Procurement Delays | -0.9% | North America, Europe | Medium term (2 to 4 years) |
| Cross-Border Data Restrictions | -0.8% | China, Europe, Middle East | Medium term (2 to 4 years) |
| Currency-Linked Equipment Costs | -0.6% | Emerging Markets | Short term (2 years or less) |
Operator Capital Spending Limits
Operator capital constraints remain a major near-term restraint because RAN analytics investments compete with radio upgrades, spectrum purchases, fiber backhaul, and power-system improvements. ITU reported that the median 5 GB data-only mobile-broadband basket cost 1.4% of gross national income per capita in 2025, down from 1.5%, limiting the ability of operators to increase service prices significantly.
The pressure is stronger in low-income economies, where a 5 GB mobile-broadband basket costs more than 10% of average monthly income in 9 out of 10 countries. Combined with higher borrowing costs, this can delay discretionary software spending and extend RAN analytics sales cycles. Vendors are therefore increasingly pushed toward subscription pricing, managed services, phased deployments, and contracts linked to measurable operating-cost savings.
Challenges
| Challenge | (~) % CAGR | Geographic Relevance | Mitigation Horizon |
|---|---|---|---|
| Multi-Vendor Data Integration | -1.6% | Global | Medium term (2 to 4 years) |
| RAN Skills Availability | -1.2% | Global | Medium term (2 to 4 years) |
| Cybersecurity Assurance Burden | -1.1% | Global | Long term (4 years or more) |
| Power Cost Volatility | -0.9% | Europe, Asia Pacific | Short term (2 years or less) |
| Legacy Network Interoperability | -0.7% | Global | Long term (4 years or more) |
Multi-Vendor Data Integration
Multi-vendor data integration remains a major challenge because operators must combine radio, transport, core, cloud, and customer-experience data from different systems. Although 3GPP has supported the Network Data Analytics Function since Release 15, telecom networks still operate across multiple generations and vendor platforms. ITU reported that 4G covered 93% of the global population in 2025, while 5G reached 55%, requiring analytics tools to manage overlapping network technologies.
The challenge is also increasing as networks become more energy- and security-sensitive. The International Energy Agency expects telecommunications-network electricity demand to reach about 125 TWh by 2030, creating a need to connect performance and energy data across sites.
Opportunities
| Opportunity | (~) % CAGR | Geographic Relevance | Execution Window |
|---|---|---|---|
| AI-Native Closed-Loop Operations | +2.2% | Global | Medium term (2 to 4 years) |
| Network API Monetization | +1.6% | North America, Europe, Asia Pacific | Medium term (2 to 4 years) |
| Industrial Private Network Assurance | +1.4% | Asia Pacific, Europe, North America | Long term (4 years or more) |
| Energy-Aware RAN Software | +1.0% | Europe, Asia Pacific | Short term (2 years or less) |
| Rural Network Managed Services | +0.8% | Africa, Latin America, South Asia | Long term (4 years or more) |
AI-Native Closed-Loop Operations
AI-native closed-loop operations remain a major growth opportunity because many telecom operators still use analytics mainly for dashboards and alerts rather than allowing software to automatically adjust radio parameters. The International Energy Agency expects telecommunications-network electricity use to increase from around 110 TWh in 2027 to about 125 TWh by 2030, creating strong demand for analytics that can reduce radio power during low-traffic periods and lower operating costs.
Ericsson reported that North American mobile data use reached about 22 GB per smartphone per month in 2024 and could rise to around 43 GB by 2030, increasing the need for predictive capacity management. At the same time, ITU reported that 2.2 billion people remained offline in 2025, leaving further room for network expansion.
Key Players Analysis
The RAN Analytics and Monitoring Market is mainly led by Tier-1 network infrastructure suppliers, including Huawei, Ericsson, Nokia, ZTE, Samsung, Cisco, and NEC, as these companies combine radio equipment, network software, cloud platforms, and long-term operator support. Ericsson reported SEK 151.0 billion in Networks sales in 2025, representing 64% of its total SEK 236.7 billion revenue.
Nokia generated EUR 7,806 million from Mobile Networks and spent EUR 4,855 million on R&D, equal to about 24% of its EUR 19,889 million revenue. Cisco recorded USD 28,304 million in FY2025 Networking revenue, although this declined 3% year on year. Based on installed network scale and software reach, Ericsson, Huawei, and Nokia appear to hold the strongest positions.
Tier-2 specialists, including Keysight, Viavi, NetScout, Anritsu, Spirent, Rohde & Schwarz, Radcom, Infovista, Teoco, and Juniper, focus on testing, assurance, visibility, and performance analytics. Keysight generated USD 5,375 million in FY2025 revenue, including around USD 3.71 billion from Communications Solutions, while investing USD 1,007 million, or 18.7% of revenue, in R&D.
Its USD 1.4 billion acquisition of Spirent strengthened its 5G and Open RAN capabilities. Viavi generated USD 776.6 million, or 71.6% of USD 1,084.3 million total revenue, with segment sales rising 10.6%. Tier-1 vendors are estimated to represent 55–65% of addressable spending, while Tier-2 specialists may hold 25–35%, with the remainder shared by smaller vendors and integrators.
Top Key Players in the Market
- Ericsson
- Nokia
- Huawei Technologies
- ZTE Corporation
- Cisco Systems
- NEC Corporation
- Samsung Electronics
- Juniper Networks
- Viavi Solutions
- Anritsu Corporation
- Spirent Communications
- Keysight Technologies
- Rohde and Schwarz
- Infovista
- Radcom Ltd.
- Teoco Corporation
- NetScout Systems
Recent Developments
- In 2026, ZTE and AIS commercially deployed ZTE’s AIR RAN solution in Thailand after using it at the Big Mountain Music Festival. Downlink PRB utilization exceeded 80%, while uplink utilization was above 60%. AIR RAN increased TikTok throughput by 23.74% and Line messaging throughput by 31.86%, demonstrating the growing commercial use of AI-based RAN monitoring and automated network optimization.
- In 2025, Keysight Technologies completed its acquisition of Spirent Communications on October 15 for approximately GBP 1.16 billion, equivalent to around USD 1.46 billion. Spirent shareholders received 202.5 pence per share, including 199 pence in cash and a 3.5-pence special dividend.
Report Scope
| Report Features | Description |
|---|---|
| Market Value (2025) | USD 1,994.7 Million |
| Forecast Revenue (2035) | USD 5,818.6 Million |
| CAGR (2026-2035) | 11.3% |
| Base Year for Estimation | 2025 |
| Historic Period | 2020-2024 |
| Forecast Period | 2026-2035 |
| Report Coverage | Revenue Forecast, Market Dynamics, Competitive Landscape, Recent Developments |
| Segments Covered | By Component (Solution, Services); By Application (5G, 4G, 3G and 2G); By End-User (Telecommunications, IT, Healthcare, BFSI, Retail, Manufacturing, Others) |
| Regional Analysis | North America – US, Canada; Europe – Germany, France, The UK, Spain, Italy, Rest of Europe; Asia Pacific – China, Japan, South Korea, India, Australia, Singapore, Rest of APAC; Latin America – Brazil, Mexico, Rest of Latin America; Middle East & Africa – GCC, South Africa, Rest of MEA |
| Competitive Landscape | Ericsson, Nokia, Huawei Technologies, ZTE Corporation, Cisco Systems, NEC Corporation, Samsung Electronics, Juniper Networks, Viavi Solutions, Anritsu Corporation, Spirent Communications, Keysight Technologies, Rohde and Schwarz, Infovista, Radcom Ltd., Teoco Corporation, NetScout Systems |
| Customization Scope | We will provide customization for segments and region/country levels. Moreover, additional customization can be done based on the requirements. |
| Purchase Options | We have three licenses to opt for: Single User License, Multi-User License (Up to 5 Users), Corporate Use License (Unlimited Users and Printable PDF) |





























