Report Overview
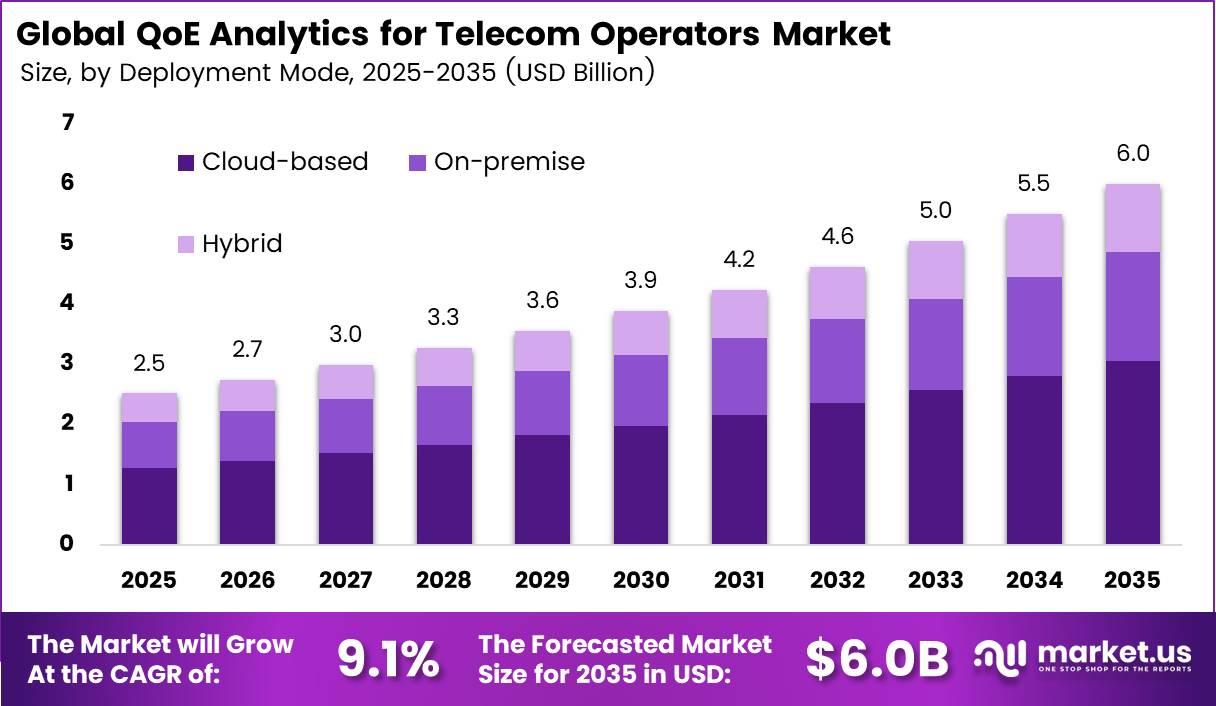
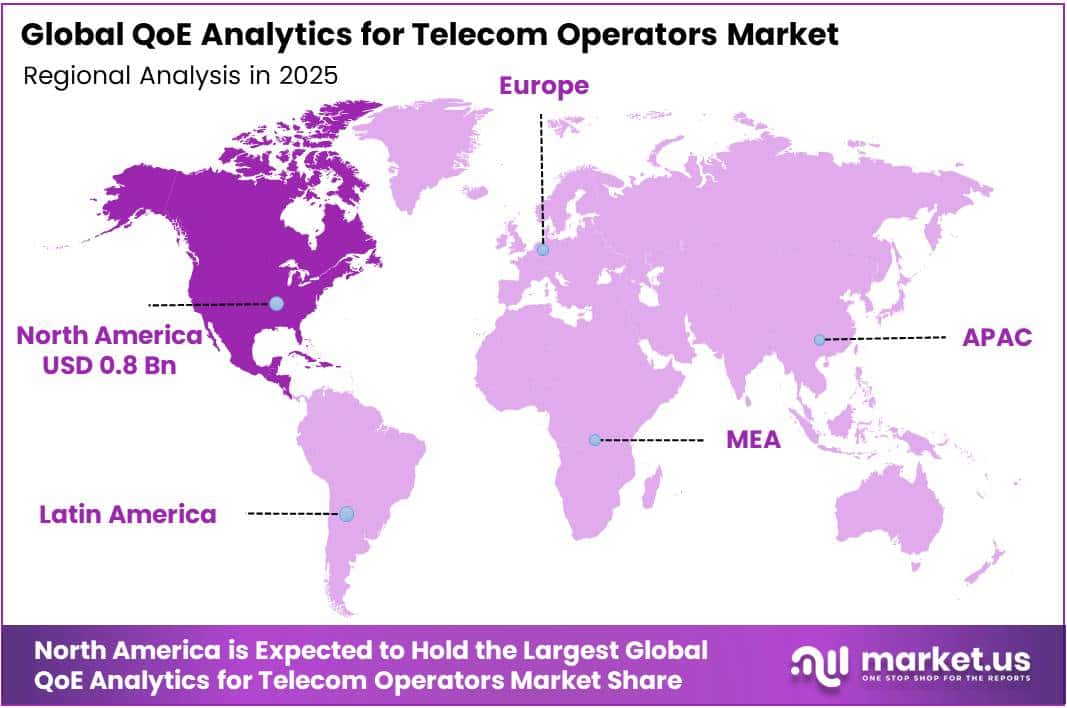
In 2025, the Global QoE Analytics for Telecom Operators Market was valued at USD 2.5 billion. The market is projected to grow at a CAGR of 9.1% during 2026–2035, reaching approximately USD 6.0 billion by 2035. North America dominated the global market in 2025, accounting for more than 30.8% of the total market share and generating approximately USD 0.8 billion in revenue.
Growth comes from more users and heavier data traffic on mobile networks. According to the ITU, about 6 billion people used the internet in 2025, up from 5.8 billion in 2024. The online population grew by more than 240 million people in a single year. The ITU also counted nearly 3 billion 5G subscriptions, or about 36% of all mobile broadband subscriptions.
5G now covers 55% of the world’s population. Each new 5G user creates more video, gaming and cloud sessions that operators must track in real time. Operators therefore buy QoE analytics to find weak cells, fix slow sessions, and keep paying customers. Ericsson grew its Networks and Cloud Software and Services sales in 2025, which shows that operators keep spending on software even in a flat radio market.
The North America region gains from high incomes and mature 5G networks. The ITU reports that 5G reaches 84% of people in high-income countries but only 4% in low-income countries, an 80-percentage-point gap. Users in high-income countries also generate nearly 8 times more mobile data than users in low-income countries.
Key Takeaways
- The QoE Analytics for Telecom Operators Market reached USD 2.5 billion in 2025 and will hit USD 6.0 billion by 2035. at a 9.1% CAGR from 2026 to 2035.
- By component, Software leads with a 72.3% share.
- By deployment, Cloud leads with a 45.2% share and also grows the fastest.
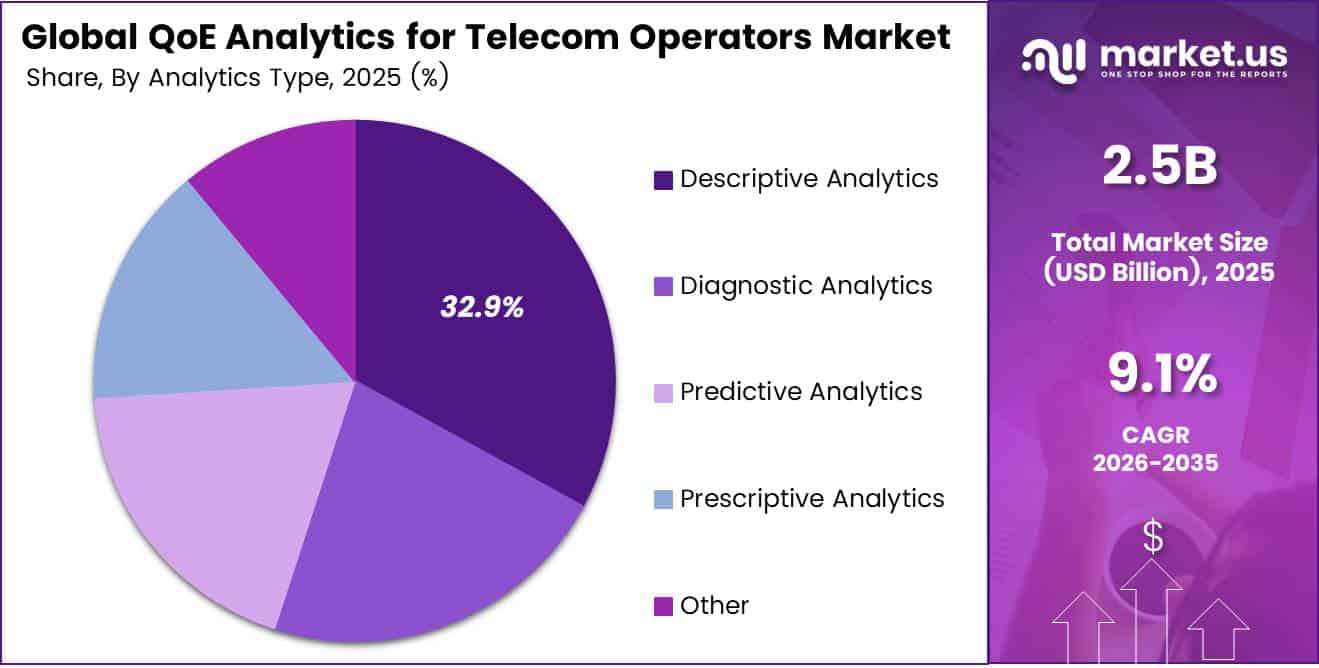
- By analytics type, Descriptive Analytics leads with a 32.9% share and also grows the fastest.
- By application, Network Performance Management leads with a 25.0% share and also grows the fastest.
- By organization type, Large Operators lead with an 81.9% share.
- North America leads with a 30.8% share and USD 0.8 billion in revenue.
By Component
Software dominates with 72.3% due to real-time network data processing needs.
Telecom operators rely on software to watch huge flows of network traffic every second. Ericsson reports that mobile network data traffic grew 23% between Q2 2025 and Q2 2026. No team of engineers can track that growth by hand. Operators therefore buy analytics platforms that score video, voice, and browsing quality in real time.
Software also scales well across new networks. Ericsson counts close to 3.3 billion 5G subscriptions worldwide, and each one creates fresh quality data. Operators can add new probes, dashboards, and alarms to one software stack instead of buying new hardware. This flexible model keeps software spending ahead of every other component.
Services are the fastest-growing component because operators now need outside help to turn data into action. The GSMA finds that 45% of operators now treat AI monetisation as a strategic priority. Many of them lack in-house data scientists. They hire professional teams to set up models and managed service partners to run them daily.
By Deployment
Cloud dominates with 45.2% due to elastic capacity for traffic spikes.
Cloud platforms lead because operators want to store and study quality data without building new data centers. The GSMA says the mobile sector produced $7.6 trillion in economic value in 2025, equal to 6.4% of global GDP. Activity on that scale creates data loads that change by the hour. Cloud tools let operators add or cut computing power on demand.
Cloud is also the fastest-growing option. Ericsson expects total mobile data traffic to reach 328 EB per month in 2031, about 2.2 times today’s level. Keeping that much data on local servers would cost operators a great deal. The GSMA also expects mobile’s economic impact to climb to $11.3 trillion by 2030.
By Analytics Type
Descriptive Analytics dominates with 32.9% due to simple dashboards showing past network performance.
Descriptive analytics leads because every operator first needs a clear picture of what already happened on its network. These tools turn raw logs into easy reports on dropped calls, slow speeds, and video buffering. ITU data shows that about 6 billion people, or 74% of the world, used the internet in 2025. Operators must report on quality across that very large user base.
Descriptive analytics is also growing fastest as new users and new regions join networks. ITU notes that 2.2 billion people remain offline, and many of them will connect through lower-cost operators. ITU also reports 5G coverage of 84% in high-income countries but only 4% in low-income ones. As operators expand into these gaps, they need basic visibility before they move on to advanced forecasting.
By Application
Network Performance Management dominates with 25.0% due to constant tracking of speed and latency.
Network performance management holds the top spot because poor speed or high latency hurts every service an operator sells. Ericsson reports that average mobile data use reached 22 GB per active smartphone each month at the end of 2025. Heavy video use pushes cells close to their limits, so operators track throughput, delay, and packet loss around the clock.
Performance management is also the fastest-growing application as 5G changes traffic patterns. The share of mobile data carried over 5G jumped from 34% to 48% during 2025, and Ericsson expects it to reach 85% in 2031. ITU data shows that 5G now covers 55% of the world’s population. New 5G slices, fixed wireless access, and cloud gaming all need tight performance targets.
By Organization Type
Large Operators dominate with 81.9% due to big budgets and multi-country networks.
Large operators lead because they run vast networks and have the money to buy full analytics suites. The GSMA reports that Asia Pacific operators spent nearly $220 billion on network infrastructure from 2019 to 2024, mostly on 5G. Firms that invest at this scale need strong tools to prove that each new site delivers good service.
Big players also face pressure to show returns. The GSMA notes that capital intensity peaked at 25% in 2023, so large operators now use QoE data to guide spending. Jio’s 5G standalone network in India serves over 60% of the population, which shows how big the networks these groups monitor have become.
Small and medium-sized operators are the fastest-growing group. Many serve rural and regional areas, where ITU finds that 5G reaches only 40% of people, compared with 66% in cities. As these operators close the gap, cloud tools with pay-as-you-go pricing let them buy QoE analytics without high upfront costs.
Key Market Segments
By Component
- Software
- Network Analytics
- Performance Monitoring Tools
- Customer Experience Management
- Predictive and Prescriptive Analytics
- Other Softwares
- Services
- Professional Services
- Managed Services
- Support and Maintenance Services
By Deployment
- Cloud
- On-premises
- Hybrid
By Analytics Type
- Descriptive Analytics
- Diagnostic Analytics
- Predictive Analytics
- Prescriptive Analytics
- Other
By Application
- Network Performance Management
- Service Quality Monitoring
- Customer Experience Management
- Churn Prediction and Retention Management
- Root-Cause Analysis and Anomaly Detection
- Network Investment and Capacity Planning
- Other
By Organization Type
- Large Operators
- Small and Medium-Sized Operators
Geopolitical Impact Analysis
Trade tensions shape the cost of the hardware behind QoE analytics, such as probes, servers, and test equipment. In its April 2025 outlook, the WTO expected world merchandise trade volume to fall by 0.2% in 2025. That was nearly 3 percentage points below the no-tariff baseline. The WTO also expected North American exports to drop by 12.6%. Probe and server makers that ship across the Pacific face these shifts first.
US and China tariffs climbed past 100% on each other’s goods during the 2025 trade conflict. The WTO warned that a full return of broad tariffs could push global goods trade down by 1.5%. That would be the steepest fall since 2020. Network test vendors depend on chips and optical parts from Asia, so these tariffs raise their bill of materials.
Demand for AI hardware softened the blow. The WTO found that AI-related goods, including semiconductors, servers and telecom equipment, rose 20% in value in the first half of 2025. These goods drove nearly half of all trade growth in that period. Global merchandise trade volume grew 4.9%, partly because North American buyers stocked up before tariff hikes.
The WTO cut its 2026 trade growth forecast to just 0.5%, down from 2.4% in 2025. It also warned that rising input prices could lift inflation as stockpiles shrink. Higher hardware costs push operators toward cloud and software-only QoE tools. This shift supports the strong position of cloud deployment in the market.
Regional Analysis
North America dominates the QoE Analytics for Telecom Operators Market, holding a 30.8% share and generating USD 0.8 billion in revenue. The US and Canada run some of the most advanced 5G standalone and fiber networks in the world. Carriers in both countries compete hard on network quality, so they invest in tools that show how each customer experiences video, voice, and gaming.
The ITU reports that in high-income countries, 5G covers 89% of urban residents but only 59% of rural residents. This 30-point gap creates a clear need for analytics. Operators use QoE data to decide where to add rural capacity and which towers to upgrade first. Large US carriers also lead in network slicing, fixed wireless access, and private 5G for business clients.
Asia Pacific is the fastest-growing region in the QoE Analytics for Telecom Operators Market. The ITU reports that 5G covers 70% of the population in Asia Pacific. China, South Korea, and Japan run dense 5G networks with heavy video traffic. India keeps adding mobile users at a fast pace, which puts pressure on network quality.
Europe holds a strong second position, backed by the highest 5G coverage of any region. The ITU reports that 5G reaches 74% of Europe’s population. Germany, France, the UK, Spain, and Italy all run mature networks with tight regulations on quality and customer rights. European operators face flat revenue per user, so they use QoE analytics to cut churn and spend capital wisely.
Key Regions and Countries
North America
- US
- Canada
Europe
- Germany
- France
- The UK
- Spain
- Italy
- Rest of Europe
Asia Pacific
- China
- Japan
- South Korea
- India
- Australia
- Rest of APAC
Latin America
- Brazil
- Mexico
- Rest of Latin America
Middle East and Africa
- GCC
- South Africa
- Rest of MEA
Market Dynamics
Drivers
| Driver | (~) % Impact on CAGR Forecast | Geographic Relevance | Impact Timeline |
|---|---|---|---|
| Video-Heavy Mobile Traffic Growth | +2.4% | Global, led by India and China | Short term (2 years or less) |
| Autonomous Network Service Assurance Programs | +1.6% | APAC, Europe, Middle East | Medium term (2 to 4 years) |
| 5G Standalone Traffic Migration | +1.2% | North America, East Asia, GCC | Short term (2 years or less) |
| Churn Reduction Pressure in Saturated Markets | +0.9% | Western Europe, North America | Short term (2 years or less) |
| Fixed Wireless Access Expansion | +0.7% | US, India, MEA | Medium term (2 to 4 years) |
Video-Heavy Mobile Traffic Growth
The root cause is a structural shift in what moves over mobile networks. Per Ericsson Mobility Report tracking, mobile network data traffic grew 20% between Q3 2024 and Q3 2025 and reached 188 EB per month. Video made up 76% of all mobile data traffic by the end of 2025, up from 74% a year earlier.
The quantitative mechanism comes from user-level intensity. According to Ericsson subscriber-cluster data, social media video now drives 70–80% of smartphone video traffic, and global use per active smartphone reached 22 GB per month at the end of 2025. Use in the India region reached 37 GB and is projected to hit 70 GB by 2031.
Restraints
| Restraint | (~) % Impact on CAGR Forecast | Geographic Relevance | Impact Timeline |
|---|---|---|---|
| Subscriber Data Privacy Compliance Limits | -1.3% | EU, UK, India | Short term (2 years or less) |
| Frozen Operator OpEx and Software Budgets | -0.9% | Europe, Latin America | Short term (2 years or less) |
| End-to-End Encryption Blind Spots | -0.6% | Global | Medium term (2 to 4 years) |
| Data Localization Mandates | -0.4% | China, Russia, Indonesia, GCC | Medium term (2 to 4 years) |
| Vendor Lock-In with Legacy Probe Contracts | -0.3% | North America, Europe | Short term (2 years or less) |
Subscriber Data Privacy Compliance Limits
The root cause is that QoE analytics depends on session-level subscriber data, while data rules keep tightening. The bottleneck is legal review time and a narrower data scope. Electronic communications services themselves sit outside the Data Act’s scope, but QoE platforms ingest data from connected devices and related services that do fall inside it.
That creates mixed-regime projects that need clause-by-clause contract review. GDPR already allows fines of up to 4% of global annual turnover, which pushes legal teams to strip or anonymize identifiers before data reaches analytics.
Challenges
| Challenge | (~) % CAGR Friction Drag | Geographic Relevance | Mitigation Horizon |
|---|---|---|---|
| Multi-Vendor Data Integration Complexity | -0.9% | Global | Medium term (2 to 4 years) |
| Telecom Data Science Talent Gap | -0.6% | Europe, APAC, MEA | Long term (4 years or more) |
| Uneven Traffic Density Modeling | -0.4% | Emerging markets, rural regions | Medium term (2 to 4 years) |
| QoE Metric Standardization Gaps | -0.3% | Global | Medium term (2 to 4 years) |
| Cloud Compute Cost Volatility | -0.2% | North America, Europe | Short term (2 years or less) |
Multi-Vendor Data Integration Complexity
The structural weakness is that operators run mixed RAN, core, transport, and OSS stacks from several vendors, each with its own counters and data formats. TM Forum autonomous network tracking shows the scale of the integration task. 81% of operators aim for Level 4 autonomy or above by 2030, yet only 40 ANLAV validations had been awarded to 17 companies by mid-2026.
The friction is measurable even in leading deployments. Per Ericsson’s disclosure on Malaysia’s Digital Nasional Berhad, the world-first TM Forum Level 4 validation in service assurance covered a single service scenario: throughput management.
It was achieved on a single-vendor 5G wholesale network. Ericsson also notes that traffic in dense urban locations can be up to 1,000 times higher than in rural areas, so a single model across the network often fails.
Opportunities
| Opportunity | (~) % Potential CAGR Upside | Geographic Relevance | Execution Window |
|---|---|---|---|
| QoE-Based Differentiated Connectivity Monetization | +1.7% | North America, Europe, GCC | Medium term (2 to 4 years) |
| XR and GenAI Uplink Experience Assurance | +0.9% | East Asia, North America | Long term (4 years or more) |
| Enterprise Private Network QoE Services | +0.7% | Europe, Japan, US | Medium term (2 to 4 years) |
| Tier-2 Operator SaaS Roll-Ups | +0.5% | Latin America, Africa, Southeast Asia | Short term (2 years or less) |
| QoE Data Sharing with Content Platforms | +0.4% | Global | Long term (4 years or more) |
QoE-Based Differentiated Connectivity Monetization
This remains white space because most operators still use QoE data to cut costs, not to price services. TM Forum’s autonomous networks research shows the industry shifting from cost cutting to revenue growth, with operators looking to monetize network quality, resilience, and customer experience. 75% of operators plan to raise autonomous network investment by 2026.
The unit-economic case comes from the steady shift of traffic onto 5G. Per Ericsson Mobility Report forecasts, the 5G share of mobile data traffic rose from 34% to 48% during 2025 and is projected to reach 85% by 2031. Total mobile data traffic is expected to grow about 2.2 times to 328 EB per month.
Key Players Analysis
Tier 1 leaders include Ericsson, Nokia, Cisco, Keysight and VIAVI, which combine global reach with large R&D budgets. Ericsson reported 2025 net sales of SEK 236.7 billion, against SEK 247.9 billion in 2024. Its fourth-quarter sales reached SEK 69.3 billion. Ericsson grew its Networks and Cloud Software and Services lines and kept investing in AI-native, autonomous network R&D.
VIAVI built scale in test and assurance. Its Network and Service Enablement revenue rose 74.1% to USD 376.1 million in one recent quarter. Acquired Spirent product lines added USD 52.7 million of that total. VIAVI also raised about USD 500 million in a stock offering, mainly to repay the remaining USD 450 million of its term loan.
Tier 2 challengers, such as RADCOM, Mobileum, NETSCOUT, Infovista, MedUX, Ookla and Rohde and Schwarz, hold strong niche positions. RADCOM grew its 2025 GAAP operating income to USD 8.3 million, more than double the prior year. Its net income rose to USD 11.99 million. RADCOM’s AI assurance platform now supports more than 43 million connections for Global across Europe, North America and Asia.
Results show that smaller players face more swings. RADCOM’s third-quarter 2026 revenue reached USD 14.0 million, down 23.6% year over year but up 19.4% from the prior quarter. This shows how much niche vendors depend on the timing of large operator contracts. Tier 1 firms reduce that risk through broad portfolios and steady acquisitions.
Top Key Players in the Market
- Ericsson
- Nokia Corporation
- Cisco Systems, Inc.
- Mobileum Inc.
- RADCOM Ltd.
- NETSCOUT SYSTEMS, INC.
- Infovista S.A.S.
- MedUX
- Ookla, LLC
- Rohde & Schwarz GmbH & Co. KG
- VIAVI Solutions Inc.
- Keysight Technologies, Inc.
Recent Developments
- In February 2025, Nokia Corporation completed its purchase of Infinera at USD 6.65 per share, an enterprise value of USD 2.3 billion, to expand its optical networking business.
- In March 2025, VIAVI Solutions Inc. signed a deal to buy Spirent’s high-speed Ethernet and network security lines from Keysight for USD 410 million in base cash plus USD 15 million in contingent cash.
- In October 2025, Keysight Technologies, Inc. completed its acquisition of Spirent Communications plc for about GBP 1.16 billion (around USD 1.46 billion), paying 202.5 pence per share.
- In October 2025, VIAVI Solutions Inc. closed the Spirent business purchase for USD 425 million in cash, expecting USD 180 million in added revenue within 12 months, and took a USD 600 million term loan.
- In February 2026, RADCOM Ltd. reported record 2025 revenue of USD 71.5 million, up 17.2% from USD 61.0 million, marking 6 straight years of growth.
Report Scope
| Report Features | Description |
|---|---|
| Market Value (2025) | USD 2.5 Billion |
| Forecast Revenue (2035) | USD 6.0 Billion |
| CAGR (2026-2035) | 9.1% |
| Base Year for Estimation | 2025 |
| Historic Period | 2020-2024 |
| Forecast Period | 2026-2035 |
| Report Coverage | Revenue Forecast, Market Dynamics, Competitive Landscape, Recent Developments |
| Segments Covered | By Component (Software, Network Analytics, Performance Monitoring Tools, Customer Experience Management, Predictive and Prescriptive Analytics, Other Softwares, Services, Professional Services, Managed Services, Support and Maintenance Services); By Deployment (Cloud, On-premises, Hybrid); By Analytics Type (Descriptive Analytics, Diagnostic Analytics, Predictive Analytics, Prescriptive Analytics, Other); By Application (Network Performance Management, Service Quality Monitoring, Customer Experience Management, Churn Prediction and Retention Management, Root-Cause Analysis and Anomaly Detection, Network Investment and Capacity Planning, Other); By Organization Type (Large Operators, Small and Medium-Sized Operators) |
| Regional Analysis | North America – US, Canada; Europe – Germany, France, The UK, Spain, Italy, Rest of Europe; Asia Pacific – China, Japan, South Korea, India, Australia, Singapore, Rest of APAC; Latin America – Brazil, Mexico, Rest of Latin America; Middle East & Africa – GCC, South Africa, Rest of MEA |
| Competitive Landscape | Ericsson, Nokia Corporation, Cisco Systems, Inc., Mobileum Inc., RADCOM Ltd., NETSCOUT SYSTEMS, INC., Infovista S.A.S., MedUX, Ookla, LLC, Rohde & Schwarz GmbH & Co. KG, VIAVI Solutions Inc., Keysight Technologies, Inc. |
| Customization Scope | Customization for segments and region/country-level will be provided. Moreover, additional customization can be done based on the requirements. |
| Purchase Options | We have three licenses to opt for: Single User License, Multi-User License (Up to 5 Users), Corporate Use License (Unlimited Users and Printable PDF) |