


Market Overview
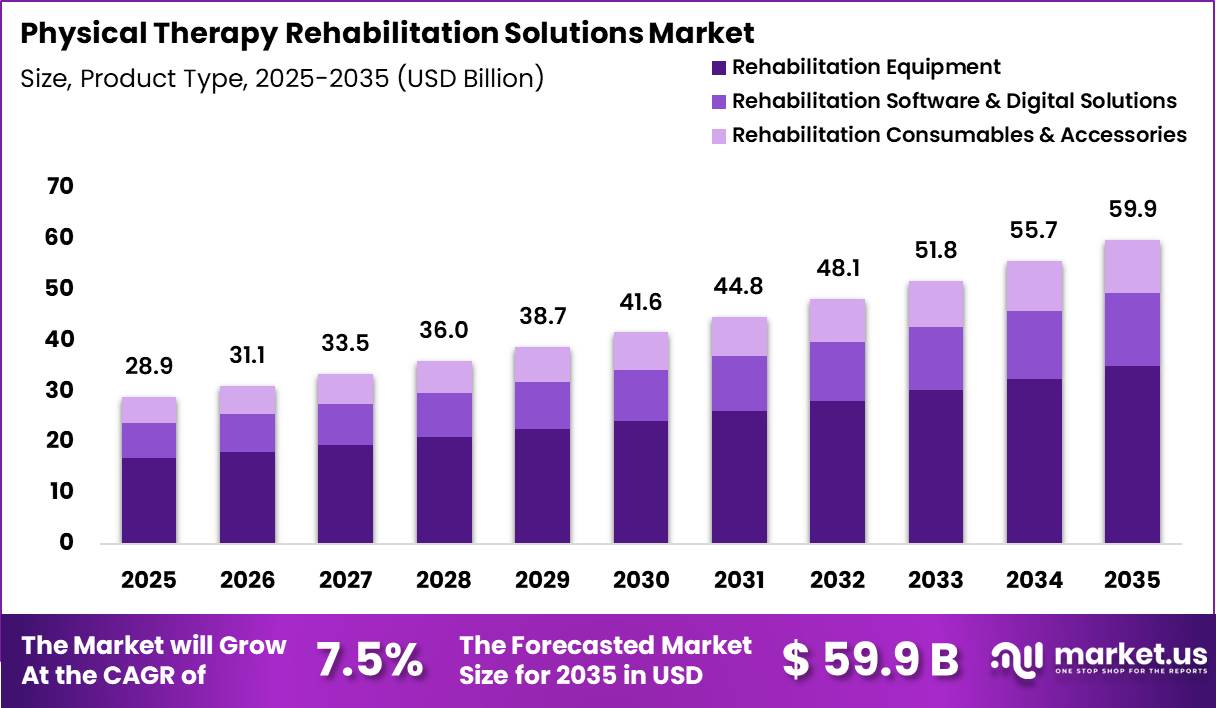
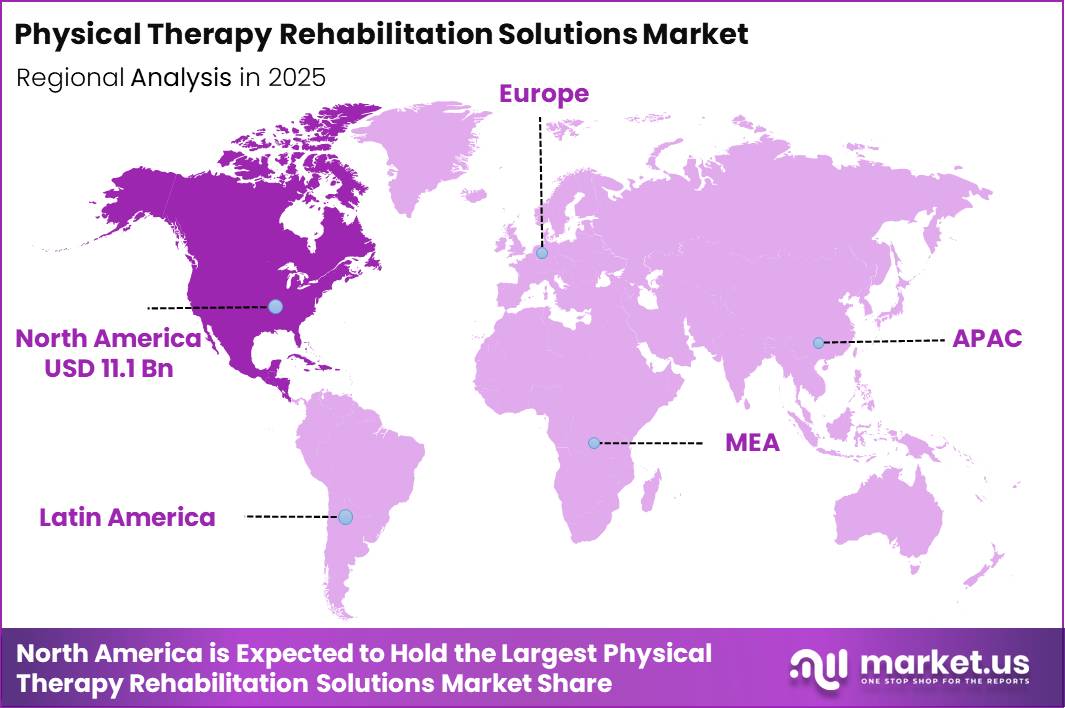
Global Physical Therapy Rehabilitation Solutions Market size is expected to be worth around US$ 59.9 Billion by 2035 from US$ 28.9 Billion in 2025, growing at a CAGR of 7.5% during the forecast period from 2026 to 2035. In 2025, North America led the market, achieving over 38.5% share with a revenue of US$ 11.1 Billion.
The Physical Therapy Rehabilitation Solutions Market is supported by growing global demand for rehabilitation services addressing mobility limitations, injuries, surgery recovery, chronic diseases, aging-related conditions, and musculoskeletal disorders.
According to the World Health Organization (WHO), approximately 2.4 billion people worldwide live with a health condition that could benefit from rehabilitation. WHO also reports that rehabilitation needs are expected to increase as populations age and chronic diseases and disability become more prevalent.
The need for physical therapy is also linked to the significant global burden of musculoskeletal conditions. WHO estimates that approximately 1.71 billion people worldwide live with musculoskeletal conditions, making rehabilitation an important component of maintaining mobility and functional independence.
In the United States, the U.S. Bureau of Labor Statistics (BLS) projects employment of physical therapists to grow by 11% between 2024 and 2034, with approximately 13,200 openings annually. BLS identifies population aging, mobility-related disabilities, injuries, diabetes, obesity, and musculoskeletal disorders as factors contributing to demand for physical therapy services.
Workforce availability remains an important consideration. A 2025 APTA forecast projects physical therapist service demand to increase by 14.8% by 2037, while the baseline scenario estimates a 3.3% shortfall in supply relative to demand by that year. These trends highlight the importance of expanding accessible and efficient rehabilitation solutions.
Key Takeaways
- Market Size: Global Physical Therapy Rehabilitation Solutions Market size is expected to be worth around US$ 59.9 Billion by 2035 from US$ 28.9 Billion in 2025.
- Market Share: The market is growing at a CAGR of 7.5% during the forecast period from 2026 to 2035.
- Product Type: The Product Type segment of the Physical Therapy Rehabilitation Solutions Market is led by Rehabilitation Equipment, which accounted for 58.4% of the market share in 2025.
- Application: The Application segment of the Physical Therapy Rehabilitation Solutions Market is dominated by Osteoarthritis Management, which held a 17.8% market share in 2025.
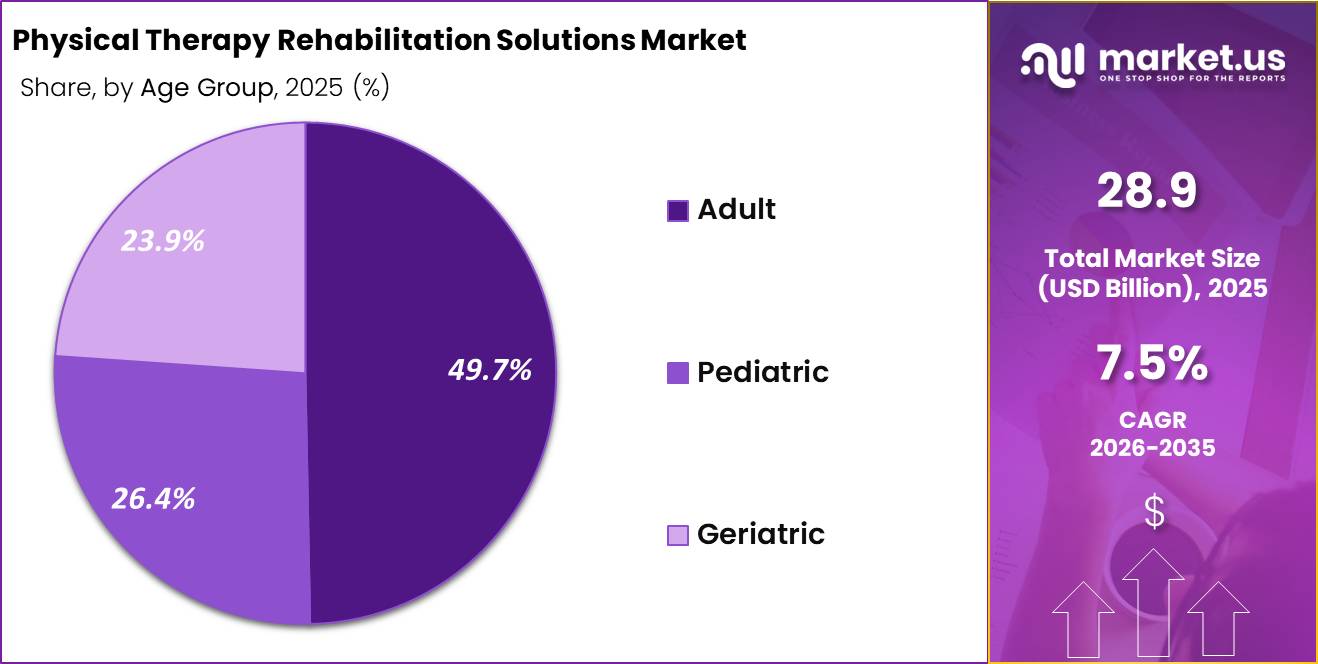
- Age Group: The Age Group segment is led by Adults, who accounted for 49.7% of the Physical Therapy Rehabilitation Solutions Market in 2025.
- Delivery Mode: The Delivery Mode segment of the Physical Therapy Rehabilitation Solutions Market is led by In-Person Rehabilitation, which accounted for 56.8% of the market share in 2025.
- End User: The End User segment of the Physical Therapy Rehabilitation Solutions Market is led by Physical Therapy & Rehabilitation Clinics, which accounted for 29.4% of the market share in 2025.
- Regional Analysis: In 2025, North America led the market, achieving over 38.5% share with a revenue of US$ 11.1 Billion.
Product Type Analysis
Product Type segment of the Physical Therapy Rehabilitation Solutions Market is led by Rehabilitation Equipment.
The Product Type segment of the Physical Therapy Rehabilitation Solutions Market is led by Rehabilitation Equipment, which accounted for 58.4% of the market share in 2025.
This segment includes therapeutic exercise equipment, mobility aids, electrotherapy devices, and other specialized tools used to support physical recovery, improve mobility, and restore muscle function.
Strong demand is supported by the growing need for structured rehabilitation following surgeries, injuries, neurological disorders, and chronic musculoskeletal conditions.
Rehabilitation Software & Digital Solutions represented 24.1% of the market in 2025, reflecting the increasing adoption of digital therapy platforms, remote monitoring tools, rehabilitation applications, and technology-enabled treatment planning. These solutions help therapists track patient progress and personalize rehabilitation programs.
Meanwhile, Rehabilitation Consumables & Accessories accounted for 17.5%, supported by recurring demand for therapeutic tapes, braces, exercise bands, electrodes, and other rehabilitation supplies.
Overall, the product landscape is increasingly combining physical equipment with digital technologies, creating more connected and personalized rehabilitation pathways for patients across clinical and home-based settings.
Application Analysis
Application segment of the Physical Therapy Rehabilitation Solutions Market is dominated by Osteoarthritis Management.
The Application segment of the Physical Therapy Rehabilitation Solutions Market is dominated by Osteoarthritis Management, which held a 17.8% market share in 2025. The segment benefits from the widespread impact of joint degeneration and the growing use of physical therapy to improve mobility, manage pain, and delay functional decline.
Joint Replacement Recovery represented 14.9%, supported by rehabilitation requirements following hip and knee replacement procedures. Stroke Rehabilitation accounted for 13.9%, reflecting the need for long-term physical recovery and mobility support among stroke survivors.
Chronic Pain Management contributed 11.4%, while Sports Injury Recovery held 10.2%, driven by rehabilitation needs among athletes and physically active populations. Other applications included Spinal Cord Injury Rehabilitation (7.8%), Cardiac Rehabilitation (6.7%), and Parkinson’s Disease Rehabilitation (5.4%).
Traumatic Brain Injury Rehabilitation accounted for 3.9%, while Cerebral Palsy Rehabilitation and Pulmonary Rehabilitation each represented 2.7%. Others contributed 2.6%, demonstrating the broad application base of rehabilitation solutions.
Age Group Analysis
Age Group segment is led by Adults in the Physical Therapy Rehabilitation Solutions Market.
The Age Group segment is led by Adults, who accounted for 49.7% of the Physical Therapy Rehabilitation Solutions Market in 2025. The dominance of this segment is linked to the high prevalence of musculoskeletal conditions, sports injuries, chronic pain, post-surgical recovery needs, and neurological disorders among working-age populations.
Adults frequently require rehabilitation to restore mobility, improve physical function, and return to daily or occupational activities following injuries or medical procedures.
The Pediatric segment represented 26.4% of the market in 2025. Demand in this category is supported by rehabilitation requirements associated with developmental conditions, cerebral palsy, congenital disorders, neurological conditions, and childhood injuries.
Pediatric therapy often focuses on improving motor development, coordination, balance, and functional independence. Meanwhile, the Geriatric segment accounted for 23.9%, reflecting the increasing need for rehabilitation among older adults experiencing age-related mobility limitations, joint disorders, stroke, Parkinson’s disease, and recovery following orthopedic procedures.
Overall, demand across age groups highlights the importance of personalized rehabilitation programs tailored to different physical capabilities, medical conditions, and recovery objectives.
Delivery Mode Analysis
Delivery Mode segment of the Physical Therapy Rehabilitation Solutions Market is led by In-Person Rehabilitation.
The Delivery Mode segment of the Physical Therapy Rehabilitation Solutions Market is led by In-Person Rehabilitation, which accounted for 56.8% of the market share in 2025.
This model remains widely preferred for patients requiring direct therapist supervision, hands-on techniques, specialized rehabilitation equipment, and closely monitored exercises. In-person care is particularly important for individuals recovering from surgery, severe injuries, neurological disorders, and complex mobility conditions.
Home-Based Rehabilitation is gaining importance as patients increasingly seek convenient care outside traditional clinical environments. This approach supports continued therapy for individuals with limited mobility, elderly patients, and those requiring long-term rehabilitation.
Tele-Rehabilitation is also expanding through video consultations, digital exercise programs, remote progress tracking, and virtual therapist guidance, improving access for patients who face geographic or transportation barriers.
Meanwhile, Hybrid Rehabilitation Programs combine in-person sessions with home-based exercises and digital follow-up, offering greater flexibility while maintaining professional oversight.
The delivery landscape is therefore evolving toward a patient-centered model that combines direct clinical care with technology-enabled and home-based rehabilitation services.
End User Analysis
End User segment of the Physical Therapy Rehabilitation Solutions Market is led by Physical Therapy & Rehabilitation Clinics.
The End User segment of the Physical Therapy Rehabilitation Solutions Market is led by Physical Therapy & Rehabilitation Clinics, which accounted for 29.4% of the market share in 2025. These facilities remain important because they provide specialized therapy, structured treatment plans, rehabilitation equipment, and direct access to trained physical therapists.
Hospitals represent another significant end-user group, particularly for patients requiring rehabilitation after surgery, trauma, stroke, or serious medical conditions. Rehabilitation Centers provide intensive and specialized recovery programs, while Ambulatory Surgical Centers (ASCs) increasingly support rehabilitation following outpatient procedures.
Home Healthcare Settings are gaining attention as patients seek convenient and flexible recovery options, particularly among older adults and individuals with mobility limitations. Long-Term Care Facilities serve patients requiring ongoing rehabilitation and functional support.
Sports Medicine Centers focus on injury prevention, performance recovery, and return-to-activity programs for athletes. Academic & Research Institutes contribute through clinical research, therapy innovation, and technology development.
Others include additional healthcare and specialized care settings. Overall, the end-user landscape reflects the expanding integration of rehabilitation services across clinical, community, residential, and research environments.
Key Market Segments
Product Type
- Rehabilitation Equipment
- Rehabilitation Software & Digital Solutions
- Rehabilitation Consumables & Accessories
Application
- Osteoarthritis Management
- Joint Replacement Recovery
- Stroke Rehabilitation
- Chronic Pain Management
- Sports Injury Recovery
- Spinal Cord Injury Rehabilitation
- Cardiac Rehabilitation
- Parkinson’s Disease Rehabilitation
- Traumatic Brain Injury Rehabilitation
- Cerebral Palsy Rehabilitation
- Pulmonary Rehabilitation
- Others
Age Group
- Adult
- Pediatric
- Geriatric
Delivery Mode
- In-Person Rehabilitation
- Home-Based Rehabilitation
- Tele-Rehabilitation
- Hybrid Rehabilitation Programs
End User
- Hospitals
- Physical Therapy & Rehabilitation Clinics
- Rehabilitation Centers
- Ambulatory Surgical Centers (ASCs)
- Home Healthcare Settings
- Long-Term Care Facilities
- Sports Medicine Centers
- Academic & Research Institutes
- Others
Driver
Public Health Rehabilitation Policies Accelerate System Expansion and Adoption.
A second major driver is the elevation of rehabilitation from an ancillary service to a core health-system function, which improves long-horizon funding logic for workforce, infrastructure, and digital enablement.
WHO’s Rehabilitation 2030 agenda calls for integration of rehabilitation across all levels of care, explicit financing expansion, stronger workforce models, and health information systems that measure functioning, while the World Health Assembly’s earlier rehabilitation resolution reinforced national commitment to scale access.
The result is slower than reimbursement-driven demand, but structurally powerful: it raises the installed base for rehab software, scheduling systems, patient engagement tools, assistive integration, and interoperable outcome-measure platforms across both mature and underpenetrated markets.
In the U.S., 2026 payment design is pushing rehabilitation providers toward cost-accountable, outcome-linked service delivery rather than isolated fee-for-service activity, which directly benefits solutions that improve throughput, documentation quality, and post-acute coordination.
At the same time, 2026 outpatient therapy billing remains tightly controlled through the $2,480 KX modifier threshold and $3,000 targeted medical review trigger, creating strong incentives for providers to deploy tools that justify medical necessity, reduce avoidable visit leakage, and prioritize patients most likely to benefit from skilled therapy.
Even where headline payment uplift is modest, this kind of reimbursement architecture tends to accelerate adoption of workflow software, automated coding support, triage algorithms, and hybrid care pathways because providers need lower documentation cost per episode and better functional outcomes per labor hour.
| Driver | (~) % Impact on CAGR Forecast | Geographic Relevance | Impact Timeline |
|---|---|---|---|
| Aging + chronic mobility burden | +2.1% | North America core, EU, Japan, advanced APAC | Medium term (2-4 years) |
| Rehab system expansion under public health policy | +1.6% | Global, with strongest lift in EU, APAC, LMIC urban systems | Long term (≥ 4 years) |
| Reimbursement shift to episode accountability | +1.4% | U.S. core, selective spill-over to private payer markets | Short term (≤ 2 years) |
| Telerehab and hybrid care normalization | +1.8% | U.S., Canada, UK, Nordics, Australia, urban APAC | Short term (≤ 2 years) |
| AI-enabled and sensor-based therapy workflows | +1.5% | U.S., EU, South Korea, Japan, innovation-led APAC | Medium term (2-4 years) |
| Home-based rehab and falls-prevention demand | +1.3% | North America, EU, Japan, community-care systems globally | Medium term (2-4 years) |
Challenge
Low-Cost Infrastructure Gaps Limit Rehabilitation Market Expansion.
Infrastructure and device limitations in low- and middle-income regions are a long-horizon challenge that constrains global physical therapy rehabilitation market expansion, particularly across Latin America, Africa, and South Asia, where capital budgets for rehab equipment and clinic build-outs remain structurally tight relative to need.
Rehabilitation 2030 commentary highlights a substantial and increasing unmet need for rehabilitation worldwide, with the ageing of populations and rise of chronic conditions in LMICs outpacing investments in rehab infrastructure, resulting in lower per-capita availability of basic devices such as parallel bars, balance trainers, and continuous passive motion machines.
In many regional health systems, fewer than 1–2 dedicated rehab centers per million population exist, and public hospitals may operate with only 30–50% of recommended equipment capacity for musculoskeletal and neurological therapy, leading to short, low-intensity sessions and limited adoption of technology-enhanced rehab such as robotic gait trainers or VR-based pain distraction tools.
This infrastructure gap manifests as lower session counts per eligible patient, often 3–6 visits instead of guideline-consistent 10–20 visits, cutting potential revenue capture per case by more than half and depressing overall device and software sales despite high unmet need, which can reasonably be modeled as a 0.9% point drag on global market CAGR in 2026.
Over a ≥ 4 year horizon, mitigation depends on blended financing strategies that leverage multilateral funding, national health budgets, and private investment to lift equipment spend per facility by 30–50%, build more rehab centers integrated into primary and secondary care networks, and deploy lower-cost, ruggedized devices.
Digital platforms tailored to LMIC infrastructure constraints, gradually increasing utilization and enabling the market to tap into large unmet pools of patients who currently receive either minimal or non-specialized rehabilitation.
| Challenge | (~) % CAGR Friction Drag | Geographic Relevance | Mitigation Horizon |
|---|---|---|---|
| Fragmented rehab pathways | -1.6% | US, EU, APAC urban | Long term (≥ 4 years) |
| Workforce and skills gap | -1.4% | North America, EU, GCC, APAC | Long term (≥ 4 years) |
| Data interoperability deficit | -1.2% | US, EU, Asia hospital hubs | Medium term (2-4 years) |
| Payment complexity and caps | -1.0% | US, EU mixed-payer | Medium term (2-4 years) |
| Low-cost device and infra limits | -0.9% | LATAM, Africa, South Asia | Long term (≥ 4 years) |
| Adherence and engagement drop-off | -0.8% | Global outpatient | Short term (≤ 2 years) |
Restraints
Workforce Shortages Constrain Rehabilitation Capacity and Market Growth.
Workforce shortages and capacity constraints constitute a second-order but deeply structural restraint, as global rehabilitation needs (around 2.4 billion people and at least 1.7 billion with musculoskeletal conditions in need of rehabilitative interventions) vastly outstrip the available trained PT, OT, and interdisciplinary rehab workforce, creating systemic rationing of care that converts into unmet demand rather than incremental revenue.
WHO analyses highlight that many countries, especially in low- and middle-income regions and rural corridors of high-income markets, face both absolute staff shortages and severe geographic maldistribution, where provider density in metropolitan areas is 3–5 times that of non-metropolitan counties.
Mortality trends from musculoskeletal disorders and falls have risen nearly 195% from about 17,700 to over 52,000 deaths between 1999 and 2023, signaling that functional decline is not being managed adequately through rehabilitation pathways.
For physical therapy rehabilitation solutions vendors and providers, this translates into chronic understaffing, with vacancy rates of 10–15% for therapists and assistants, utilization ratios exceeding 90% in many public systems, and wait times stretching from an optimal 7–10 days to more than 4–6 weeks for non-urgent orthopedic or neurological rehab.
Particularly in APAC and emerging markets; as a result, throughput per installed solution is constrained by clinician availability rather than technology capacity.
Strategically, operators are forced to invest 3–5% of revenue annually in recruiting, incentive schemes, and training just to stabilize headcount, diverting capital away from technology upgrades, while health systems prioritize essential acute care positions over rehab staffing.
This produces a realistic 1.5% downward adjustment to medium- and long-term market CAGR, especially in APAC corridors and emerging markets where workforce bottlenecks are most pronounced and where task-shifting to assistants is limited by regulation.
| Restraint | (~) % Impact on CAGR Forecast | Geographic Relevance | Impact Timeline |
|---|---|---|---|
| Reimbursement compression and MPFS adjustments | -2.0% | North America core, selected EU | Short–Medium term |
| Workforce shortages and capacity constraints | -1.5% | Global, APAC corridors, EMs | Medium–Long term |
| Capital intensity of advanced rehab technologies | -1.2% | North America core, EU, urban APAC | Medium term |
| Fragmented digital and tele-rehab integration | -1.0% | North America, EU, APAC urban | Short–Medium term |
| Regulatory and documentation burden in rehab | -0.8% | North America core, EU | Short–Medium term |
| Patient affordability and co-pay sensitivity | -0.7% | North America, EMs, select EU | Short–Medium term |
Opportunity
Hybrid Digital-Physical Telerehab Platforms Unlock Scalable Rehabilitation Growth.
Hybrid telerehabilitation offers upside beyond the pandemic induced baseline adoption of video sessions by transforming what is currently episodic, provider initiated remote care into always on, data rich rehab ecosystems that combine in clinic sessions with asynchronous digital coaching, remote assessments, and sensor enabled home exercises.
Clinical studies during and after the COVID 19 period show high patient satisfaction rates and positive attitudes toward video based rehab, alongside therapist reports of reduced waiting lists and improved access, yet most implementations remain limited adjuncts rather than scaled business models with dedicated technology stacks, subscription pricing, and longitudinal outcome tracking.
If providers convert 20–30% of follow up visits into hybrid digital touchpoints, their capacity per therapist could increase by 25–35%, potentially lowering per episode operating costs by 10–20% while maintaining or improving outcome scores due to more frequent micro interventions.
Assuming that global physical therapy revenues approach USD 40–50 billion by the early 2030s, capturing even 15–20% of that value through hybrid platforms with ARPU in the USD 60–80 per month per active patient range could unlock an incremental USD 6–9 billion in platform based revenues, which sit largely outside current forecasts that treat telehealth as a temporary extension of traditional care.
The upside CAGR contribution is justified because hybrid platforms also structurally lower customer acquisition costs by converting one time rehab episodes into multi month subscription or membership relationships, potentially halving CAC per returning patient and pushing LTV:CAC ratios beyond 3:1 compared to the 1.5–2:1 typical of transactional visit models.
| Opportunity | (~) % Potential CAGR Upside | Geographic Relevance | Execution Window |
|---|---|---|---|
| Value-based post-acute rehab bundles | +2.3% | North America, EU, selective APAC | Medium term (2-4 years) |
| Hybrid digital-physical telerehab platforms | +2.0% | North America core, EU, APAC urban | Short–Medium term (≤ 4 years) |
| Aging-focused community rehab hubs | +1.8% | EU, Japan, China, LMIC urban | Medium–Long term (≥ 3 years) |
| AI-enabled personalized rehab pathways | +1.5% | U.S., Canada, Western Europe | Medium term (2-4 years) |
| Employer-paid MSK and return-to-work programs | +1.4% | North America, EU, GCC | Short term (≤ 2 years) |
| Integrated chronic disease rehab (e.g., diabetes) | +1.6% | Global, LMICs, U.S. rural & urban | Medium–Long term (≥ 3 years) |
Regional Analysis
North America led the Physical Therapy Rehabilitation Solutions Market.
North America led the Physical Therapy Rehabilitation Solutions Market in 2025, accounting for more than 38.5% of the global market share and generating approximately US$ 11.1 billion in revenue.
The region’s dominance is supported by advanced healthcare infrastructure, high adoption of rehabilitation technologies, and strong demand for physical therapy services. The United States remains a key contributor due to its extensive network of hospitals, outpatient rehabilitation centers, sports medicine facilities, and home-based therapy services.
Rising cases of musculoskeletal disorders, joint replacement procedures, sports injuries, and chronic conditions are further increasing the need for rehabilitation solutions.
The growing adoption of digital rehabilitation platforms, wearable monitoring devices, robotic-assisted therapy, and remote patient monitoring is also supporting market expansion across North America. Favorable reimbursement policies and continued healthcare technology investments are strengthening access to personalized rehabilitation services.
Meanwhile, Europe is benefiting from its aging population and established rehabilitation infrastructure, while Asia-Pacific is emerging as a high-growth region due to improving healthcare access, increasing medical expenditure, and greater awareness of physical therapy and rehabilitation services.
Key Regions and Countries
North America
- The US
- Canada
Europe
- Germany
- France
- The U.K.
- Italy
- Spain
- Russia & CIS
- Rest of Europe
Asia Pacific
- China
- India
- Japan
- South Korea
- ASEAN
- Australia & New Zealand
- Rest of Asia Pacific
Middle East & Africa
- GCC
- South Africa
- Rest of Middle East & Africa
Latin America
- Brazil
- Mexico
- Rest of Latin America
Key Player Analysis
The Physical Therapy Rehabilitation Solutions Market is moderately fragmented, with competition spread across rehabilitation providers, therapy management software companies, healthcare technology firms, medical device manufacturers, and integrated care networks.
Competitive dynamics are shaped by the growing need for coordinated rehabilitation, digital therapy management, remote monitoring, and efficient clinical workflows. Innovation is increasingly focused on connected rehabilitation platforms, data-driven care, virtual therapy, patient engagement tools, and solutions that improve outcomes while reducing administrative burdens.
Leading participants are strengthening their market positions by combining clinical expertise with technology-enabled services and broader healthcare ecosystems.
Key players are emphasizing R&D, strategic partnerships, product innovation, workflow integration, and ecosystem-based competition to differentiate their offerings.
Rehabilitation providers are expanding technology-enabled care models, while software companies focus on integrating scheduling, documentation, billing, patient management, and clinical data into unified workflows.
Partnerships with healthcare providers and technology stakeholders support broader solution deployment and interoperability. Product innovation is increasingly centered on digital rehabilitation, remote monitoring, and personalized therapy pathways.
Ecosystem-based competition is also intensifying as companies seek to connect therapists, patients, hospitals, payers, and healthcare systems through integrated platforms.
Top Key Players
- NovaCare Rehabilitation
- Athletico Physical Therapy
- Reflexion Health
- Cerner Corporation
- Kareo Inc.
- Therapy Sync
- eviCore Healthcare
- Meditab
- iSalus Healthcare
- Smith & Nephew
- CoRehab srl
- Invacare Corporation
- Encompass Health
- Select Medical
- Kindred Healthcare
- Other Key Players
Recent Developments
- In August 2025, Encompass Health and BSA Health System announced a joint venture to own and operate a 50-bed inpatient rehabilitation hospital in Amarillo Texas. The move demonstrates a partnership-led expansion strategy aimed at increasing access to specialized rehabilitation services.
- In January 2026, Select Medical and Vibra Healthcare signed a joint venture agreement to operate Southern Kentucky Rehabilitation Hospital. The 76-bed facility is intended to strengthen inpatient rehabilitation services for patients recovering from stroke, brain injuries, spinal cord injuries, and other complex conditions.
- In October 2025, Smith+Nephew and UFC announced a multi-year extension of their sports medicine technology partnership. The agreement keeps Smith+Nephew as UFC’s Preferred Sports Medicine Technology Partner and reinforces its focus on sports medicine technologies relevant to athlete injury management and recovery.
Report Scope
| Report Features | Description |
|---|---|
| Market Value (2025) | US$28.9 Billion |
| Forecast Revenue (2035) | US$59.9 Billion |
| CAGR (2026-2035) | 7.5% |
| Base Year for Estimation | 2025 |
| Historic Period | 2020-2024 |
| Forecast Period | 2026-2035 |
| Report Coverage | Revenue Forecast, Market Dynamics, Competitive Landscape, Recent Developments |
| Segments Covered | By Product Type (Rehabilitation Equipment, Rehabilitation Software & Digital Solutions, Rehabilitation Consumables & Accessories), By Application (Osteoarthritis Management, Joint Replacement Recovery, Stroke Rehabilitation, Chronic Pain Management, Sports Injury Recovery, Spinal Cord Injury Rehabilitation, Cardiac Rehabilitation, Parkinson’s Disease Rehabilitation, Traumatic Brain Injury Rehabilitation, Cerebral Palsy Rehabilitation, Pulmonary Rehabilitation, Others), By Age Group (Adult, Pediatric, Geriatric), By Delivery Mode (In-Person Rehabilitation, Home-Based Rehabilitation, Tele-Rehabilitation, Hybrid Rehabilitation Programs), By End User (Hospitals, Physical Therapy & Rehabilitation Clinics, Rehabilitation Centers, Ambulatory Surgical Centers (ASCs), Home Healthcare Settings, Long-Term Care Facilities, Sports Medicine Centers, Academic & Research Institutes, Others) |
| Regional Analysis | North America – The US, Canada; Europe – Germany, France, U.K., Italy, Spain, Russia & CIS, Rest of Europe; Asia Pacific – China, India, Japan, South Korea, ASEAN, Australia & New Zealand, Rest of Asia Pacific; Middle East & Africa – GCC, South Africa, Rest of Middle East & Africa; Latin America – Brazil, Mexico, Rest of Latin America |
| Competitive Landscape | NovaCare Rehabilitation, Athletico Physical Therapy, Reflexion Health, Cerner Corporation, Kareo Inc., Therapy Sync, eviCore Healthcare, Meditab, iSalus Healthcare, Smith & Nephew, CoRehab srl, Invacare Corporation, Encompass Health, Select Medical, Kindred Healthcare, Other Key Players |
| Customization Scope | Customization for segments, region/country-level will be provided. Moreover, additional customization can be done based on the requirements. |
| Purchase Options | We have three licenses to opt for: Single User License, Multi-User License (Up to 5 Users), Corporate Use License (Unlimited User and Printable PDF) |





































