


Report Overview
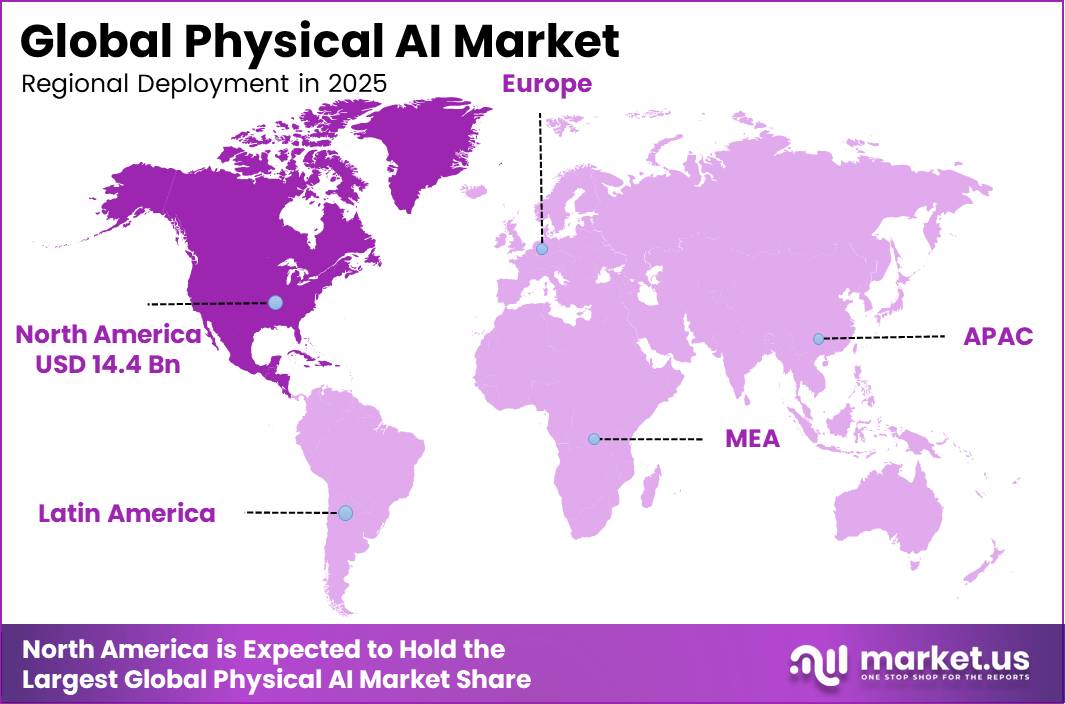
In 2025, the Global Physical AI Market was valued at USD 30.1 billion. The market is projected to grow at a CAGR of 33.7% during 2026–2035, reaching approximately USD 641.6 billion by 2035. North America dominated the global market in 2025, accounting for more than 48.0% of the total market share and generating approximately USD 14.4 billion in revenue.
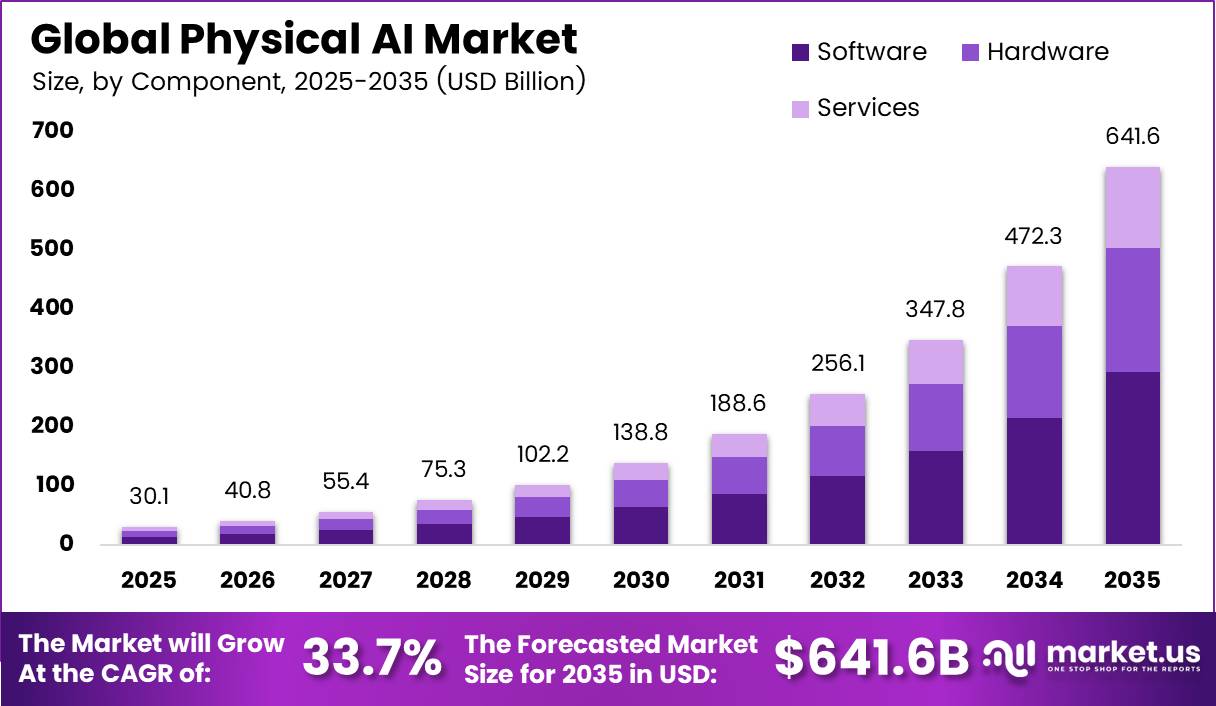
Manufacturing, logistics, healthcare, and mobility companies increasingly need machines that can sense conditions, make decisions, and perform physical work. The International Federation of Robotics reported that companies installed 542,000 industrial robots during 2024. The global operating stock reached 4.66 million units, up 9% from the prior year. Professional service robot sales approached 200,000 units and rose 9%.
These installations create demand for computer vision, control software, edge processors, simulation tools, and machine learning models. Physical AI also allows robots to adapt to variable products and workplaces instead of following only fixed instructions. This capability supports wider use in warehouses, hospitals, farms, vehicle plants, and public facilities.
North American region combines advanced cloud infrastructure, semiconductor design, industrial automation, research centers, and large technology budgets. The International Federation of Robotics measured 204 industrial robots per 10,000 manufacturing workers across North America in 2024. The United States reached 307 robots per 10,000 workers, while Canada reached 241. US companies also accounted for 68% of robot installations across the Americas.
Key Takeaways
- The Physical AI Market stood at USD 30.1 billion in 2025 and will reach USD 641.6 billion by 2035. The market will expand at a 33.7% CAGR from 2026 to 2035.
- Hardware led the component segment with a 57% share.
- Computer vision led the technology segment with a 43.0% share.
- Industrial robots led the robot type/form factor segment with a 39.0% share.
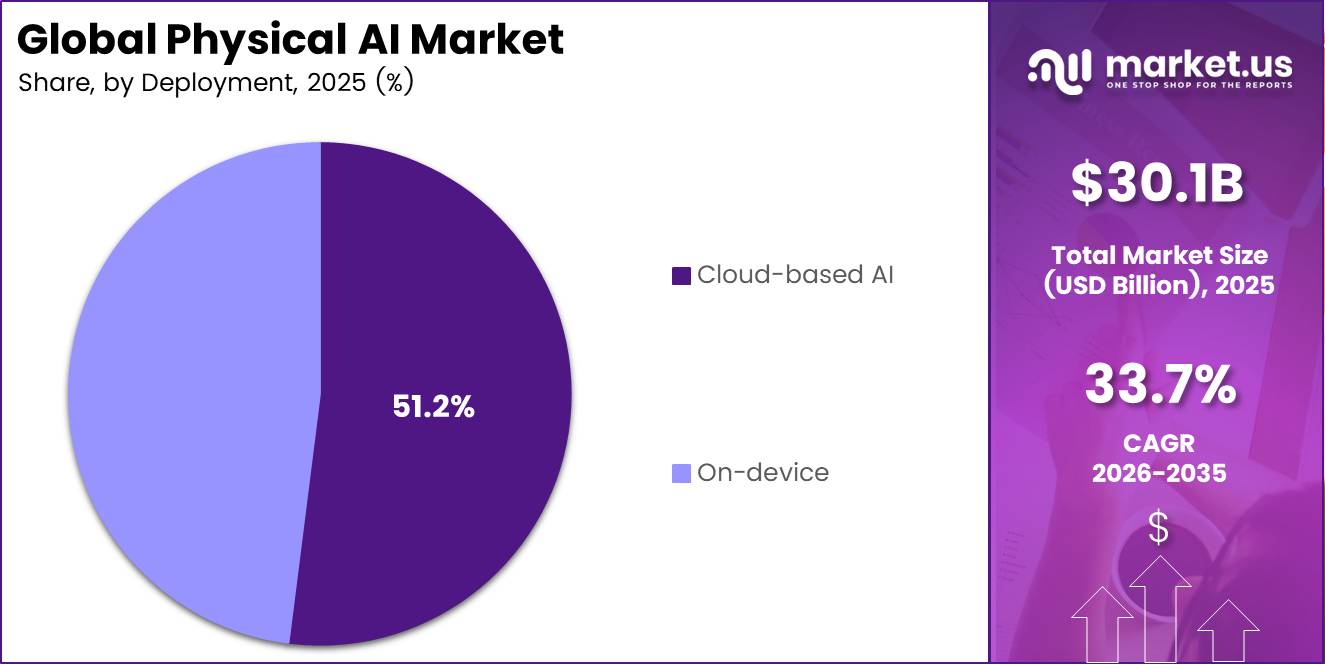
- Cloud-based AI led the deployment segment with a 51.2% share.
- Manufacturing and automotive led the application segment with a 24% share.
- North America led the market with a 48.0% share and USD 14.4 billion in revenue.
By Component
Hardware dominates with 57.0% due to essential processors, sensors, motors, and controls.
Hardware leads because each physical AI system needs processors, cameras, force sensors, motors, memory, power units, and safety controls. These parts carry high unit costs and remain essential even when developers use shared software. NVIDIA priced its Jetson T4000 module at USD 1,999 for orders of 1,000 units.
The module supplies 1,200 FP4 teraflops, 64 GB of memory, and a 70-watt power setting. Such computing power lets robots process several sensor streams and control movement in real time. Hardware also benefits from demand across industrial robots, drones, medical devices, and mobile machines.
Software will grow fastest because better models can raise the value of hardware already in use. Developers can update perception, planning, simulation, and control tools without replacing an entire robot. NVIDIA used its GR00T-Dreams software process to create training data in 36 hours, while manual collection would have required almost three months. Its open physical AI dataset also includes 24,000 humanoid motion paths.
By Technology
Computer Vision dominates with 43.0% because direct visual sensing enables safe action.
Computer vision holds the lead because a physical AI system must first understand objects, people, distances, surfaces, and movement before it can act safely. Cameras also cost less than many special sensors and can support inspection, navigation, picking, sorting, and quality control with one data stream.
NVIDIA reported that its Holoscan Sensor Bridge can cut camera latency by up to five times compared with USB cameras and reach glass-to-glass latency of 17 milliseconds. Faster image flow helps robots stop, turn, grasp, and inspect with less delay. Vision also supports training because teams can label video, create synthetic scenes, and compare robot action with expected results.
By Robot Type / Form Factor
Industrial Robots dominate with 39.0% due to proven factory scale and repeatable output.
Industrial robots lead because factories already use standard arms, controllers, safety systems, and integration practices for welding, assembly, painting, handling, and inspection. Buyers can measure output, cycle time, labor savings, and defect reduction before they expand a project.
The International Federation of Robotics valued global industrial robot installations at USD 16.7 billion in 2025. US factories installed 38,000 industrial robots that year, an 11% annual increase. This mature base gives physical AI suppliers a direct route to add vision, learning, adaptive motion, and predictive control to proven machines. Industrial robots also handle high loads and repeat tasks for long periods, which supports large hardware spending.
Service robots will grow fastest because demand now extends beyond fixed factory cells. The International Federation of Robotics found that transportation and logistics generated 52% of professional service robot installations in 2024, while annual sales in that use class rose 14%.
By Deployment
Cloud-based AI dominates with 51.2% due to central compute supporting large model training.
Cloud-based AI leads because physical AI developers need large computing clusters to train models, run simulations, store video, manage fleets, and send software updates. A central platform also lets one team compare data from many robots and improve models. Microsoft reported more than 400 data centers across 70 regions in fiscal 2025 and added over 2 gigawatts of capacity during the year.
That reach helps robot operators access training tools, digital twins, and data services without building each system alone. Cloud platforms also support large language and world models that require more memory than a mobile robot can carry. On-device AI will grow fastest because robots must often make decisions without waiting for a network response. Local processing reduces delay, limits data transfer, and keeps cameras or medical records local.
Qualcomm’s QRB5165 robotics processor delivers 15 trillion operations per second for edge inference. Its newer industrial portfolio scales from 1 TOPS at sensor level to 350 dense TOPS for complex vision and decisions. These gains allow robots to understand speech, detect hazards, plan motion, and continue working during weak connectivity. Many buyers will use a hybrid design, with cloud training and fleet learning paired with fast local control.
By Application
Manufacturing and Automotive dominate with 24.0% due to high throughput, which rewards precise automated work.
Manufacturing and automotive lead because plants run high-volume processes where small gains in speed, quality, and uptime create clear financial returns. Physical AI helps robots recognize mixed parts, adjust motion, inspect surfaces, and work around changing production needs. The International Federation of Robotics reported that US automotive plants installed 13,500 robots in 2025.
Food industry adoption climbed 30% and reached about 3,000 installations, showing that intelligent automation now serves more than vehicle lines. Manufacturers also have trained engineering teams, safety rules, and control networks that support wider deployment. Healthcare will grow fastest as hospitals seek accurate systems that can assist staff, move supplies, support rehabilitation, and improve surgery.
The World Health Organization expects a global shortage of 11 million health workers by 2030. This gap raises demand for tools that reduce routine work without removing clinical control. Intuitive reported about 3,153,000 da Vinci procedures in 2025, an 18% annual increase, and placed 1,721 surgical systems.
Key Market Segments
By Component
- Software
- Hardware
- Services
By Technology
- Computer Vision
- Speech / NLP
- Gesture / Movement Recognition
- Reinforcement Learning and Control Systems
- Others
- Multi-modal AI
- Biomimetic Robotics
By Robot Type / Form Factor
- Industrial Robots
- Service Robots
- Humanoids/Social Robots
- Cobots
- Exoskeletons/Prosthetics
- Mobile Robots/Drones
By Deployment
- Cloud-based AI
- On-device
By Application
- Manufacturing and Automotive
- Healthcare
- Agriculture
- Logistics
- Retail and Hospitality
- Security and Defense
- Transportation
- Others
Geopolitical Impact Analysis
Trade barriers directly affect physical AI hardware because robots depend on steel frames, aluminum housings, motors, batteries, cameras, controllers, and semiconductor systems that often cross several borders. The WTO reported that the United States raised steel and aluminum tariffs to 25% in 2025.
These measures increase the landed cost of robot structures, joints, cabinets, and production equipment when suppliers cannot secure local material. Tariff uncertainty also encourages manufacturers to duplicate assembly lines and carry more inventory.
This protects supply but raises working capital and unit costs. WTO data show that AI-related goods helped world merchandise trade expand 4.6% in 2025, but UNCTAD expects growth to slow to between 1.5% and 2.5% in 2026 as demand and trade conditions weaken.
UNCTAD found that Suez Canal tonnage remained 70% below its 2023 level in May 2025, while rerouting lifted global ton-miles by 6% in 2024. Sailing around the Cape of Good Hope can add 12 days to an Asia-to-Europe journey and cut effective container capacity by about 9%.
These delays affect sensors, reducers, servo motors, GPUs, and battery cells that robot manufacturers source from Asian suppliers. Commodity volatility adds pricing risk. The World Bank expects aluminum, copper, and tin prices to rise by about 20% in 2026.
Regional Analysis
North America dominates the Physical AI Market, holding a 48.0% share and generating USD 14.4 billion in revenue. The United States supports this position through advanced chip design, hyperscale computing, automation companies, venture funding, and large end-use industries.
Manufacturers use physical AI to address labor gaps, shorten production cycles, inspect complex parts, and improve worker safety. Automotive, electronics, aerospace, food processing, and pharmaceutical plants provide clear deployment opportunities. Warehouses also use intelligent mobile systems for picking, movement, sorting, and inventory control.
Asia Pacific is the fastest-growing region, with a 31% CAGR. The region combines large electronics supply chains, high manufacturing output, expanding warehouses, and national automation programs. Asia accounted for 74% of new industrial robot deployments during 2024. China installed 295,000 units, equal to 54% of global deployments. South Korea installed 30,600 units, while India reached a record 9,100 units and increased installations by 7%.
Europe holds a strong position through its automotive, machinery, industrial software, and precision engineering industries. The International Federation of Robotics recorded 85,000 European industrial robot installations in 2024, the region’s second-highest result. European Union countries accounted for 67,800 units. Germany installed 26,982 robots, while Italy installed 8,783 and Spain installed 5,100.
Key Regions and Countries
North America
- US
- Canada
Europe
- Germany
- France
- The UK
- Spain
- Italy
- Rest of Europe
Asia Pacific
- China
- Japan
- South Korea
- India
- Australia
- Rest of APAC
Latin America
- Brazil
- Mexico
- Rest of Latin America
Middle East and Africa
- GCC
- South Africa
- Rest of MEA
Market Dynamics
Drivers
| Driver | (~) % Impact on CAGR Forecast | Geographic Relevance | Impact Timeline |
|---|---|---|---|
| Edge inference chip cost decline | +3.2% | North America, Asia Pacific | Short term (2 years or less) |
| Humanoid pilot-to-production shift | +2.8% | North America, Asia Pacific | Short term (2 years or less) |
| Warehouse labor shortage automation | +2.1% | North America, Europe | Short term (2 years or less) |
| Foundation model transfer to robotics | +1.9% | Global | Medium term (2 to 4 years) |
| National industrial automation subsidies | +1.4% | Asia Pacific, Europe | Medium term (2 to 4 years) |
Edge Inference Chip Cost Decline Reshapes Robot Unit Economics
The market is benefiting from falling edge AI compute costs as semiconductor yields improve and processor technologies mature. Robotics-focused processors from NVIDIA and Qualcomm have reduced onboard computing costs by double-digit rates over roughly 18 months since 2024, lowering the overall cost of mobile robots and cobots.
Lower compute costs are also supporting a shift from hardware-only sales toward recurring software, fleet-management, and subscription-based models. Professional service robot installations continued to grow at a high single-digit annual rate through 2025, while warehouse and logistics deployments have achieved estimated payback periods of around 12 to 18 months.
Restraints
| Restraint | (~) % Impact on CAGR Forecast | Geographic Relevance | Impact Timeline |
|---|---|---|---|
| Rare earth and battery metal export controls | -2.6% | Global, China-dependent supply chains | Short term (2 years or less) |
| High interest rate CapEx freeze | -1.7% | North America, Europe | Short term (2 years or less) |
| Robotics liability and safety certification gaps | -1.3% | Europe, North America | Short term (2 years or less) |
| Semiconductor export licensing restrictions | -1.1% | Asia Pacific, North America | Short term (2 years or less) |
Rare Earth And Battery Metal Export Controls Freeze Actuator Supply
The market faces increasing supply-chain pressure from tighter export licensing on rare earth magnets and battery-grade metals. World Bank commodity data indicate that prices for cobalt, copper, and selected rare earth materials experienced double-digit quarterly fluctuations through 2025 and into 2026. These changes have increased costs for servo motors, actuators, and battery packs, while supplier lead times have extended from around 6 to 8 weeks to more than 12 weeks in some cases.
Rising material costs and longer delivery periods can delay robot production and capacity expansion. OEMs without secured long-term supply contracts may face mid-single-digit margin pressure as higher input costs are absorbed rather than fully passed to customers. Export permit delays lasting several weeks per shipment have also contributed to postponements of some capital-intensive expansion plans originally scheduled for late 2026.
Challenges
| Challenge | (~) % CAGR Friction Drag | Geographic Relevance | Mitigation Horizon |
|---|---|---|---|
| Robotics engineering talent deficit | -1.8% | North America, Europe, Asia Pacific | Medium term (2 to 4 years) |
| Sim-to-real transfer gap | -1.5% | Global | Medium term (2 to 4 years) |
| Fragmented robot interoperability standards | -1.2% | Global | Medium term (2 to 4 years) |
| Data labeling and annotation cost drag | -0.9% | Global | Short term (2 years or less) |
| Grid and power infrastructure constraints | -0.8% | North America, Asia Pacific | Long term (4 years or more) |
Robotics Engineering Talent Deficit Slows Deployment Scaling
The market faces a persistent shortage of engineers with combined expertise in robotics, control systems, and applied machine learning. OECD indicators suggest that AI and robotics-related occupations could face hundreds of thousands of unfilled positions through 2026. This shortage is extending complex warehouse automation projects from around 4 to 6 months to approximately 8 to 10 months.
Companies are responding through low-code robotics platforms, simulation-based training, and internal workforce development programs. Amazon and Siemens have highlighted increasing investment in automation capabilities, with R&D spending in some business areas exceeding 8% of segment revenue. Partnerships with universities and internal training programs are therefore becoming important long-term measures to reduce the engineering skills gap.
Opportunities
| Opportunity | (~) % Potential CAGR Upside | Geographic Relevance | Execution Window |
|---|---|---|---|
| Humanoid robotics-as-a-service leasing models | +2.4% | North America, Asia Pacific | Medium term (2 to 4 years) |
| Elder care and rehabilitation robotics white space | +1.9% | Europe, Asia Pacific | Long term (4 years or more) |
| Physical AI foundation model licensing marketplaces | +1.6% | Global | Medium term (2 to 4 years) |
| Agricultural autonomy roll-up consolidation | +1.3% | Latin America, North America | Long term (4 years or more) |
| Emerging market micro-factory deployment | +1.0% | Middle East and Africa, Latin America | Long term (4 years or more) |
Humanoid Robotics-As-A-Service Leasing Unlocks Untapped Monetization
This opportunity remains largely untapped because the market still depends on outright hardware purchases, while leasing and subscription models combining hardware, software updates, maintenance, and uptime guarantees have not yet achieved mainstream adoption. Early warehouse humanoid leasing pilots indicate customer payback periods of around 18 to 24 months.
Managed service models could also expand adoption among mid-sized logistics and manufacturing companies that cannot justify large upfront capital spending. International Federation of Robotics deployment trends indicate that professional service robot fleets under managed contracts continued to grow at double-digit annual rates through 2025.
Key Players Analysis
Tier 1 market leaders include SoftBank Robotics Group, ABB, Toyota, FANUC, Siemens, NVIDIA, Amazon, Hyundai Motor Group, and Yaskawa Electric. These companies combine global sales networks, large engineering teams, computing platforms, and factory automation portfolios.
SoftBank reported FY2025 group revenue of JPY 7,038.7 billion. It also agreed to buy ABB’s robotics business for an enterprise value of USD 5.375 billion, subject to closing conditions. The transaction connects ABB’s industrial robot base with SoftBank’s AI, communications, and computing interests.
Toyota generated JPY 43,199.8 billion from automotive operations in fiscal 2025 and spent JPY 1,326.4 billion on research and development. Siemens generated EUR 17.8 billion from Digital Industries, which supplies factory automation, drives, controls, sensors, and industrial software.
Siemens invested about 8% of revenue in research and development. NVIDIA generated USD 215.9 billion in fiscal 2026 revenue and allocated USD 18.5 billion to research and development. Its automotive business produced USD 2.3 billion, while its accelerated computing platforms support robot training, simulation, vision, and on-device inference.
Tier 2 challengers include KUKA, Boston Dynamics, Tesla, DeepMind, Agility Robotics, Mech-Mind Robotics, Hanson Robotics, Covariant, Qualcomm, Moog, Festo, AMD, Figure AI, and specialist service robot developers. Figure AI secured more than USD 1 billion in Series C commitments at a USD 39 billion post-money valuation in September 2025.
Top Key Players in the Market
- SoftBank Robotics Group
- ABB
- Toyota Motor Corporation
- FANUC
- Siemens
- KUKA AG
- Boston Dynamics
- Tesla (Optimus)
- NVIDIA Corporation
- DeepMind
- Agility Robotics
- Mech-Mind Robotics
- Hanson Robotics
- Covariant
- Qualcomm Technologies, Inc.
- Moog
- Festo
- Advanced Micro Devices, Inc.
- Amazon
- Figure AI
- Hyundai Motor Group
- Yaskawa Electric
Recent Developments
- In March 2025, Figure AI introduced its BotQ manufacturing facility with an initial capacity of up to 12,000 humanoid robots per year.
- In August 2025, Hyundai Motor Group raised its planned US investment to USD 26 billion and included a robotics facility with an annual capacity for 30,000 units.
- In January 2026, Mobileye agreed to acquire Mentee Robotics for USD 900 million, including about USD 612 million in cash and up to 26.2 million Mobileye shares.
- In June 2026, Agility Robotics agreed to a business combination with Churchill Capital Corp XI that will provide more than USD 620 million in expected gross proceeds, including a USD 200 million PIPE.
Report Scope
| Report Features | Description |
|---|---|
| Market Value (2025) | USD 30.1 billion |
| Forecast Revenue (2035) | USD 641.6 billion |
| CAGR (2026-2035) | 33.7% |
| Base Year for Estimation | 2025 |
| Historic Period | 2020-2024 |
| Forecast Period | 2026-2035 |
| Report Coverage | Revenue Forecast, Market Dynamics, Competitive Landscape, Recent Developments |
| Segments Covered | By Component (Software, Hardware, Services); By Technology (Computer Vision, Speech / NLP, Gesture / Movement Recognition, Reinforcement Learning and Control Systems, Others (multi-modal AI, biomimetic robotics)); By Robot Type / Form Factor (Industrial Robots, Service Robots, Humanoids/Social Robots, Cobots, Exoskeletons/Prosthetics, Mobile Robots/Drones); By Deployment (Cloud-based AI, On-device); By Application (Manufacturing and Automotive, Healthcare, Agriculture, Logistics, Retail and Hospitality, Security and Defense, Transportation, Others) |
| Regional Analysis | North America – US, Canada; Europe – Germany, France, The UK, Spain, Italy, Rest of Europe; Asia Pacific – China, Japan, South Korea, India, Australia, Singapore, Rest of APAC; Latin America – Brazil, Mexico, Rest of Latin America; Middle East & Africa – GCC, South Africa, Rest of MEA |
| Competitive Landscape | SoftBank Robotics Group, ABB, Toyota Motor Corporation, FANUC, Siemens, KUKA AG, Boston Dynamics, Tesla (Optimus), NVIDIA Corporation, DeepMind, Agility Robotics, Mech-Mind Robotics, Hanson Robotics, Covariant, Qualcomm Technologies, Inc., Moog, Festo, Advanced Micro Devices, Inc., Amazon, Figure AI, Hyundai Motor Group, Yaskawa Electric |
| Customization Scope | Customization for segments, region/country-level will be provided. Moreover, additional customization can be done based on the requirements. |
| Purchase Options | We have three licenses to opt for: Single User License, Multi-User License (Up to 5 Users), Corporate Use License (Unlimited Users and Printable PDF) |





























