


Report Overview
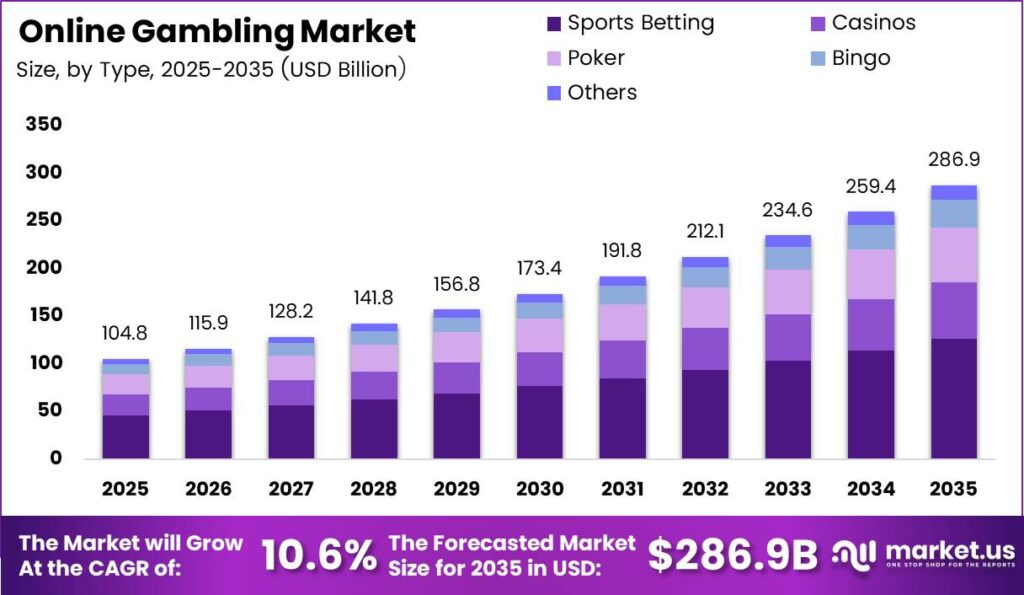
Global Online Gambling Market size is expected to be worth around USD 286.9 Billion by 2035 from USD 104.8 Billion in 2025, growing at a CAGR of 10.6% during the forecast period 2026 to 2035.
The online gambling market includes all real-money wagering activity conducted through digital platforms, spanning sports betting, casino games, poker, bingo, and related verticals. Operators deliver services through desktop browsers and mobile applications across regulated and transitional jurisdictions. The market spans consumer-facing platforms, business-to-business technology suppliers, and payment infrastructure providers.
Key Takeaways
- Online Gambling Market value in 2025 stands at USD 104.8 Billion, reaching USD 286.9 Billion by 2035.
- The market grows at a CAGR of 10.6% from 2026 to 2035.
- Sports Betting dominates the By Type segment with a 43.9% share.
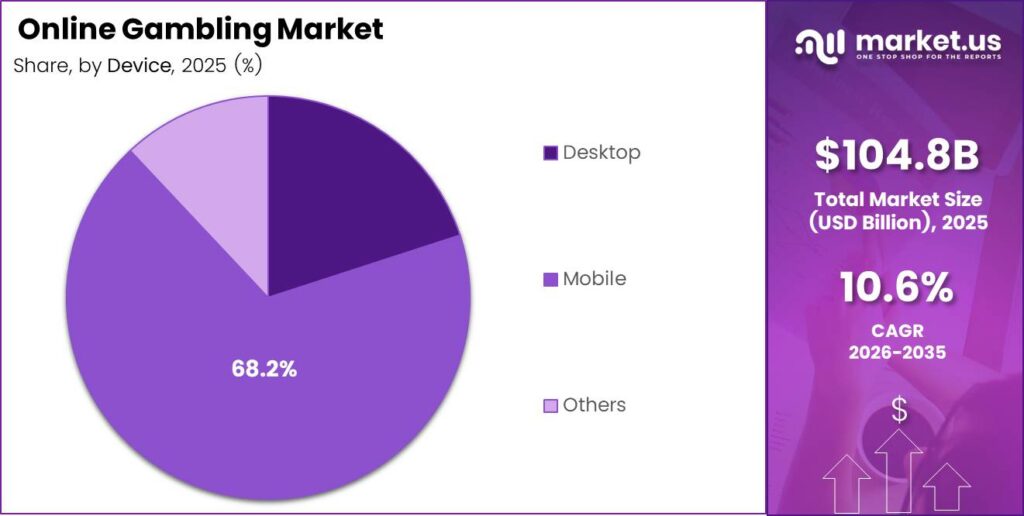
- Mobile dominates the By Device segment with a 68.2% share.
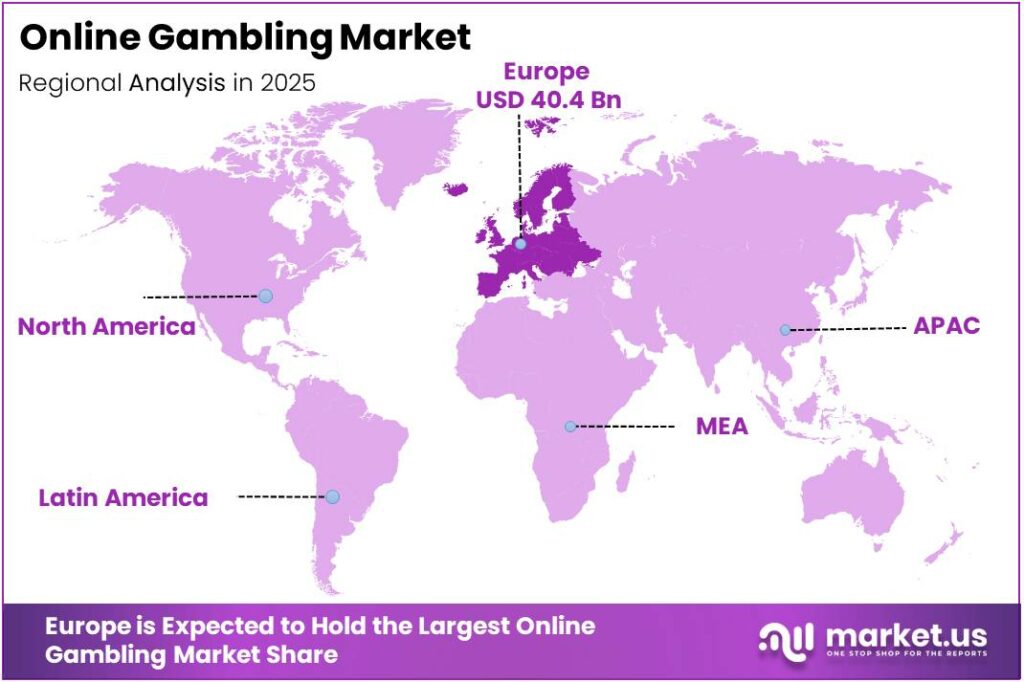
- Europe leads all regions with a 38.5% share, valued at USD 40.4 Billion.
Regulation is the primary structural force shaping this market. Brazil formalized its online betting framework on 1 January 2025, requiring SPA authorization, CPF validation, facial recognition, and a one-account-per-bettor rule. This regulatory shift redirected advertising spend, payment volumes, and customer traffic from unlicensed operators into compliant channels, making Latin America the clearest near-term source of incremental sector growth.
According to the Gambling Commission, the online gambling participation rate in Great Britain reached 38% in 2024. This level of consumer adoption confirms that digital channels have become the primary wagering interface for a substantial share of the adult population. Operators can use this penetration baseline to model retention spend and lifetime value with greater confidence than in earlier market phases.
Gambling Commission data also shows that 9% of GB adults participated in betting activities in the previous four weeks. This figure signals active and recurring engagement rather than passive account ownership. Platforms that convert casual participants into regular users through product breadth and loyalty mechanics hold a measurable retention advantage over single-vertical operators.
Type Analysis
Sports Betting dominates with 43.9% due to broad regulated market availability and live wagering depth.
In 2025, Sports Betting held a dominant market position in the By Type segment of the Online Gambling Market, with a 43.9% share. U.S. commercial gaming revenue reached a record USD 71.92 Billion in 2024, marking the fourth consecutive year of record revenue growth. Sports betting drives a disproportionate share of that performance, signaling that regulated sportsbook expansion directly lifts total market revenue for operators holding multi-state licenses.
Casinos represent the second major vertical within the type segment. Online casino revenue in the seven U.S. states with full-scale legal iGaming reached USD 8.41 Billion in 2024, a 28.7% year-over-year increase. This expansion rate exceeds the overall commercial gaming growth rate, which signals that casino products within regulated digital environments are gaining structural share from retail casino formats.
Poker, Bingo, and Others form the remaining sub-segments within the type breakdown. Digital gaming channels accounted for approximately 30% of total U.S. commercial gaming revenue in 2024, compared with 25% in 2023 and 13% in 2021. This channel shift confirms that players are migrating from physical to digital formats at scale, which broadens the addressable audience for all online verticals including lower-volume games like poker and bingo.
Device Analysis
Mobile dominates with 68.2% due to app-based access enabling continuous in-play wagering.
In 2025, Mobile held a dominant market position in the By Device segment of the Online Gambling Market, with a 68.2% share. Mobile-first engagement is the primary product surface for sports betting, where in-play markets require real-time interaction. Operators that invest in native app performance and push notification strategies capture a structurally higher share of session frequency and average bet volume compared with desktop-first competitors.
Desktop retains a meaningful share of total wagering volume, particularly in casino and poker verticals where session length and screen size influence player behavior. Desktop users tend to generate higher average transaction values per session. Operators maintaining strong desktop experiences can protect revenue per user even as mobile account for the majority of overall session counts.
Others within the device segment, including smart TVs, connected gaming devices, and emerging interface formats, represent a smaller but developing share. Platform convergence between live streaming and wagering functionality is accelerating in this space. Operators that embed betting mechanics into broadcast and streaming surfaces can reach audiences that do not actively open dedicated gambling applications.
Key Market Segments
By Type
- Sports Betting
- Casinos
- Poker
- Bingo
- Others
By Device
- Desktop
- Mobile
- Others
Market Dynamics
Technology and Innovation Landscape - AI personalization, blockchain transparency, and gamification mechanics are redefining platform competitiveness
AI-powered personalized betting recommendations represent one of the highest-impact technology applications in this market. Operators deploying dynamic user engagement tools can tailor odds presentation, bet type suggestions, and session pacing to individual player profiles. This capability directly influences average revenue per user and session length, creating measurable performance differences between AI-enabled platforms and those relying on static product layouts.
Generative AI chat interfaces for betting insights and customer support are shifting the service model from reactive support to proactive engagement. Platforms using AI-driven chat can reduce support resolution time, surface relevant markets to users during live events, and maintain engagement between major sporting fixtures. This creates a lower-cost service layer that improves user experience without proportional headcount growth.
Blockchain-based provably fair gaming systems address a specific segment of transparency-focused players who require verifiable randomness in casino outcomes. This technology creates an auditable record of game results that neither the operator nor the player can manipulate. Operators deploying blockchain gaming mechanics can access a player segment that currently avoids traditional online casinos due to trust concerns.
Gamification through missions, loyalty tiers, and achievement-based rewards deepens behavioral engagement without requiring additional product inventory. Same-game parlay adoption across major sportsbooks demonstrates that structural bet mechanics, when well-designed, shift player behavior at scale. Operators combining gamification with personalized AI triggers can increase session frequency and reduce churn among mid-tier depositors who are the most economically volatile player cohort.
Market Opportunity Analysis - Underserved verticals and emerging regulated markets offer entry points for capital-ready operators
Latin America carries the highest near-term opportunity concentration in the global online gambling market. Regulated LatAm localization carries an estimated +2.4% potential CAGR upside, with Brazil as the core market and wider LatAm as the spill-over zone. Operators that have already secured Brazilian licenses are positioned to extend those compliance frameworks into neighboring markets as national regulatory pipelines mature.
Cross-sell from sports betting into iGaming carries an estimated +2.1% potential CAGR upside, concentrated in North America, Brazil, and the EU. Sports betting customers who already hold verified accounts represent a lower-cost acquisition base for casino and poker verticals. Operators with unified platform architecture can activate this cross-sell without rebuilding KYC infrastructure for each product line.
The micro-betting media stack represents a medium-term structural opportunity in the US, UK, and Australia, carrying an estimated +1.8% CAGR upside. This vertical links live streaming features with real-time betting functionality, targeting engaged sports viewers who bet on individual plays and in-game events. Operators that build proprietary media integration will command higher session frequency than those relying on standard pre-match wagering only.
M&A roll-up in mid-tier European, LatAm, and selective APAC markets carries the highest long-term CAGR upside at an estimated +2.7%. Fragmented mid-tier markets contain licensed operators with local customer bases but insufficient technology scale. Acquirers that consolidate these assets can layer proprietary platform capabilities onto established regulatory footprints without absorbing the time cost of greenfield license applications.
Drivers
Brazil’s federal online betting framework, active from 1 January 2025, is the most consequential near-term demand accelerator in the global market. Only SPA-authorized operators may legally serve Brazilian bettors, with illegal operators subject to site blocking. This regulatory structure redirects ad spend, payment volumes, and bettor traffic into licensed channels, lowering gray-market leakage and improving conversion economics for compliant brands.
Hard onboarding controls, including CPF validation, facial recognition, minimum age verification, and a one-account-per-CPF rule, raise initial compliance cost but improve fraud screening and reduce bonus abuse. As reported by source data, this Brazil-led legalization and channel migration carries an estimated +2.2% impact on CAGR forecast for the Latin America core region. Operators that secured Brazilian licenses before 2025 hold a structural head start that late entrants cannot close quickly.
| Driver | (~) % Impact on CAGR Forecast | Geographic Relevance | Impact Timeline |
|---|---|---|---|
| Brazil-led legalization and channel migration | +2.2% | Latin America core, South America spill-over | Short term (≤ 2 years) |
| US iGaming and sportsbook scaling | +1.9% | North America core | Short term (≤ 2 years) |
| Mobile-first wagering and app engagement | +1.6% | EU core, UK, North America, APAC corridors | Medium term (2-4 years) |
| Online casino mix expansion vs retail gaming | +1.4% | Europe core, North America core | Medium term (2-4 years) |
| KYC, AML and safer-payments infrastructure | +1.1% | Brazil, UK, EU, North America regulated states | Short term (≤ 2 years) |
| Tax capture and formal regulatory enforcement | +0.9% | Brazil, US states, selected EU markets | Long term (≥ 4 years) |
Restraints
Anti-money-laundering requirements are moving earlier into the customer lifecycle and applying more continuously across regulated markets. UK-focused compliance expectations now require early-stage intervention, continuous risk assessment, mandatory sanctions screening, and specific due diligence on open-loop payment instruments and crypto deposits. U.S. practice adds reporting thresholds including suspicious activity reports around USD 5,000 and cash transaction reports above USD 10,000 per 24-hour window.
These requirements produce higher verification fallout, more false positives, slower withdrawals, and larger compliance headcount and regtech spend. Data from the source block shows AML and KYC cost inflation carries an estimated -1.3% deduction to CAGR over a medium-term horizon. Operators absorbing recurring compliance operating expenses lose capital that would otherwise fund product development and market expansion, compressing scalable growth capacity.
| Restraint | (~) % Impact on CAGR Forecast | Geographic Relevance | Impact Timeline |
|---|---|---|---|
| Tax load escalation | -1.9% | UK core, EU spillover | Short term (≤ 2 years) |
| Regulatory tightening | -1.6% | UK, EU, India, selected APAC | Short term (≤ 2 years) |
| AML/KYC cost inflation | -1.3% | UK, EU, North America core | Medium term (2-4 years) |
| Payment friction | -1.1% | EU, North America, LATAM corridors | Short term (≤ 2 years) |
| Advertising curbs | -1.0% | EU core, UK, Nordics | Medium term (2-4 years) |
| Enforcement-led de-risking | -0.9% | UK core, regulated Europe | Short term (≤ 2 years) |
Challenges
Jurisdiction-specific KYC, AML, affordability, safer gambling, reporting, and audit requirements must be maintained simultaneously across multiple license environments. The UK regulator collected the Economic Crime Levy from 88 firms and recorded £879,000 in 2024 to 2025 penalties, signaling persistent supervisory intensity rather than a one-off enforcement cycle. This turns compliance from a fixed legal function into a rolling cost engine that absorbs margin and slows rollout velocity.
A mid-to-large operator spanning 10 to 20 regulated jurisdictions can carry 12% to 18% annual growth in compliance headcount and onboarding drop-off leakage of roughly 8% to 15% when enhanced due diligence triggers stack. This drag does not reflect lost demand. Instead, it reflects slower conversion, higher per-player acquisition recovery periods, and an estimated 40 to 90 basis points of EBITDA pressure. Compliance cost escalation reduces the market’s scalable CAGR ceiling by approximately 1.3 percentage points.
| Challenge | (~) % CAGR Friction Drag | Geographic Relevance | Mitigation Horizon |
|---|---|---|---|
| Compliance Cost Escalation | -1.3% | EU regulatory hubs, UK core, North America licensed states, India transition markets | Medium term (2-4 years) |
| Payment Rails Volatility | -1.1% | EU payments layer, LATAM wallets, APAC cross-border corridors, offshore-to-regulated shifts | Medium term (2-4 years) |
| Fraud And Cyber Pressure | -1.4% | North America core, EU regulated markets, APAC mobile-first markets | Short term (≤ 2 years) |
| Market Fragmentation Overhead | -1.0% | US state markets, EU multi-license zones, India policy transition, LATAM licensing markets | Long term (≥ 4 years) |
| Specialist Talent Bottlenecks | -0.8% | UK, Malta, Gibraltar, Nordics, India tech hubs, North America | Medium term (2-4 years) |
| Data Architecture Strain | -0.9% | Global tier-1 operators, omnichannel sportsbooks, casino-platform aggregators | Medium term (2-4 years) |
Opportunities
Operators that redesign cashier systems around account-to-account payment rails under SEPA Instant can trim payment costs by 50 to 150 basis points of net gaming revenue. Settlement within 10 seconds and equal pricing rules under the SEPA Instant framework are becoming mandatory infrastructure across Europe. This creates a cost reduction opportunity that operators treating payments as a utility function have not yet productized.
Figures from the source data show that faster withdrawals can be structured into VIP subscriptions, loyalty multipliers, or embedded affordability layers. This payments-led wallet model carries an estimated +1.6% potential CAGR upside, concentrated in the EU, UK, and Nordics. Operators that move first on owned payment orchestration can lift 12-month retention by roughly 3 to 5 percentage points through improved first-withdrawal satisfaction.
| Opportunity | (~) % Potential CAGR Upside | Geographic Relevance | Execution Window |
|---|---|---|---|
| Regulated LatAm localization | +2.4% | Brazil core, wider LatAm | Short term |
| Payments-led wallet model | +1.6% | EU, UK, Nordics | Short term |
| B2B compliance monetization | +1.3% | LatAm, EU, APAC regulated | Medium term |
| Cross-sell into iGaming | +2.1% | North America core, Brazil, EU | Medium term |
| Micro-betting media stack | +1.8% | US, UK, Australia | Medium term |
| M&A roll-up in mid-tier markets | +2.7% | Europe, LatAm, selective APAC | Long term |
Regional Analysis
Europe Dominates the Online Gambling Market with a Market Share of 38.5%, Valued at USD 40.4 Billion
Europe holds the largest regional position in the online gambling market, driven by mature regulatory infrastructure across the UK, Germany, the Nordics, and Spain. The United Kingdom introduced online slot stake limits of £5 per spin for adults over 25 and £2 per spin for adults aged 18 to 24. These restrictions reduce average revenue per user in the short term but formalize the operating environment, rewarding compliant operators with durable license security.
North America is the fastest-formalizing region in the global market. U.S. sports betting revenue reached a record USD 13.71 Billion in 2024, a 25.4% increase compared with 2023. State-by-state legalization continues to add addressable population, and operators with early-mover licenses in high-population states hold compounding retention advantages as new entrants face saturated acquisition markets.
Asia-Pacific represents a structurally complex region, with regulated markets in Australia, Japan, and parts of Southeast Asia operating alongside large unregulated corridors. Mobile-first wagering behavior is deeply embedded across APAC consumer segments. Operators that establish compliant footholds in regulated APAC jurisdictions early will benefit as policy frameworks formalize across the region.
Latin America is the most active near-term expansion frontier. Brazil’s federal licensing regime, launched 1 January 2025, redirected bettors from unauthorized platforms into licensed channels. Regulated LatAm localization carries an estimated +2.4% potential CAGR upside, making this the single highest-impact geographic entry point for operators prioritizing near-term revenue growth.
Middle East and Africa presents selective opportunity within tightly defined regulatory boundaries. GCC markets maintain restrictions on most gambling formats, while South Africa operates a licensed land-based and online framework. Operators pursuing MEA must weigh jurisdictional access constraints against the high mobile penetration rates that make digital delivery commercially efficient in markets where licenses are available.
Key Regions and Countries
North America
- US
- Canada
Europe
- Germany
- France
- The UK
- Spain
- Italy
- Rest of Europe
Asia Pacific
- China
- Japan
- South Korea
- India
- Australia
- Rest of APAC
Latin America
- Brazil
- Mexico
- Rest of Latin America
Middle East and Africa
- GCC
- South Africa
- Rest of MEA
Key Company Insights
Bally’s Corporation operates across both physical and digital gambling verticals, giving it a cross-channel revenue base that most pure-play online operators cannot replicate. Legal U.S. sportsbooks accepted nearly USD 150 Billion in wagers during 2024, a 22.2% increase year-over-year. Bally’s integrated retail and digital footprint positions it to capture omnichannel bettors as state-by-state legalization expands the addressable U.S. market.
Bet365 Group Ltd. operates one of the largest proprietary digital sportsbook and casino platforms globally, with strong penetration in the UK and regulated European markets. Its technology-owned model reduces dependency on third-party platform costs, improving margin durability as compliance expenses rise across the sector. However, its concentration in mature European markets exposes revenue to regulatory tightening, including the UK’s new online slot stake limits.
Key Players
- Bally’s Corporation
- Bet 365 Group Ltd.
- Betsson AB
- Entain Plc.
- FireKeepers
- Flutter Entertainment Plc.
- Churchill Downs Inc.
- Kindred Group
- Ladbrokes Coral Group Plc
- Sky Betting & Gambling
- Sportech Plc
- The Stars Group Plc.
Recent Developments
- July 2025 – Intralot announced the acquisition of Bally’s International Interactive Business in a cash-and-shares transaction valued at approximately €2.7 Billion, creating a larger combined global digital gaming and online gambling technology company.
- February 2026 – Flutter Entertainment reported reaching nearly 40 Million customers across its global portfolio during 2025, supported by ongoing product innovation and expansion across sports betting and iGaming platforms.
Report Scope
| Report Features | Description |
|---|---|
| Market Value (2025) | USD 104.8 Billion |
| Forecast Revenue (2035) | USD 286.9 Billion |
| CAGR (2026-2035) | 10.6% |
| Base Year for Estimation | 2025 |
| Historic Period | 2020-2024 |
| Forecast Period | 2026-2035 |
| Report Coverage | Revenue Forecast, Market Dynamics, Market Opportunity Analysis, Technology and Innovation Landscape, Competitive Landscape, Recent Developments |
| Segments Covered | By Type (Sports Betting, Casinos, Poker, Bingo, Others), By Device (Desktop, Mobile, Others) |
| Regional Analysis | North America (US and Canada), Europe (Germany, France, The UK, Spain, Italy, and Rest of Europe), Asia Pacific (China, Japan, South Korea, India, Australia, and Rest of APAC), Latin America (Brazil, Mexico, and Rest of Latin America), Middle East and Africa (GCC, South Africa, and Rest of MEA) |
| Competitive Landscape | Bally’s Corporation, Bet 365 Group Ltd., Betsson AB, Entain Plc., FireKeepers, Flutter Entertainment Plc., Churchill Downs Inc., Kindred Group, Ladbrokes Coral Group Plc, Sky Betting & Gambling, Sportech Plc, The Stars Group Plc. |
| Customization Scope | Customization for segments, region/country-level will be provided. Additional customization can be done based on requirements. |
| Purchase Options | We have three licenses to opt for: Single User License, Multi-User License (Up to 5 Users), Corporate Use License (Unlimited User and Printable PDF) |





































