


Report Overview
Global Online Beauty and Personal Care Product Market size is expected to be worth around USD 265.6 Billion by 2035 from USD 76.2 Billion in 2025, growing at a CAGR of 13.3% during the forecast period 2026 to 2035. This pace places the category among the faster growing segments of global retail. Brands that scale digital operations early can capture share before competition intensifies further.
This market covers beauty and personal care products sold through online retail channels, including skincare, makeup, hair care, and grooming items. Sellers range from brand owned digital storefronts to third party marketplaces and beauty focused retail websites. The structure spans multiple product natures, types, and gender based categories, each carrying distinct buyer behavior and purchase frequency patterns.
Key Takeaways
- Global Online Beauty and Personal Care Product Market size is valued at USD 76.2 Billion in 2025 and is projected to reach USD 266.8 Billion by 2035.
- The market is expected to grow at a CAGR of 13.3% between 2026 and 2035.
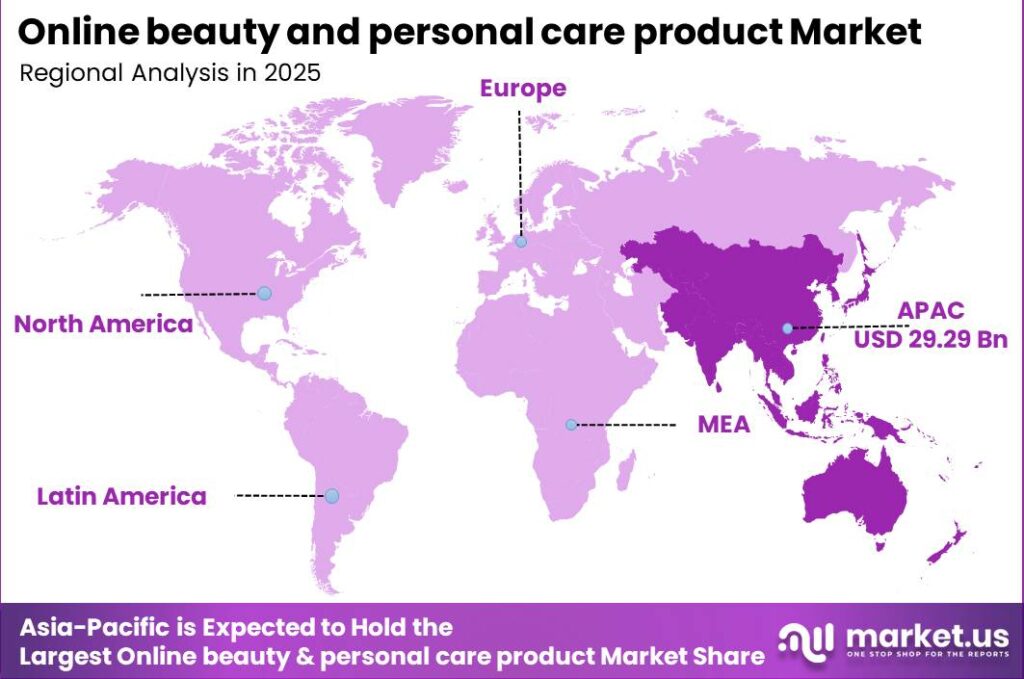
- Asia-Pacific dominates the market with a 38.4% share, valued at USD 29.29 Billion in 2025.
- Conventional products lead the By Nature segment with a 75.2% share.
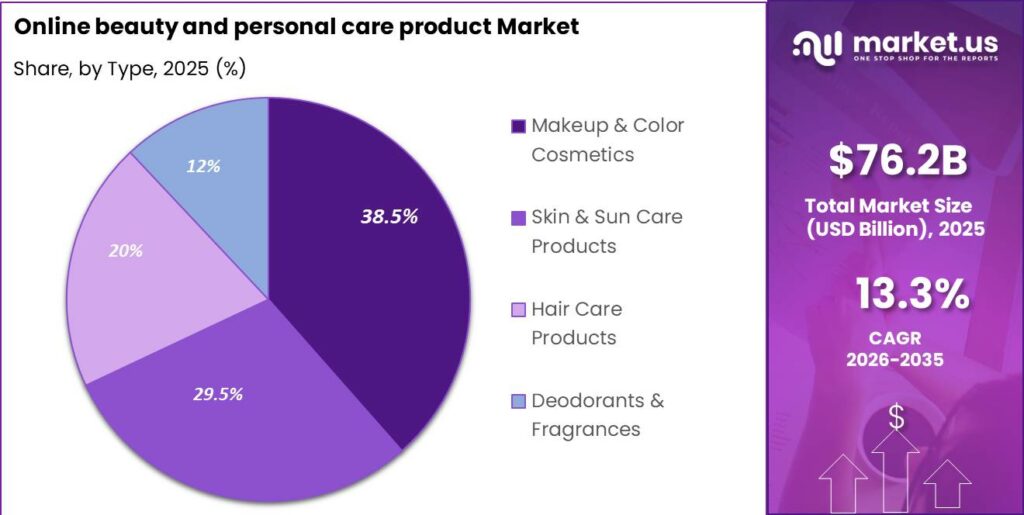
- Makeup and Color Cosmetics dominate the By Type segment with a 38.5% share.
- Women hold the dominant position in the By Gender segment with a 64.7% share.
This reflects a market where regional concentration and category dominance are already well established. Therefore, brands competing outside the leading segments must differentiate on service, formulation, or channel strategy rather than scale alone. 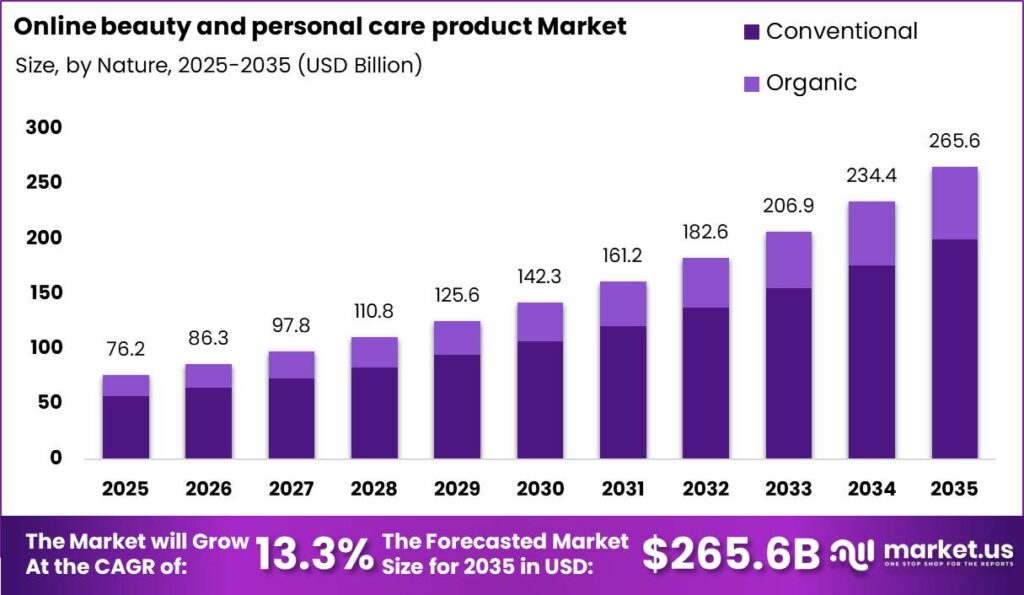
Consumer research underscores how deeply search and discovery shape purchase behavior in this category. According to PowerReviews, 83% of consumers purchased skincare products after conducting an online search before buying. This signals that organic search visibility and content driven discovery now function as primary acquisition channels rather than supporting tools.
Spending intensity is also rising among repeat digital shoppers, pointing to deepening category loyalty online. Data from PowerReviews shows 37% of consumers now spend more than USD 101 per month on online beauty purchases, up from 24% the previous year. As a result, brands with strong repeat purchase mechanics, such as subscriptions, stand to capture a growing share of wallet.
Sustainability commitments from major players continue to reshape product formats sold through digital channels. In June 2025, L’Oréal launched its global #JoinTheRefillMovement campaign to expand refillable beauty product adoption across multiple brands. This signals that packaging strategy is becoming a competitive differentiator within online assortments, not just a compliance response.
Nature Analysis
Conventional dominates with 75.2% due to wider price accessibility and shelf availability.
In 2025, Conventional held a dominant market position in the By Nature segment of Online Beauty and Personal Care Product Market, with a 75.2% share. Conventional formulations remain the default choice for mass market buyers seeking familiar brands at lower price points. This keeps Conventional products central to high volume online replenishment purchases across most regions.
Organic products serve a smaller but more engaged buyer base that prioritizes ingredient sourcing over price. These shoppers typically research formulations before purchase and respond to transparency focused marketing. Consequently, Organic listings perform best when paired with detailed ingredient disclosure and third party certification on product pages.
Type Analysis
Makeup and Color Cosmetics lead with 38.5% share driven by frequent repurchase cycles.
In 2025, Makeup and Color Cosmetics held a dominant market position in the By Type segment of Online Beauty and Personal Care Product Market, with a 38.5% share. This category benefits from frequent color and trend driven repurchasing compared to longer replacement cycles in other product types. Therefore, online retailers prioritize this category for live shopping and video led discovery formats.
Skin and Sun Care Products serve buyers focused on routine consistency and long term skin outcomes rather than trend cycles. These purchases tend to repeat on a predictable monthly schedule once a routine is established. This predictability makes the segment well suited to subscription based replenishment models.
Hair Care Products attract buyers replacing household staples on a recurring basis through online channels. Purchase decisions here lean heavily on prior brand experience rather than discovery driven browsing. Data from PowerReviews shows 35% of consumers said between 26% and 50% of their online beauty purchases were products they had never used before. This signals meaningful room for trial driven acquisition even within habitually purchased categories.
Vacation expanded its distribution through Sephora’s online platform in June 2026 after scaling across multiple retail channels. This move reflects how digitally native brands increasingly use established retail partners to extend reach within the Type segment. Smaller brands without comparable retail partnerships face a growing visibility gap as a result.
Gender Analysis
Women lead the segment with 64.7% share through broader category participation.
In 2025, Women held a dominant market position in the By Gender segment of Online Beauty and Personal Care Product Market, with a 64.7% share. Women purchase across a wider span of subcategories, from skin care to color cosmetics, compared to other gender segments. This breadth makes women the primary audience for cross category bundling and loyalty programs online.
Men represent a narrower but structurally distinct segment spanning shaving, oral care, personal cleanliness, and skin care needs. Purchases in this group tend to favor functional positioning over discovery driven browsing. As a result, brands targeting men benefit more from straightforward product claims than from trend led marketing.
Unisex products serve buyers seeking formulations not marketed around gender specific positioning. This approach appeals to shoppers prioritizing ingredients and function over branding conventions. However, the segment remains smaller in scale, limiting its near term contribution to overall category volume.
Key Market Segments
By Nature
- Organic
- Conventional
By Type
- Makeup & Color Cosmetics
- Skin & Sun Care Products
- Hair Care Products
- Deodorants & Fragrances
By Gender
- Women
- Men
- Shaving
- Oral Care
- Personal Cleanliness
- Skin Care
- Others
- Unisex
Drivers
Regulatory pressure and shifting consumer expectations are pushing the industry toward cleaner formulations and sustainable packaging at the same time. Between 2025 and 2026, the EU introduced compliance deadlines covering restricted ingredients, allergen labeling, nanomaterials, PFAS limits, and packaging recyclability. The US MoCRA framework expanded oversight further, reporting more than 15,000 active facility registrations and over 1.1 million product listings by March 2026.
Consumer sentiment reinforces this regulatory direction rather than resisting it. 63% of beauty consumers prioritize clean ingredients, 81% expect brands to cut plastic packaging, and 70% review sustainability credentials before buying. This combination of compliance and consumer pressure favors digitally native brands able to update formulations and disclosures faster than traditional competitors.
| Driver | (~) % Impact on CAGR Forecast | Geographic Relevance | Impact Timeline |
|---|---|---|---|
| Social Commerce & Influencer-Led Discovery Accelerating Channel Conversion | +2.8% | APAC core (China, India, SEA); North America secondary; EU spillover | Short term (≤ 2 years) |
| AI-Powered Personalization & AR Virtual Try-On Driving Conversion Uplift | +2.3% | North America & EU primary; APAC rapid-adoption corridor | Medium term (2–4 years) |
| Clean Beauty, Sustainable Formulation & Regulatory Compliance Mandates | +1.8% | EU regulatory core; North America adoption hub; APAC fast-follower | Medium term (2–4 years) |
| Male Grooming Digital Adoption Expanding the Online TAM | +1.4% | North America & EU established; APAC (India, China) growth frontier | Medium term (2–4 years) |
| D2C Brand Proliferation & Subscription Commerce Compressing the Purchase Funnel | +1.6% | Global; India and SE Asia fastest D2C CAGR; NA & EU mature base | Short to Medium term (1–4 years) |
| Quick Commerce & Same-Day Delivery Infrastructure Redefining Replenishment | +1.2% | India primary; China secondary; EU and NA metro-urban corridors | Short term (≤ 2 years) |
Restraints
EU regulatory reform is raising compliance costs sharply for brands managing large, fast changing product portfolios. New restrictions cover Vitamin A derivatives, alpha-arbutin, kojic acid, triclosan, and PFAS compounds, alongside an updated ingredient glossary listing more than 30,000 entries. These changes force reformulation, relabeling, and re-notification within compressed timelines.
For a mid-sized brand running more than 200 active SKUs, compliance costs can reach between EUR 8,000 and EUR 25,000 per affected product. This means portfolio-wide updates can push total compliance spending into seven figures. As a result, product launch speed and innovation capacity both slow under this financial burden.
| Restraint | (~) % Impact on CAGR Forecast | Geographic Relevance | Impact Timeline |
|---|---|---|---|
| Proliferation of Counterfeit & Substandard Products on Third-Party Marketplaces | -2.1% | Global — highest intensity in APAC cross-border corridors, South & Southeast Asia | Short term (≤ 2 years) |
| De Minimis Exemption Elimination & Cross-Border Tariff Escalation | -1.8% | North America (primary); APAC export lanes; EU import corridors | Short term (≤ 2 years) |
| Compounding Regulatory Ingredient Bans & EU Cosmetics Compliance Costs | -1.4% | EU core; secondarily UK, APAC regulatory-adopter markets (Japan, South Korea) | Medium term (2–4 years) |
| Last-Mile Logistics Cost Escalation & Fulfillment Margin Compression | -1.5% | North America, Western Europe, Tier-1 APAC urban markets | Medium term (2–4 years) |
| Escalating Customer Acquisition Costs (CAC) & Digital Marketing Saturation | -1.2% | North America, Western Europe (Meta/Google-dependent DTC brands) | Short-to-medium term (1–3 years) |
| Greenwashing Enforcement & Clean-Beauty Claims Substantiation Burden | -0.9% | EU (primary), UK, North America | Medium-to-long term (2–5 years) |
Challenges
Online beauty brands face an increasingly fragmented set of rules across regions, covering ingredients, labeling, safety, and reporting. In the US, MoCRA requires biennial facility re-registration, adverse event reporting within 15 business days, and ingredient-level listings starting January 2026. In Europe, PFAS limits and AI governance rules add further obligations, while APAC markets layer on halal and documentation standards.
For a mid-sized brand operating in five or more regions, meeting these obligations can require 8 to 12 regulatory affairs staff and more than $500,000 annually in third-party testing. Reformulation cycles can extend launch timelines by 4 to 9 months. This directly reduces the speed-to-market advantage online-first brands depend on for growth.
| Challenge | (~) % CAGR Friction Drag | Geographic Relevance | Mitigation Horizon |
|---|---|---|---|
| Counterfeit & Gray-Market Product Proliferation | -1.2% | APAC, Middle East, SEA e-commerce corridors; secondary exposure in EU & North America marketplaces | Medium term (2–4 years) |
| Multi-Jurisdictional Regulatory Compliance Fragmentation | -1.0% | North America (MoCRA/FDA), EU (Green Claims, PFAS bans), APAC (China NMPA, Indonesia halal) | Long term (≥ 4 years) |
| Raw Material & Ingredient Supply Chain Volatility | -0.9% | Global; acute in petrochemical-linked APAC manufacturing hubs and EU clean-beauty sourcing corridors | Medium term (2–4 years) |
| Last-Mile Logistics Cost & Delivery Experience Friction | -0.8% | APAC emerging markets, South Asia (India, SEA), Latin America; secondary pressure in EU rural zones | Medium term (2–4 years) |
| Digital Marketing Saturation & Rising Customer Acquisition Costs | -0.7% | North America (DTC-heavy), Western Europe; amplified in hyper-competitive APAC social commerce arenas | Short term (≤ 2 years) |
| Data Privacy Compliance & AI Personalization Risk | -0.5% | EU (GDPR, AI Act), North America (CCPA/CPRA), APAC (APPI, PDPA variants), global DTC operators | Long term (≥ 4 years) |
Opportunities
Premium beauty demand is accelerating across India, Southeast Asia, the Middle East, and Africa, supported by rising incomes and digital commerce adoption. India’s luxury beauty segment is expected to grow fivefold between 2023 and 2035. Sub-Saharan Africa remains dominated by mass market products, leaving significant room for premiumization to take hold.
This creates an opening to build or acquire digitally native brands suited to local preferences, including halal certified and Ayurveda inspired formulations. India alone recorded 393 consumer products and retail M&A deals in 2025. Early movers can acquire growth brands at attractive valuations and serve a combined consumer base exceeding 1 billion people.
| Opportunity | (~) % Potential CAGR Upside | Geographic Relevance | Execution Window |
|---|---|---|---|
| AI-Powered Hyper-Personalization & Virtual Try-On Commerce | +2.8% | North America core; EU; APAC (South Korea, Japan, India) | Short term (≤ 2 years) |
| Social & Live Commerce Channel Monetization | +2.2% | North America; Southeast Asia; MENA | Short term (≤ 2 years) |
| Subscription-as-a-Service & DTC Recurring Revenue Models | +1.8% | North America; UK; APAC emerging | Medium term (2–4 years) |
| Beauty-Wellness Convergence: Ingestible & Nutricosmetic Verticals | +1.5% | North America; APAC (China, Japan, India); EU | Medium term (2–4 years) |
| Male Grooming Digital Expansion & Underpenetrated TAM Capture | +1.2% | India; Southeast Asia; MENA; North America | Medium term (2–4 years) |
| Emerging Market Premiumization & Luxury Digital Roll-Up M&A | +1.4% | India; Middle East; Southeast Asia; Sub-Saharan Africa | Long term (≥ 4 years) |
Regional Analysis
Asia-Pacific Dominates the Online Beauty and Personal Care Product Market with a Market Share of 38.4%, Valued at USD 29.29 Billion
Asia-Pacific leads the global market through a combination of high mobile commerce penetration and dense social commerce activity across major economies. Consumers across the region frequently discover products through livestream shopping and short form video before purchasing. This behavior pattern gives regional platforms an outsized role in shaping brand visibility and conversion online.
Regional level percentage and value data for North America, Europe, Latin America, and Middle East and Africa is not included in the provided data block. DATA INSUFFICIENT for these four regions, so detailed share figures and structural drivers are not presented here.
Key Regions and Countries
North America
- US
- Canada
Europe
- Germany
- France
- The UK
- Spain
- Italy
- Rest of Europe
Asia Pacific
- China
- Japan
- South Korea
- India
- Australia
- Rest of APAC
Latin America
- Brazil
- Mexico
- Rest of Latin America
Middle East and Africa
- GCC
- South Africa
- Rest of MEA
Key Company Insights
Amorepacific Corp. URL UNVERIFIED competes in a market where discovery channel matters as much as product quality. As reported by PowerReviews, 57% of consumers begin their online beauty shopping journey on beauty retailer websites, while only 17% start on Amazon. This means Amorepacific’s positioning across owned and retailer channels carries more weight than marketplace presence alone for capturing early stage shoppers.
Church and Dwight Co. Inc. operates within a category where trust signals heavily influence conversion. Figures from PowerReviews show 99.5% of beauty shoppers read reviews at least sometimes when shopping online. This creates both an advantage and a risk, since strong review management can build trust quickly, while weak coverage can stall conversion even for established household names.
Key Players
- Amorepacific Corp.
- Church and Dwight Co. Inc.
- CLARINS France
- Coty Inc.
- Henkel AG and Co. KGaA
- Johnson and Johnson Services Inc.
- Kao Corp.
- Koninklijke Philips N.V.
- LOreal SA
- MacAndrews and Forbes Inc.
- Natura and Co Holding SA
Recent Developments
- May 2025 – e.l.f. Beauty announced a definitive agreement to acquire rhode in a deal valued at up to $1 billion, significantly expanding its skincare and direct-to-consumer beauty portfolio.
- January 2026 – rhode teased multiple upcoming product launches for 2026, including hydrogel pimple patches, new peptide lip treatment variants, and complexion products, following its rapid growth and acquisition by e.l.f. Beauty.
Report Scope
| Report Features | Description |
|---|---|
| Market Value (2025) | USD 76.2 Billion |
| Forecast Revenue (2035) | USD 266.8 Billion |
| CAGR (2026-2035) | 13.3% |
| Base Year for Estimation | 2025 |
| Historic Period | 2020-2024 |
| Forecast Period | 2026-2035 |
| Report Coverage | Revenue Forecast, Market Dynamics, Market Opportunity Analysis, Technology and Innovation Landscape, Competitive Landscape, Recent Developments |
| Segments Covered | By Nature (Organic, Conventional), By Type (Makeup & Color Cosmetics, Skin & Sun Care Products, Hair Care Products, Deodorants & Fragrances), By Gender (Women, Men [Shaving, Oral Care, Personal Cleanliness, Skin Care, Others], Unisex) |
| Regional Analysis | North America (US and Canada), Europe (Germany, France, The UK, Spain, Italy, and Rest of Europe), Asia Pacific (China, Japan, South Korea, India, Australia, and Rest of APAC), Latin America (Brazil, Mexico, and Rest of Latin America), Middle East and Africa (GCC, South Africa, and Rest of MEA) |
| Competitive Landscape | Amorepacific Corp., Church and Dwight Co. Inc., CLARINS France, Coty Inc., Henkel AG and Co. KGaA, Johnson and Johnson Services Inc., Kao Corp., Koninklijke Philips N.V., LOreal SA, MacAndrews and Forbes Inc., Natura and Co Holding SA |
| Customization Scope | Customization for segments, region/country-level will be provided. Additional customization can be done based on requirements. |
| Purchase Options | We have three licenses to opt for: Single User License, Multi-User License (Up to 5 Users), Corporate Use License (Unlimited User and Printable PDF) |





































