


Report Overview
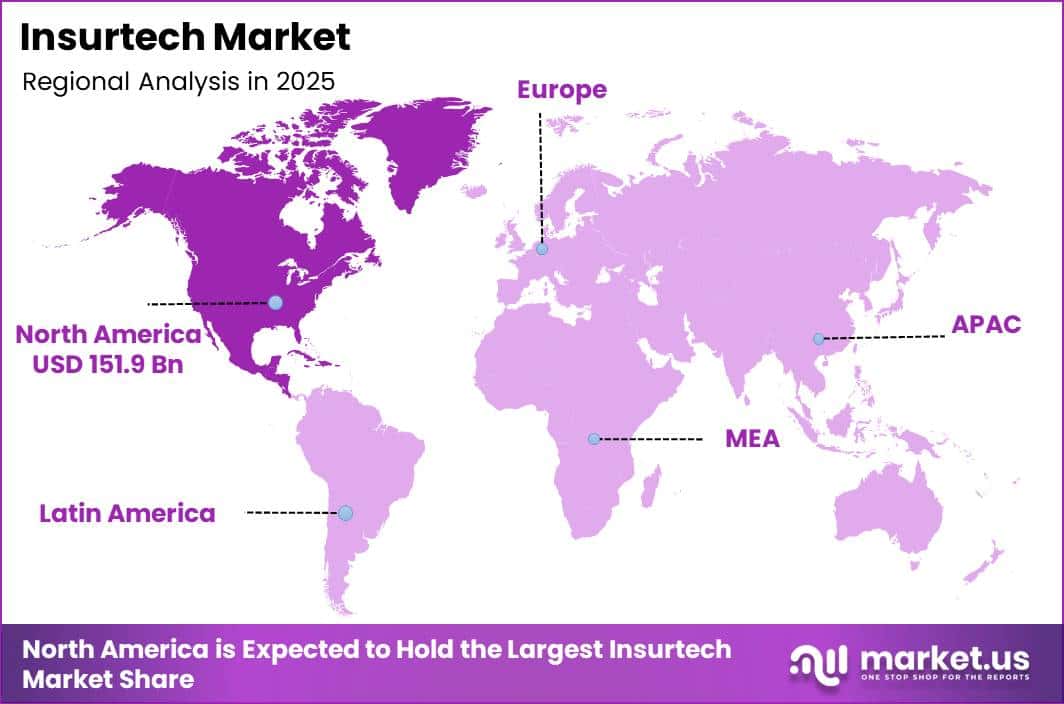
In 2025, the Global Insurtech Market was valued at USD 409.4 billion. The market is projected to grow at a CAGR of 29.8% during 2026–2035, reaching approximately USD 1,810.3 billion by 2035. North America dominated the global market in 2025, accounting for more than 37.1% of the total market share and generating approximately USD 151.9 billion in revenue.
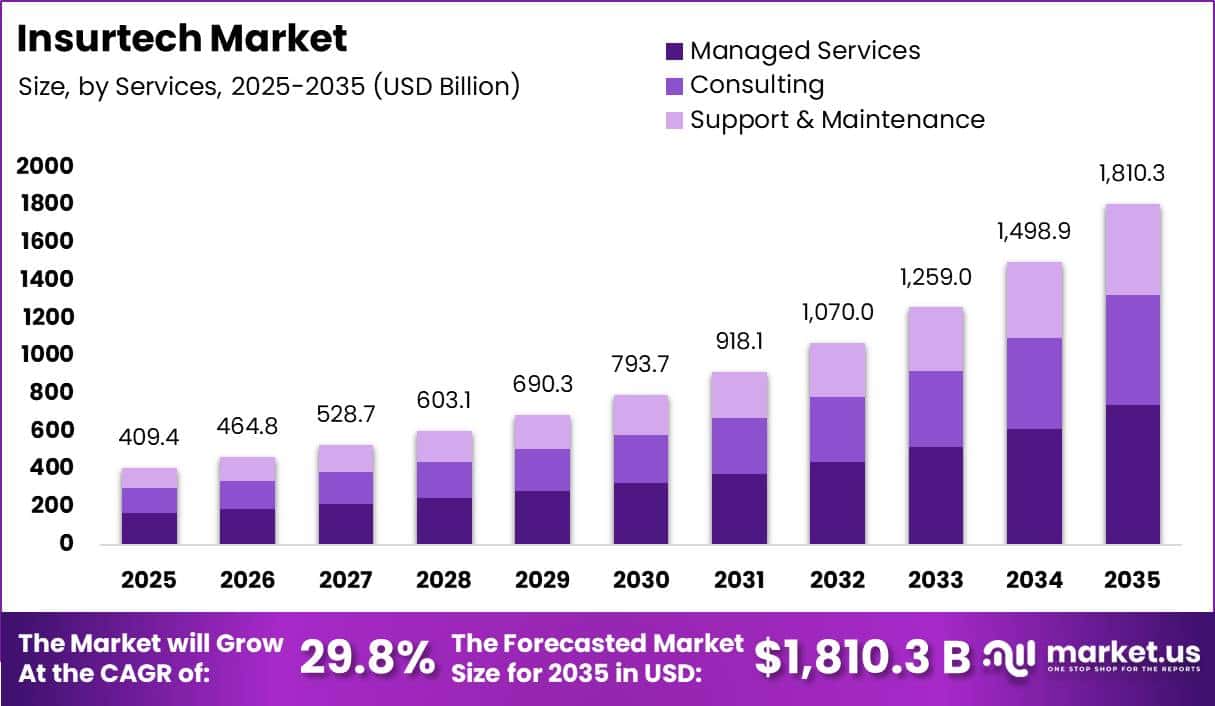
This strong growth reflects the rapid use of digital technologies across insurance and financial services. Global insurance-sector IT spending exceeded USD 200 billion in 2023 and is expected to grow by more than 8% annually through 2027. Insurers are directing a large share of this investment toward cloud platforms, data analytics, artificial intelligence, automation, and modern core insurance systems. Worldwide IT spending is also forecast to reach USD 6.08 trillion in 2026, representing growth of 9.8% from 2025.
North America accounted for the largest share of the global insurtech market. The region benefits from strong digital infrastructure, high technology spending, and faster replacement of legacy insurance systems. Around 68% of insurance companies are upgrading to cloud-based platforms, supporting demand for scalable Insurtech solutions. Digital payments and online financial services are also creating new growth opportunities.
India’s Unified Payments Interface processed more than 19 billion transactions per month by mid-2025, supporting instant premium payments, claims settlements, and embedded insurance services. As more insurance policies are purchased and managed through digital channels, insurers require automated platforms that can handle large transaction volumes, real-time data, personalized pricing, and faster claims decisions. This continued digital shift is expected to support market growth beyond USD 1.8 trillion by 2035.
Key Takeaway
- The Insurtech market reached USD 409.4 billion in 2025 and is projected to reach USD 1,810.3 billion by 2035, growing at a 29.8% CAGR.
- Managed services dominated the service segment with around a 41% share, driven by rising technology outsourcing.
- Property and casualty services held nearly 58% share, supported by large premium volumes and frequent claims.
- Traditional agents and brokers led distribution with approximately 39.8% share, reflecting continued demand for professional advice.
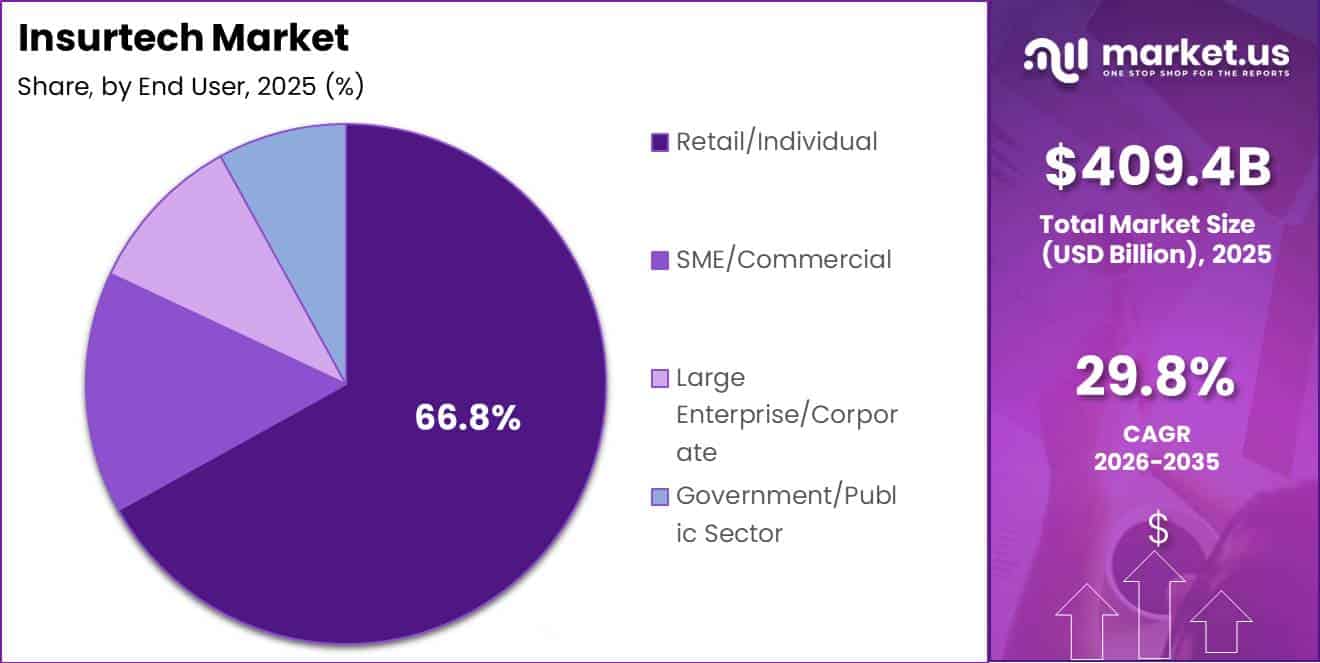
- Retail and individual customers accounted for around 66.8% of end-user demand, representing the largest policyholder base.
- Cloud computing captured nearly 24% of technology adoption, supported by scalable and reliable digital infrastructure.
- Policy administration and management represented around 25% of application usage, while BFSI accounted for approximately 20% of end-use adoption.
- North America led the market with a 37.1% share, generating approximately USD 151.9 billion in 2025.
By Services
Managed services accounted for around 41% of Insurtech service revenues, supported by insurers outsourcing complex technology operations instead of managing them internally. Global insurance IT spending exceeded USD 200 billion in 2023, with a growing share directed toward cloud infrastructure, cybersecurity, data integration, and regulatory compliance.
These systems require 24/7 monitoring, regular software updates, and skilled technical support. Managed service providers help insurers operate these platforms efficiently while reducing internal technology costs.
Support and maintenance represents the fastest-growing device-related segment as insurers expand their use of connected systems, mobile applications, digital platforms, and application programming interfaces. The Reserve Bank of India reported that UPI processed 185.8 billion digital payment transactions in FY25, increasing by 41.7% year over year.
By Product Line (Insurance Type)
Property and casualty services accounted for around 58% of the Insurtech market, supported by their large premium base and high claims volume. Non-life insurance, including property and casualty coverage, represents more than half of total global insurance premiums.
In the United States, insurers write over USD 850 billion in property and casualty premiums annually, covering hundreds of millions of vehicles, homes, and commercial assets. Specialty lines are the fastest-growing segment, expanding at an estimated CAGR of 17.8%. These products cover complex risks such as cyberattacks, marine transport, energy infrastructure, and corporate liability, where losses can reach hundreds of millions of dollars per event.
By Distribution Channel
Traditional agents and brokers accounted for around 39.8% of Insurtech distribution, as complex insurance products still require professional advice and customer support. Global insurance premiums exceeded USD 7 trillion in recent years, while commercial and non-life policies continue to depend heavily on intermediaries.
Insurance penetration in the European Union is approximately 7% of GDP, with licensed agents and brokers serving millions of households and small businesses. Insurers are therefore using Insurtech platforms to improve these channels rather than replace them.
Embedded insurance platforms are the fastest-growing distribution segment, expanding at an estimated CAGR of 17%. In 2025, India’s Unified Payments Interface processed around 228.3 billion transactions valued at nearly INR 300 lakh crore and represented more than 80% of retail digital payments. Embedded insurance platforms connect with payment, e-commerce, lending, and mobility applications to offer travel, device, credit, and other small-value policies during checkout.
By End User
Retail and individual customers accounted for around 66.85% of Insurtech end-user demand because they represent the largest group of insurance policyholders and digital payment users. The global adult population exceeds 5 billion, while insurance coverage for motor, health, and home products reaches more than 90% of households in several developed economies.
In India, the Unified Payments Interface served approximately 491 million individuals and processed 185.8 billion transactions in FY25, representing more than 80% of retail digital payments. These transactions support premium collection, claims payments, and embedded microinsurance.
SME and commercial users are the fastest-growing end-user segment, expanding at an estimated CAGR of 15%. Micro, small, and medium-sized enterprises account for over 90% of businesses and around 70% of global employment. These companies increasingly use cloud accounting, digital payment terminals, online marketplaces, and e-commerce platforms.
By Technology
Cloud computing accounted for around 24% of Insurtech technology adoption, supported by the need for scalable and reliable infrastructure. Around 70% of insurers worldwide have introduced cloud strategies, while nearly 67% use software-as-a-service for at least one core function. These systems can reduce total ownership costs by 25–30% compared with on-premise platforms.
Cloud infrastructure helps insurers process millions of quotes, policies, and claims while managing sudden demand during storms or regulatory reporting periods. It also supports pricing engines, fraud detection, digital customer portals, telematics data, health applications, and payment integrations.
Blockchain is the fastest-growing Insurtech technology segment because insurance depends on trusted records, secure payments, and agreements between several parties. More than 40 countries are piloting or implementing distributed-ledger and central bank digital currency projects. India’s UPI processed over 22,000 crore, or 220 billion, transactions in 2025, showing the scale of digital verification and settlement.
By Application
Policy administration and management accounted for around 25% of Insurtech application usage because every insurance policy requires continuous record management throughout its life cycle. Global insurance premiums exceed USD 7 trillion annually and cover billions of active life, health, motor, property, and commercial policies. Each policy creates information related to coverage, billing, renewals, endorsements, documents, and claims.
Underwriting and risk assessment is the fastest-growing application segment, with an estimated CAGR of 32.5%. Growth is driven by the need for more accurate and real-time risk pricing. More than 1.5 billion motor vehicles are in use globally, while hundreds of millions of properties are located in climate-sensitive areas.
Key Market Segments
By Services
- Consulting
- Support & Maintenance
- Managed Services
By Product Line (Insurance Type)
- Life Insurance
- Health Insurance
- Property & Casualty
- Motor
- Home
- Commercial
- Business
- Liability
- Other
- Specialty Lines
- Cyber
- Pet
- Marine
- Travel
- Other
- Others
By Distribution Channel
- Direct-to-Consumer (D2C) Digital
- Aggregators/Marketplaces
- Digital Brokers/MGAs
- Embedded Insurance Platforms
- Traditional Agents/Brokers
- Bancassurance
- Other Channels
By End User
- Retail/Individual
- SME/Commercial
- Large Enterprise/Corporate
- Government/Public Sector
By Technology
- Blockchain
- Cloud Computing
- Internet of Things
- AI & ML
- Big Data and Analytics
- Robo Advisory
- Others
By Application
- Claims Management
- Policy Administration and Management
- Fraud Detection and Prevention
- Underwriting and Risk Assessment
- Customer Experience Management
- Regulatory Compliance
- Sales and Distribution
Geopolitical Impact Analysis
Geopolitical tensions are increasing the operating costs and delivery risks faced by the Insurtech market. The sector depends on cloud servers, telecom equipment, secure data centers, and electronic components. Average global tariffs on merchandise trade are around 9%, while several Chinese electronic products face much higher U.S. duties.
Printed circuit boards can attract tariffs of 30–55%, while lithium-ion batteries, cables, and LCD screens face rates of 55–58.9%. Semiconductors and integrated circuits used in servers and storage systems may carry combined duties of 50–60%. When tariffs increase electronics prices by 10–40%, the cost of expanding data centers and cloud infrastructure also rises. Insurtech providers may absorb these expenses or increase software, hosting, and cybersecurity charges, which can weaken adoption in price-sensitive markets.
Regional conflicts and shipping disruptions create further pressure on infrastructure deployment. Rerouting vessels away from high-risk routes can add 10–14 days to Asia–Europe shipping times and increase freight rates by 40–60%. Delivery periods for telecom and data-center equipment, which normally range from 4–6 weeks, can extend to 8–10 weeks or more on some Gulf-linked routes.
These delays can slow the installation of network nodes, backup facilities, and edge-computing sites. Geopolitical shocks can also cause oil prices to rise by 20–30% within months, increasing electricity and cooling expenses for data centers. Together, higher hardware costs, longer delivery cycles, and rising energy expenses influence Insurtech pricing, regional expansion, and infrastructure investment decisions.
Regional Analysis
North America led the global Insurtech market with around a 37.1% share and revenue of approximately USD 151.9 billion. The region benefits from a well-established insurance industry, strong capital availability, advanced digital infrastructure, and high technology spending. Insurance penetration in the United States and Canada exceeds 6–7% of GDP, while combined non-life and health insurance premiums surpass USD 2 trillion annually.
Large volumes of motor, property, health, and specialty insurance policies create strong demand for automated underwriting, fraud detection, digital claims processing, and personalized pricing. Insurers across the region are also investing heavily in cloud platforms, artificial intelligence, data analytics, and modern policy administration systems.
Asia Pacific is the fastest-growing regional market, expanding at an estimated CAGR of 16.0% during the forecast period. Insurance penetration remains below 4% of GDP in many emerging Asian economies, while the region represents more than 50% of the global population. This large underinsured population creates significant opportunities for digital insurance providers.
Key Regions and Countries
North America
- US
- Canada
Europe
- Germany
- France
- The UK
- Spain
- Italy
- Rest of Europe
Asia Pacific
- China
- Japan
- South Korea
- India
- Australia
- Rest of APAC
Latin America
- Brazil
- Mexico
- Rest of Latin America
Middle East & Africa
- GCC
- South Africa
- Rest of MEA
Market Dynamics
Drivers
| Driver | (~) % CAGR | Geographic Relevance | Impact Timeline |
|---|---|---|---|
| Rapid AI-led underwriting & claims automation | +3.5% | North America, Europe, Asia Pacific | Medium term (2 to 4 years) |
| Expansion of embedded & usage-based insurance | +2.8% | Global, especially Asia Pacific & Latin America | Short term (2 years or less) |
| Migration to cloud-native core insurance platforms | +2.2% | North America & Europe | Medium term (2 to 4 years) |
| Growth in digital payments & real-time settlement rails | +1.9% | Asia Pacific & Africa | Short term (2 years or less) |
| Regulator-backed digital identity & e-KYC frameworks | +1.4% | Global, led by EU & selected emerging markets | Long term (4 years or more) |
Rapid AI-led underwriting & claims automation
AI-led underwriting and claims automation is adding about +3.5% to the baseline CAGR as insurers industrialize machine-learning models for risk selection and claims triage. Per OECD insurance technology briefs, more than 40% of large carriers in North America and Europe now use AI or advanced analytics in at least one core underwriting or claims workflow, up from under 20% five years earlier.
According to SEC filings from leading digital insurers, in-force premiums managed on AI-first platforms grew at annual rates above 30% between 2023 and 2025, while operating expense ratios fell by roughly 5–7 percentage points as straight-through processing increased.
Per World Bank digital finance indicators, rapid growth in structured transactional and behavioral data gives these models richer inputs, enabling more detailed customer segmentation and dynamic pricing. Commercially, this shifts insurance from manually underwritten annual contracts toward continuously priced, data-driven coverage. It can support higher customer lifetime value and lower loss ratios, sustaining additional Insurtech growth above the baseline 29.8% CAGR.
Restraints
| Restraint | (~) % CAGR | Geographic Relevance | Impact Timeline |
|---|---|---|---|
| High interest rates & capital-cost pressure on insurers | -3.0% | Global, pronounced in North America & Europe | Short term (2 years or less) |
| Regulatory scrutiny of algorithmic fairness & pricing | -2.1% | North America & EU | Medium term (2 to 4 years) |
| Legacy core-system integration complexity | -1.8% | Global incumbents | Medium term (2 to 4 years) |
| Cybersecurity & data-privacy breach exposure | -1.6% | Global | Short term (2 years or less) |
| Reinsurance capacity tightening for digital MGAs | -1.3% | North America & Europe | Short term (2 years or less) |
High interest rates & capital-cost pressure on insurers
Elevated interest rates are subtracting roughly -3.0% from the Insurtech CAGR by constraining insurer and investor budgets for new platforms. According to IMF global financial stability data, average policy rates in advanced economies rose by 250–300 basis points between 2021 and 2024, pushing weighted average costs of capital for insurers into the high single digits.
Per World Bank lending-rate series, corporate borrowing costs in key Insurtech hubs have increased by about 3–4%, directly impacting the hurdle rates for digital transformation projects. Regulatory capital frameworks documented by the International Association of Insurance Supervisors show that carriers must maintain solvency ratios often above 150%, which, combined with higher discount rates, forces prioritization of immediate risk absorption over long-horizon technology bets.
Strategically, this leads to delayed core-system replacement, longer procurement cycles, and smaller pilot budgets, compressing near-term Insurtech spend and shaving several percentage points off the otherwise technology-driven growth trajectory implied by the baseline 29.8% CAGR.
Challenges
| Challenge | (~) % CAGR | Geographic Relevance | Mitigation Horizon |
|---|---|---|---|
| Specialized Insurtech talent gap | -2.4% | Global, concentrated in major insurance hubs | Long term (4 years or more) |
| Fragmented cross-border data governance | -2.0% | Global multi-market operators | Long term (4 years or more) |
| Complex multi-cloud & vendor management | -1.7% | North America & Europe | Medium term (2 to 4 years) |
| Underdeveloped microinsurance economics in emerging markets | -1.5% | Africa, South Asia, parts of Latin America | Medium term (2 to 4 years) |
| Climate-related claims volatility for digital portfolios | -1.3% | Global, higher in climate-exposed regions | Long term (4 years or more) |
Specialized Insurtech talent gap
The shortage of specialized Insurtech professionals creates around -2.4% friction on potential CAGR by delaying advanced analytics and automation projects. Vacancy rates for data science and AI engineering roles exceed 10% in several insurance hubs.
Although employment in professional and technical services has increased by more than 15% since 2020, workers with advanced analytics skills still represent less than 5% of the workforce in many emerging markets. Leading digital insurers often allocate over 20–25% of their employees to technology and R&D roles, showing the importance of skilled teams for faster execution.
Limited talent availability forces Insurtech companies and insurers to extend project schedules and offer salary premiums of around 20–30% above wider market averages. This slows the deployment of AI-based underwriting, automated claims, and advanced risk models, limiting market growth below its full technology-driven potential.
Opportunities
| Opportunity | (~) % CAGR | Geographic Relevance | Execution Window |
|---|---|---|---|
| Scaling embedded insurance across high-volume digital ecosystems | +3.0% | Asia Pacific, North America, global platforms | Medium term (2 to 4 years) |
| Leveraging open insurance & API standards | +2.3% | EU, Latin America, selected Asia Pacific markets | Long term (4 years or more) |
| Cyber & AI liability Insurtech products | +2.1% | Global corporate segments | Medium term (2 to 4 years) |
| Parametric insurance for climate and supply-chain risks | +1.9% | Global, especially climate-exposed economies | Long term (4 years or more) |
| Insurtech-enabled health & wellness ecosystems | +1.6% | Global, with faster uptake in Asia Pacific | Medium term (2 to 4 years) |
Scaling embedded insurance across high-volume digital ecosystems
Scaling embedded insurance across high-volume digital platforms could add around +3.0% to the baseline CAGR by covering more underinsured transactions. Real-time payment systems in major Asia Pacific markets process over 200 billion retail transactions annually, while insurance attachment rates remain in the low single digits.
Smartphone penetration has also exceeded 80% in many emerging economies by 2025, creating a large user base for insurance offered through apps and digital checkout systems. Embedded products can improve business performance by reducing policy acquisition costs by an estimated 30–50% and increasing conversion rates by several percentage points.
Regulatory sandboxes in Asia and Latin America are also supporting microinsurance and digital distribution models. By integrating coverage into payments, mobility, e-commerce, and software billing, insurers can increase policy volumes and fee income. This could lift market growth above the current 29.8% baseline without requiring an equal rise in marketing spending.
Key Players Analysis
Tier-1 Insurtech companies are large-scale players with broad product portfolios, strong customer bases, and high premium volumes. Lemonade generated USD 737.9 million in revenue in 2025, increasing by 40.2% year over year. Its in-force premium reached USD 1.2 billion, while its customer base grew by 31% to approximately 3 million.
Hippo recorded USD 1.1 billion in gross written premiums, up 24%, and generated USD 468.6 million in total revenue during 2025. The company also reported USD 58 million in net income and improved its combined ratio by nearly 25 percentage points. Root Insurance and Oscar Health also belong to this tier due to their national reach, with Oscar generating more than USD 1.5 billion in annual revenue. Together, Tier-1 players are estimated to represent 20–25% of the market by premium volume.
Tier-2 companies include niche insurers and technology providers. Bright Health previously generated over USD 1.5 billion in annual premium revenue. DXC Technology supports insurers through cloud and policy-system projects within its USD 16–17 billion revenue base. Wipro’s BFSI division represents around 30% of its USD 11–12 billion revenue and invests hundreds of millions of dollars in AI and automation.
Damco Group, Majesco, Quantemplate, Shift Technology, TRAVV, Inc., ZhongAn Insurance, and other specialists collectively address around 10–15% of market revenues. Shift Technology serves more than 30 insurers and processes millions of claims, while ZhongAn has issued billions of digital micro-policies.
Top Key Players in the Market
- Lemonade
- Hippo Insurance
- Root Insurance
- Oscar Health
- Bright Health
- Damco Group
- DXC Technology Company
- Insurance Technology Services
- Majesco
- Oscar Insurance
- Quantemplate
- Shift Technology
- TRAVV, Inc.
- Wipro Limited
- ZhongAn Insurance
Recent Developments
- In 2025, Majesco expanded its insurance technology portfolio through the Fall ’25 release, which introduced 13 specialized AI agents. These agents support major insurance functions, including underwriting, policy administration, billing, payments, claims processing, and loss control.
- In 2025, Shift Technology launched Shift Claims, an agentic AI platform created to improve the speed and accuracy of claims management. The platform can assess claims, identify priority cases, recommend actions, and automate selected processing activities. Early users recorded 3% lower claims losses and 30% faster claims handling. The platform also achieved a 60% automation rate and more than 99% assessment accuracy.
Report Scope
| Report Features | Description |
|---|---|
| Market Value (2025) | USD 409.4 Billion |
| Forecast Revenue (2035) | USD 1,810.3 Billion |
| CAGR (2026-2035) | 29.8% |
| Base Year for Estimation | 2025 |
| Historic Period | 2020-2024 |
| Forecast Period | 2026-2035 |
| Report Coverage | Revenue Forecast, Market Dynamics, Competitive Landscape, Recent Developments |
| Segments Covered | By Services (Consulting, Support & Maintenance, Managed Services); By Product Line (Life Insurance, Health Insurance, Property & Casualty, Specialty Lines, Others); By Distribution Channel (Direct-to-Consumer Digital, Aggregators/Marketplaces, Digital Brokers/MGAs, Embedded Insurance Platforms, Traditional Agents/Brokers, Bancassurance, Other Channels); By End User (Retail/Individual, SME/Commercial, Large Enterprise/Corporate, Government/Public Sector); By Technology (Blockchain, Cloud Computing, Internet of Things, AI & ML, Big Data and Analytics, Robo Advisory, Others); By Application (Claims Management, Policy Administration and Management, Fraud Detection and Prevention, Underwriting and Risk Assessment, Customer Experience Management, Regulatory Compliance, Sales and Distribution) |
| Regional Analysis | North America – US, Canada; Europe – Germany, France, The UK, Spain, Italy, Rest of Europe; Asia Pacific – China, Japan, South Korea, India, Australia, Singapore, Rest of APAC; Latin America – Brazil, Mexico, Rest of Latin America; Middle East & Africa – GCC, South Africa, Rest of MEA |
| Competitive Landscape | Lemonade, Hippo Insurance, Root Insurance, Oscar Health, Bright Health, Damco Group, DXC Technology Company, Insurance Technology Services, Majesco, Quantemplate, Shift Technology, TRAVV, Inc., Wipro Limited, and ZhongAn Insurance |
| Customization Scope | Customization for segments, region/country-level will be provided. Moreover, additional customization can be done based on the requirements. |
| Purchase Options | We have three licenses to opt for: Single User License, Multi-User License (Up to 5 Users), Corporate Use License (Unlimited Users and Printable PDF) |





























