


Report Overview
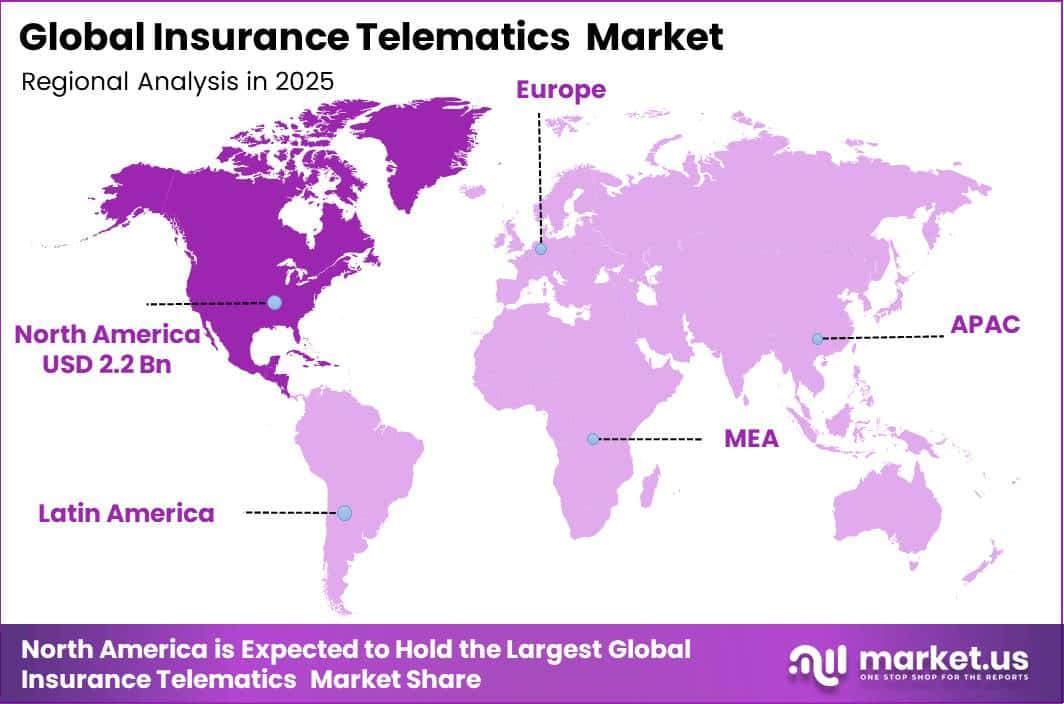
In 2025, the Global Insurance Telematics Market was valued at USD 4.6 billion. The market is projected to grow at a CAGR of 19.5% during 2026–2035, reaching approximately USD 27.1 billion by 2035. North America dominated the global market in 2025, accounting for more than 48.2% of the total market share and generating approximately USD 2.2 billion in revenue.
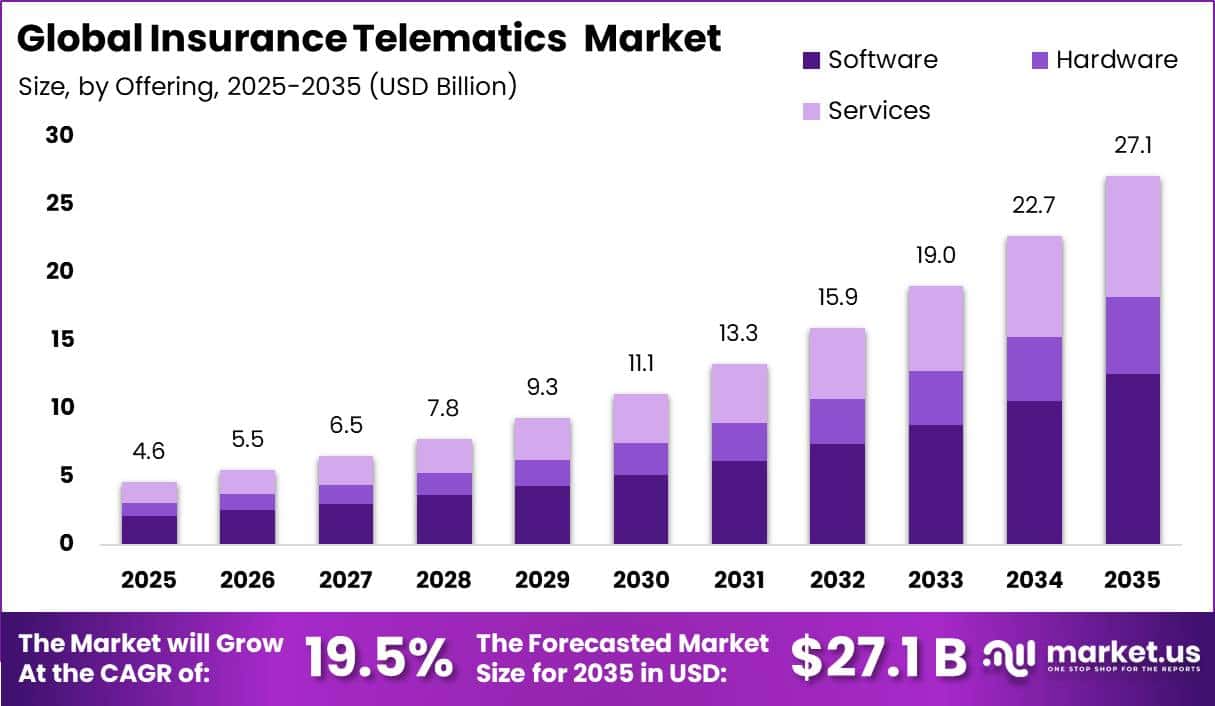
At this growth rate, compounding USD 4.6 billion over 10 years results in approximately USD 27.3 billion, closely matching the projected market value. Growth is mainly driven by insurers shifting from broad customer-based pricing toward policies based on actual driving behavior.
Telematics systems collect information such as mileage, speed, braking, cornering, trip timing, and accident signals through connected vehicle devices and smartphone applications. The potential customer base remains substantial, as OICA reported that the United States recorded 16.7 million vehicle sales in 2025.
The U.S. property and casualty insurance industry generated USD 932.5 billion in premiums in 2024, creating significant opportunities for data-driven underwriting. According to NHTSA, the United States recorded 39,254 traffic deaths in 2024, with a fatality rate of 1.19 deaths per 100 million vehicle miles travelled.
Key Takeaway
- The Insurance Telematics Market was valued at USD 4.6 billion in 2025 and is projected to reach USD 27.1 billion by 2035. The market is forecast to grow at a CAGR of 19.5% between 2026 and 2035.
- Software held the leading offering segment with a 46.4% share.
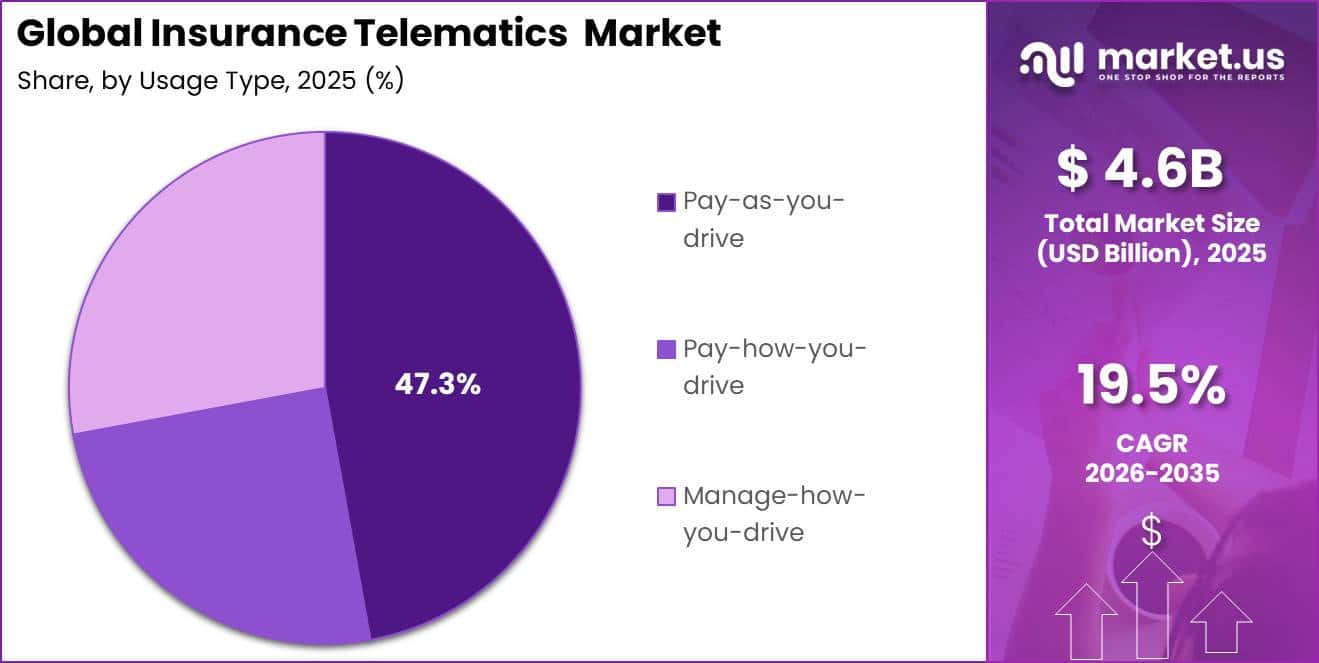
- Pay-as-you-drive (PAYD) led the usage-type segment with a 47.3% share.
- Passenger vehicles led the vehicle-type segment with a 54.7% share.
- North America led the market in 2025 with a 48.2% revenue share, worth approximately USD 2.2 billion.
By Offering
Software held a leading position in the insurance telematics market with a 46.4% share, mainly because it converts raw driving information into useful insurance insights. Compared with hardware-based solutions, software platforms can be deployed across large insurance portfolios without requiring a separate physical device for every policyholder.
The expanding global digital infrastructure further supports this segment. According to the International Telecommunication Union, around 5.5 billion people used the internet globally in 2024, while mobile-broadband subscriptions reached 95 per 100 people. This connectivity allows insurers to offer smartphone-based telematics programs with lower deployment costs.
At the same time, the global vehicle base continues to expand. OICA reported that 96.4 million vehicles were produced worldwide and 99.8 million vehicles were sold in 2025. As more vehicles and mobile devices generate real-time driving data, software remains the main operating layer for converting this information into underwriting, pricing, claims, and risk-management decisions.
By Usage Type
Pay-as-you-drive (PAYD) held a leading position in the insurance telematics market with a 47.3% share, mainly because vehicle mileage provides a simple and direct measure of driving exposure. Vehicles driven fewer miles generally have fewer opportunities to be involved in road accidents, allowing insurers to link premiums more closely with actual vehicle use.
According to the U.S. Federal Highway Administration, vehicles travelled around 3.2 trillion vehicle-miles in 2024, with an average of 11,071 miles per vehicle. This large difference in annual vehicle usage supports demand for insurance plans that calculate premiums based on actual mileage instead of using a fixed annual price.
By Vehicle Type
Passenger vehicles held a leading position in the insurance telematics market with a 54.7% share, mainly due to their large insured vehicle base and high volume of individual driving data. According to the European Automobile Manufacturers’ Association, around 256 million passenger cars were operating on EU roads in 2024, representing an increase of 1.4% from 2023.
During the same year, global passenger-car sales reached approximately 74.6 million units. This large vehicle population provides insurers with a wider customer base for telematics services compared with commercial fleets, which usually involve fewer vehicles and often rely on dedicated fleet-management solutions.
Passenger-car insurance is commonly purchased by individual drivers, making smartphone applications and connected-car telematics easier to introduce at the policy level. Each journey can generate information on mileage, routes, speed, braking, and time of travel, helping insurers improve risk assessment, premium pricing, and claims decisions.
Key Market Segments
By Offering
- Hardware
- Software
- Services
By Usage Type
- Pay-as-you-drive
- Pay-how-you-drive
- Manage-how-you-drive
By Vehicle Type
- Passenger Vehicles
- Commercial Vehicles
Geopolitical Impact Analysis
Geopolitical tensions are increasing the cost and delivery time of hardware used in the insurance telematics market, including GPS modules, cellular modems, sensors, microcontrollers, printed circuit boards, diagnostic connectors, and lithium-ion batteries. The Red Sea conflict has forced many shipping companies to reroute vessels around the Cape of Good Hope.
According to the International Monetary Fund, this diversion added 10 days or more to average delivery times. UNCTAD also reported that Suez Canal ship transits were 57% below their previous peak by mid-October 2024, while vessel capacity redirected around Africa increased by 89%.
Trade restrictions are creating additional cost pressure. U.S. tariffs on Chinese semiconductors increased from 25% to 50% in 2025, while selected lithium-ion batteries and battery parts were subject to a 25% duty. Since semiconductors and batteries are key parts of connected telematics devices, higher tariffs can increase procurement costs and pressure supplier margins. Energy-price volatility adds another challenge.
According to the IEA, Brent crude prices increased by USD 20 per barrel to around USD 92 per barrel following Middle East hostilities in 2026. Higher fuel, freight, and installation costs could further encourage insurers to adopt app-based and remotely deployed telematics software.
Regional Analysis
North America held a dominant position in the insurance telematics market, accounting for 48.2% of global revenue and approximately USD 2.2 billion in 2025. The region benefits from a large motor insurance customer base, strong digital infrastructure, and early adoption of usage-based insurance programs.
According to the National Association of Insurance Commissioners, U.S. private-passenger auto insurers recorded USD 344.1 billion in direct premiums written in 2024. This large premium base provides insurers with greater capacity to invest in telematics platforms, connected-car services, mobile applications, automated claims systems, and data-based underwriting.
Asia Pacific is expected to be the fastest-growing region, supported by rising vehicle ownership, smartphone penetration, digital payments, and app-based insurance services. Global passenger-car sales reached 74.6 million units in 2024, with Asia representing a major share of automotive activity.
Key Regions and Countries
North America
- US
- Canada
Europe
- Germany
- France
- The UK
- Spain
- Italy
- Rest of Europe
Asia Pacific
- China
- Japan
- South Korea
- India
- Australia
- Rest of APAC
Latin America
- Brazil
- Mexico
- Rest of Latin America
Middle East & Africa
- GCC
- South Africa
- Rest of MEA
Market Dynamics
Drivers
| Driver | (~) % CAGR | Geographic Relevance | Impact Timeline |
|---|---|---|---|
| Usage-Based Pricing Adoption | +3.4% | North America, Europe | Short term (2 years or less) |
| Smartphone Telemetry Deployment | +2.8% | Global | Short term (2 years or less) |
| Connected Vehicle Data Growth | +2.5% | Europe, East Asia, North America | Medium term (2 to 4 years) |
| Claims Automation Demand | +1.9% | Global | Medium term (2 to 4 years) |
| Fleet Safety Requirements | +1.4% | North America, Europe | Medium term (2 to 4 years) |
Usage-Based Pricing Adoption
Usage-based pricing is the strongest active growth driver because it moves insurers from annual, pooled-risk pricing toward recurring, data-led underwriting that can be delivered through software rather than physical devices.
The U.S. National Highway Traffic Safety Administration recorded 39,254 road deaths in 2024, equal to a fatality rate of 1.19 per 100 million vehicle-miles travelled, maintaining a clear loss-control need for real-time risk scoring; Federal Highway Administration data also show U.S. travel rose by roughly 29.8 billion vehicle-miles in 2025.
The U.S. Federal Trade Commission’s connected-car enforcement activity in 2025 and 2026 has simultaneously increased the value of consent-led, auditable data architectures. Together, these conditions support subscription revenue, lower device logistics costs, and faster insurer rollout, contributing an estimated +3.4% incremental lift to the 19.5% baseline CAGR.
Restraints
| Restraint | (~) % CAGR | Geographic Relevance | Impact Timeline |
|---|---|---|---|
| Consent and Privacy Enforcement | -2.6% | North America, Europe | Short term (2 years or less) |
| Legacy Core-System Budgets | -1.8% | North America, Europe | Medium term (2 to 4 years) |
| Hardware Import Cost Exposure | -1.3% | North America, Europe | Short term (2 years or less) |
| Policyholder Data Reluctance | -1.2% | Europe, North America | Medium term (2 to 4 years) |
| Small Insurer Funding Limits | -0.9% | Emerging markets | Medium term (2 to 4 years) |
Consent and Privacy Enforcement
Consent and privacy enforcement is a direct sales restraint because insurers cannot reliably monetize driving-location data without clear permission, documented purpose limitation, and controllable sharing rights.
The U.S. Federal Trade Commission finalized a 5-year prohibition on General Motors and OnStar disclosing certain geolocation and driving-behaviour data to consumer reporting agencies in 2026, while requiring affirmative express consent over the order’s 20-year duration.
The European Commission’s General Data Protection Regulation permits maximum penalties of up to €20 million or 4% of annual worldwide turnover for serious breaches, and the European Commission confirms that the Data Act has applied since September 12, 2025.
Compliance raises legal review, cybersecurity, consent-management, and data-governance costs before a policy can be sold, delaying launches and reducing near-term operating leverage; this supports an estimated -2.6% drag against baseline CAGR.
Challenges
| Challenge | (~) % CAGR | Geographic Relevance | Mitigation Horizon |
|---|---|---|---|
| Vehicle Data Fragmentation | -2.1% | Global | Long term (4 years or more) |
| Cybersecurity Assurance Burden | -1.7% | Global | Medium term (2 to 4 years) |
| Claims Model Explainability | -1.4% | North America, Europe | Medium term (2 to 4 years) |
| Device Supply Volatility | -1.1% | Global | Short term (2 years or less) |
| Actuarial Skills Scarcity | -0.8% | Global | Long term (4 years or more) |
Vehicle Data Fragmentation
Vehicle-data fragmentation is the largest ongoing operational challenge because insurers must normalize mileage, event, location, diagnostic, and driver-behaviour inputs across OEM systems, mobile operating systems, and aftermarket devices before a comparable risk score can be produced.
European Commission eCall rules have required the 112-based system in new M1 and N1 vehicle types since March 31, 2018, but eCall transmits a limited emergency data set rather than continuous insurance-grade behavioural data. The U.S. Federal Trade Commission also identifies geolocation, telematics, video, and biometric information as sensitive connected-car data.
Opportunities
| Opportunity | (~) % CAGR | Geographic Relevance | Execution Window |
|---|---|---|---|
| Commercial Fleet Risk Platforms | +3.1% | North America, Europe, Asia Pacific | Medium term (2 to 4 years) |
| Embedded OEM Insurance | +2.7% | Europe, East Asia, North America | Long term (4 years or more) |
| EV Battery Risk Scoring | +2.0% | Europe, China, North America | Medium term (2 to 4 years) |
| Gig-Mobility Coverage | +1.6% | Global urban markets | Short term (2 years or less) |
| Cross-Border Data Exchanges | +1.2% | Europe, North America | Long term (4 years or more) |
Commercial Fleet Risk Platforms
Commercial fleet risk platforms are future upside rather than a current baseline driver because many insurers still price fleets primarily through historic loss records, vehicle classes, and annual declarations instead of continuous fleet-level evidence.
The U.S. National Highway Traffic Safety Administration estimates that speeding-related crashes caused 11,288 deaths in 2024, representing 29% of all traffic fatalities, while its preliminary data indicate vehicle-miles travelled rose by roughly 0.9% in 2025.
The European Commission’s Data Act framework, applicable from September 12, 2025, improves the potential for authorized access to data produced by connected products and related services. Insurers that combine video, trip, diagnostic, and driver-coaching data can shift from annual fleet reviews to recurring risk-prevention services; remote software onboarding can avoid the hardware, installation, and truck-downtime costs of dedicated retrofit programs.
Key Players Analysis
The insurance telematics market has a tiered competitive structure, with large technology and mobility companies leading through scale, recurring software revenue, and acquisitions. Among Tier-1 players, Trimble Inc. reported FY2025 revenue of USD 3,587.3 million and annualized recurring revenue of USD 2,392.3 million, representing 6% year-over-year growth.
The company also invested USD 630.7 million in research and development, equal to 17.6% of revenue, showing its strong focus on connected-asset and telematics software. MiX Telematics became part of Powerfleet Inc. following their business combination in April 2024.
The combined company started with revenue of USD 284 million, including USD 215 million in recurring SaaS revenue and a 65% service gross margin. Powerfleet further strengthened its position through the USD 190 million acquisition of Fleet Complete in October 2024, which added USD 130.3 million in nine-month pro forma revenue.
Tier-2 competitors include Sierra Wireless, which Semtech Corp acquired for USD 1.2 billion in an all-cash transaction valued at USD 31 per share, completed in January 2023. Other specialized players include Agero Inc., Octo Telematics, Masternaut, TomTom Telematics, Meta System, Aplicom, and Intelligent Mechatronic Systems.
Top Key Players in the Market
- Agero Inc.
- Aplicom
- Intelligent Mechatronic System
- Masternaut Ltd.
- Meta System S.p.A
- MiX Telematics Ltd.
- Octo Telematics S.p.A
- Sierra Wireless Inc.
- TomTom Telematics BV
- TRIMBLE INC.
Recent Developments
- In 2026, Admiral Group completed the acquisition of Flock in June after receiving regulatory approval. The transaction valued 100% of Flock’s equity at £80 million. Admiral already held a 3% investment in Flock at the end of 2025.
- In 2025, ABAX Group’s Fair Insurance division selected OCTO Telematics as its usage-based insurance risk-scoring partner following a six-month competitive RFP process. OCTO’s AI-based technology is being used to improve risk assessment, insurance pricing, and customer experience.
- ABAX reported more than 500,000 tracked assets and 40,000 customers, providing a meaningful operating base for expanding telematics-supported and data-driven insurance services.
Report Scope
| Report Features | Description |
|---|---|
| Market Value (2025) | USD 4.6 Billion |
| Forecast Revenue (2035) | USD 27.1 Billion |
| CAGR (2026-2035) | 19.5% |
| Base Year for Estimation | 2025 |
| Historic Period | 2020-2024 |
| Forecast Period | 2026-2035 |
| Report Coverage | Revenue Forecast, Market Dynamics, Competitive Landscape, Recent Developments |
| Segments Covered | By Offering (Hardware, Software, Services); By Usage Type (Pay-as-you-drive, Pay-how-you-drive, Manage-how-you-drive); By Vehicle Type (Passenger Vehicles, Commercial Vehicles) |
| Regional Analysis | North America – US, Canada; Europe – Germany, France, The UK, Spain, Italy, Rest of Europe; Asia Pacific – China, Japan, South Korea, India, Australia, Singapore, Rest of APAC; Latin America – Brazil, Mexico, Rest of Latin America; Middle East & Africa – GCC, South Africa, Rest of MEA |
| Competitive Landscape | Agero Inc., Aplicom, Intelligent Mechatronic System, Masternaut Ltd., Meta System S.p.A, MiX Telematics Ltd., Octo Telematics S.p.A, Sierra Wireless Inc., TomTom Telematics BV, TRIMBLE INC. |
| Customization Scope | Customization for segments and region/country-level will be provided. Moreover, additional customization can be done based on the requirements. |
| Purchase Options | We have three licenses to opt for: Single User License, Multi-User License (Up to 5 Users), Corporate Use License (Unlimited Users and Printable PDF) |





































