


Report Overview
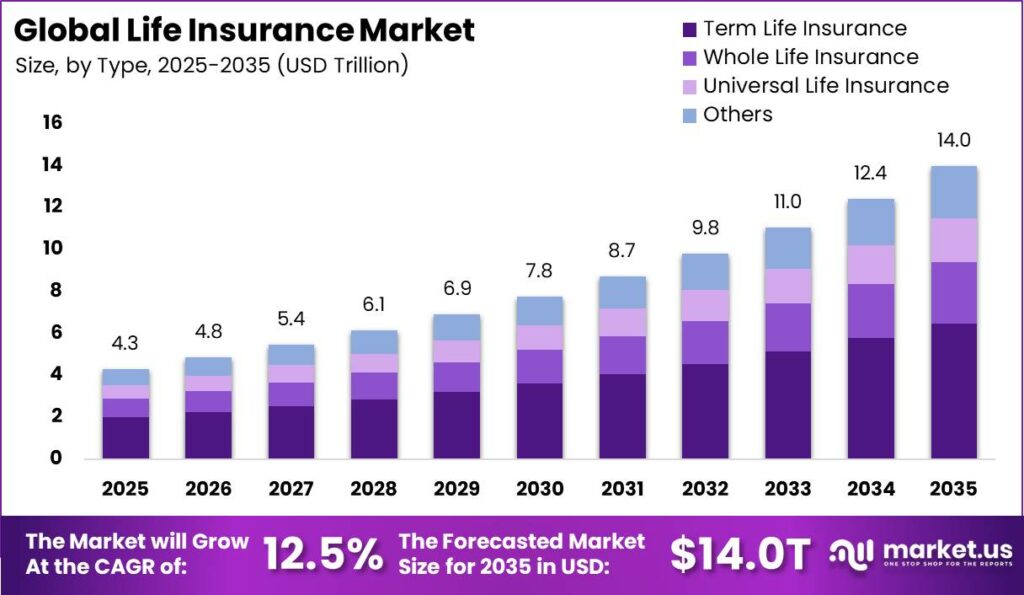
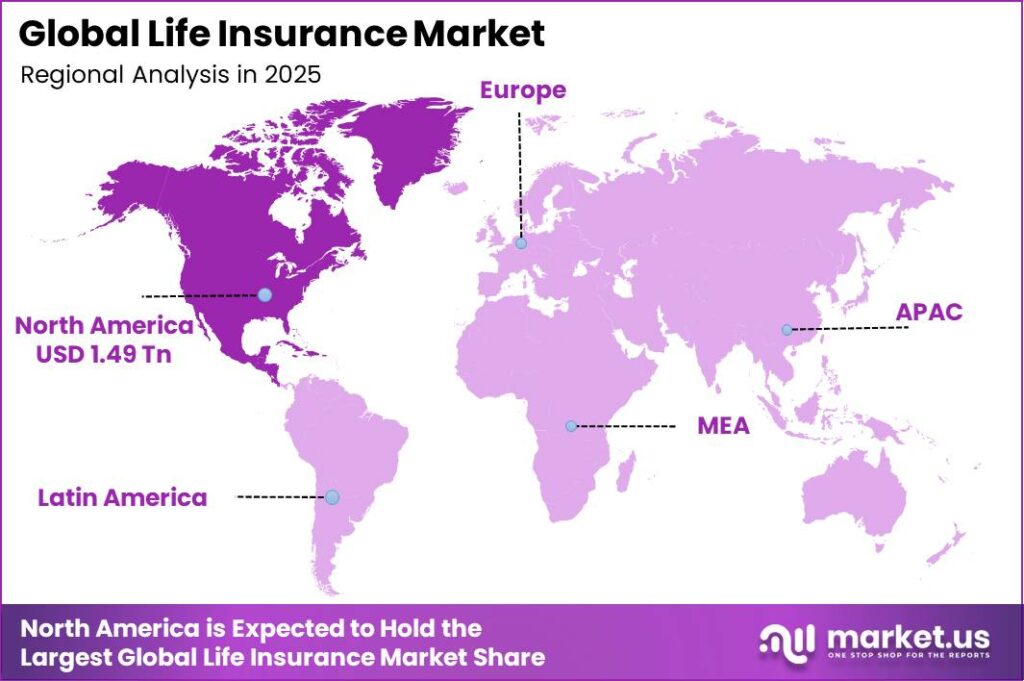
In 2025, the Global Life Insurance Market was valued at USD 4.3 trillion. The market is projected to grow at a CAGR of 12.5% during 2026–2035, reaching approximately USD 14.0 Trillion by 2035. North America dominated the global market in 2025, accounting for more than 34.6% of the total market share and generating approximately USD 1.49 trillion in revenue.
The International Association of Insurance Supervisors (IAIS) reports that global reinsurance premiums alone touched USD 1.75 trillion by the end of 2024, showing how fast the wider insurance base is expanding and creating room for life segment growth.
The Organisation for Economic Co-operation and Development (OECD) notes that gross premiums written across its member countries reached USD 6.94 trillion in 2024, nearly triple the USD 2.51 trillion recorded in 2000, proving that rising incomes and savings habits are pushing more households toward long-term financial protection products like life insurance.
According to the Government of India’s Press Information Bureau, citing the Swiss Re Sigma Report, India’s insurance sector alone collected premiums of ₹11.93 lakh crore in FY 2024–25 and managed assets of ₹74.44 lakh crore, showing how fast even emerging markets are catching up and adding volume to the global life insurance pool.
Key Takeaway
- The Global Life Insurance Market is projected to grow from 4.3 trillion in 2025 to 14.0 trillion by 2035.
- The market is expected to expand at a 12.5% CAGR from 2025 to 2035, indicating strong long-term growth momentum.
- Term Life Insurance dominates by type, accounting for 46.4% of the market.
- The Medium Premium Range represents the leading premium segment, with a 41.3% market share.
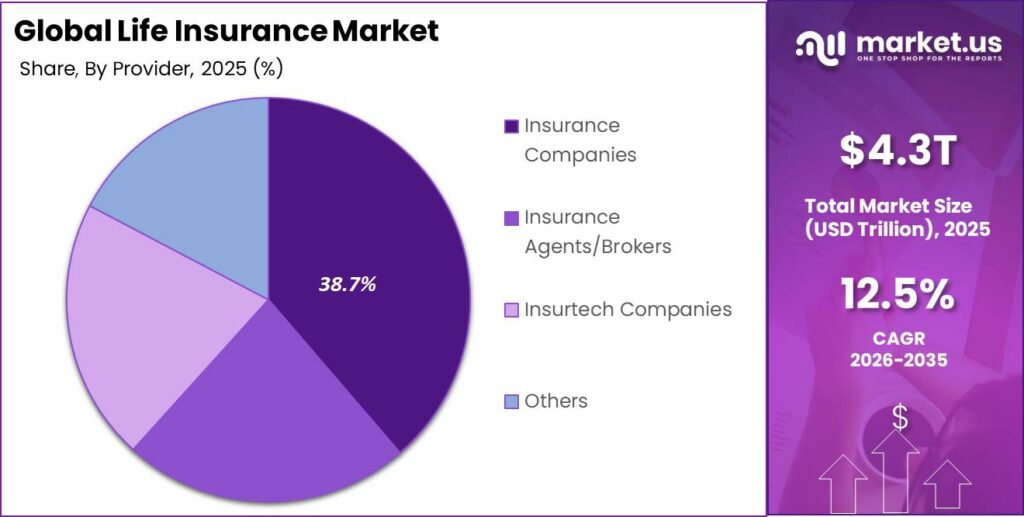
- Insurance companies are the leading providers, holding a 38.7% share of the market.
- North America leads the market with a 34.6% share, representing approximately 1.49 trillion in market value.
By Type
In 2025, Term Life Insurance held a dominant market position, capturing more than a 46.4% share. Policy demand rose alongside overall life insurance premiums, which reached ₹8.86 lakh crore in FY 2024–25, with 55.09% coming from renewal business, showing that customers were keeping protection‑focused covers active.
India issued 41.84 crore insurance policies across segments in FY 2024–25, and a large portion of these were basic risk‑cover contracts that favoured term structures over complex savings plans. Insurance density in the country increased from USD 95 to USD 97 between 2023–24 and 2024–25, reflecting more lives covered and greater acceptance of simple products.
By Premium Range
Medium premium life insurance held a significant share of the market in 2025, accounting for around 41.3% of policies in the mid‑ticket band. This range benefited from rising but still cautious household spending, as life insurance premiums grew 6.73% in FY 2024–25 while the number of new policies fell 7.4%, suggesting customers were opting for fewer, better‑funded covers.
Insurance penetration in India stood at 2.7% of GDP for life in 2024–25, below the global average, leaving room for growth in mid‑range products that balance affordability and adequate protection. In September 2025, new life business premiums rose to ₹40,206 crore, with year‑to‑date collections increasing from ₹1,89,214 crore to ₹2,03,668 crore, reflecting ongoing appetite for mid‑range coverage as insurers promoted flexible, rider‑rich plans through branch and bancassurance channels.
By Provider
Insurance companies held a significant share of the life insurance market in 2025, representing about 38.7% of active policies across formal providers. India’s insurance ecosystem comprised 74 registered insurers as of March 2025, including 26 life insurers, which formed the backbone of life protection and savings offerings.
Life insurance premiums alone reached ₹8.86 lakh crore in FY 2024–25, supported by investments that rose to ₹74.43 lakh crore, underlining the scale at which licensed insurers manage long‑term funds.
Sector‑wide, premiums across life and non‑life touched ₹11.93 lakh crore in the same year, with claims of ₹8.36 lakh crore paid, reinforcing trust in regulated companies’ ability to honour obligations. As of FY 2024–25, insurance penetration for life stood at 2.7% of GDP, with companies driving inclusion under the “Insurance for All by 2047” vision through branch, digital, and partner networks.
Key Market Segments
By Type
- Term Life Insurance
- Whole Life Insurance
- Universal Life Insurance
- Others
By Premium Range
- Low
- Medium
- High
By Provider
Market Dynamics
Drivers
| Driver | (~) % Impact on CAGR Forecast | Geographic Relevance | Impact Timeline |
|---|---|---|---|
| Demographic ageing and pension gap in Asia | +2.3% | Asia-Pacific (China, India, Japan) | Medium term (2–4 years) |
| Higher-for-longer interest rates lifting annuity margins | +1.8% | North America | Short term (≤2 years) |
| AI-enabled underwriting compressing issuance cycle | +1.3% | Global | Short term (≤2 years) |
| Bancassurance and independent-broker channel expansion | +0.9% | Western Europe, Middle East | Medium term (2–4 years) |
| IFRS 17-driven transparency improving investor and consumer confidence | +0.5% | Global (early adopters: Europe, Asia) | Short term (≤2 years) |
Demographic ageing and pension gap in Asia
The root cause is a structural imbalance between rapidly ageing populations and underfunded public pension systems across China, India, and Southeast Asia, where private life and annuity coverage remains the primary retirement-income backstop; this dynamic pushed regional life premiums up by 9.9% in 2025, with China alone expanding 11.4%, even as North American annuity growth cooled from its post-rate-hike boom.
Quantitatively, this shifts the incremental contribution to the stated 12.5% baseline CAGR by roughly +2.3 percentage points, as insurers reallocate distribution capital toward whole-of-life and unit-linked savings products that carry higher first-year commission loads of 25–35% versus 10–15% for renewal premiums.
Strategically, carriers are restructuring product mix toward longer-duration participating and unit-linked contracts, which improves embedded value margins by an estimated 150–200 basis points but simultaneously extends capital lock-up periods, forcing CFOs to recalibrate solvency buffers and reinsurance cessions to manage the resulting duration mismatch on the balance sheet.
Restraints
| Restraint | (~) % Impact on CAGR | Geographic Relevance | Impact Timeline |
|---|---|---|---|
| Inflation-driven policy lapse and surrender spike | -1.6% | Emerging Markets (Latin America, South Asia) | Short term (≤2 years) |
| Tightened risk-based capital and solvency rules | -1.1% | Europe, Asia (RBC2 regimes) | Short term (≤2 years) |
| Commission-cap regulation curbing agent incentives | -0.8% | India, European Union | Short term (≤2 years) |
| Declining discretionary savings among under-40 cohort | -0.6% | North America, Western Europe | Short term (≤2 years) |
| Bancassurance exclusivity renegotiation disruptions | -0.4% | Middle East, Southeast Asia | Short term (≤2 years) |
Inflation-driven policy lapse and surrender spike
The root cause is sustained household budget pressure in inflation-exposed emerging markets, where real wage stagnation is forcing policyholders to surrender cash-value life contracts to cover near-term liquidity needs rather than treating premiums as a protected long-term commitment.
Quantitatively, this mechanism deducts an estimated -1.6 percentage points from the 12.5% baseline CAGR, as combined ratios in affected markets deteriorate and persistency ratios, historically averaging 85–90% in the thirteenth month, slip toward the 75–80% range.
Challenges
| Challenge | (~) % CAGR | Geographic Relevance | Mitigation Horizon |
|---|---|---|---|
| Actuarial and underwriting talent deficit | -1.0% | Global | Medium term (2–4 years) |
| Legacy core-system modernization lag | -0.8% | North America, Europe | Medium term (2–4 years) |
| Fragmented data infrastructure for pricing | -0.6% | Global | Medium term (2–4 years) |
| Rising cybersecurity and privacy compliance costs | -0.5% | European Union, North America | Medium term (2–4 years) |
| Cross-border reinsurance capital volatility | -0.3% | Global | Long term (≥4 years) |
Actuarial and underwriting talent deficit
The structural vulnerability stems from a widening gap between the pace of AI-driven underwriting adoption and the supply of qualified actuarial and data-science talent, with industry surveys indicating roughly 90% of insurers view workforce transformation as urgent while only about 25% have taken concrete remedial action.
Quantitatively, this friction subtracts an estimated -1.0 percentage point from the market’s achievable growth ceiling, as unfilled senior actuarial roles extend model validation cycles by 15–20 weeks and inflate contractor and recruitment costs by 20–30% above budgeted headcount expense.
The long-term corporate adjustment required is a shift toward outsourced actuarial-as-a-service arrangements and accelerated internal upskilling programs, which raises near-term operating expense ratios by 100–150 basis points but is necessary to sustain the underwriting automation pipeline that AI-first competitors are already scaling.
Opportunities
| Opportunity | (~) % Potential CAGR | Geographic Relevance | Execution Window |
|---|---|---|---|
| Embedded life insurance via fintech and e-commerce platforms | +1.8% | Global, led by Asia-Pacific | Medium term (2–4 years) |
| Living-benefits and wellness-linked modular products | +1.4% | North America, Western Europe | Medium term (2–4 years) |
| AI-personalized underwriting for underserved micro-segments | +1.1% | Global | Medium term (2–4 years) |
| Health-protection bundling in low-penetration Asian markets | +0.8% | Southeast Asia, South Asia | Long term (≥4 years) |
| M&A roll-up of independent distribution networks | +0.5% | Global | Long term (≥4 years) |
Embedded life insurance via fintech and e-commerce platforms
This is untapped white space rather than a current driver because embedded distribution through digital wallets, super-apps, and e-commerce checkout flows remains structurally distinct from the bancassurance and broker channels already counted in the baseline forecast.
If executed, this white space could add an estimated +1.8 percentage points on top of the 12.5% baseline CAGR, unlocked through micro-duration, low-ticket policies bundled at point of sale where customer acquisition cost per policy could fall by 40–50% relative to traditional agent-led sales given the absence of field commission overhead.
The unit-economic shift also implies margin expansion potential of roughly 300–400 basis points on operating margin as fixed distribution infrastructure costs are replaced by variable, revenue-share-based platform partnerships, making this a deliberate strategic build rather than an extension of today’s active growth trajectory.
Geopolitical Impact Analysis
Escalating geopolitical tensions, particularly the Middle East conflict and Strait of Hormuz disruptions, are reshaping cost structures and operational continuity across the life insurance value chain, even though the sector is service-based rather than materials-intensive.
The IEA reports that the closure of the Strait of Hormuz, through which nearly 20% of global oil supply transits, pushed Brent crude to an average of $117 per barrel in April 2026, $46/b higher than February, with implied volatility spiking to 106% on March 12 versus a pre-conflict baseline below 30%.
Concurrently, the WTO’s March 2026 Global Trade Outlook projects world merchandise trade volume growth decelerating from 4.6% in 2025 to just 1.9% in 2026, citing the Middle East conflict as a key downside risk that could further dampen growth if energy prices stay elevated.
On distribution, UNCTAD’s Review of Maritime Transport notes maritime trade growth slowing to 0.5% in 2025 before averaging 2% annually through 2030, with elevated freight volatility on risk-sensitive lanes complicating cross-border reinsurance treaty settlements and paper-based policy documentation logistics for multinational insurers.
The IMF’s April 2026 Global Financial Stability Report further flags elevated financial stability risks from the war, including cross-border portfolio flow sensitivity that pressures insurers’ asset-liability matching and capital adequacy amid heightened market turmoil.
Regional Analysis
North America stands as the undisputed leader of the global life insurance market, commanding a dominant 34.6% share and a market valuation of USD 1.49 trillion, underpinned by a mature financial ecosystem, high insurance penetration, strong regulatory frameworks, and widespread consumer awareness across the United States and Canada.
In contrast, Asia Pacific has emerged as the fastest-growing region in the global life insurance market, propelled by rapid economic development, expanding middle-class populations, rising disposable incomes, and improving insurance literacy across key economies such as China and India.
The region is witnessing accelerated premium growth, with China’s life insurance segment expanding at a CAGR of approximately 9.3% and India’s market projected to grow near 9.0% annually through 2029, positioning Asia Pacific to command an increasingly larger share of global written premiums.
Key Regions and Countries
North America
- US
- Canada
Europe
- Germany
- France
- The UK
- Spain
- Italy
- Rest of Europe
Asia Pacific
- China
- Japan
- South Korea
- India
- Australia
- Rest of APAC
Latin America
- Brazil
- Mexico
- Rest of Latin America
Middle East & Africa
- GCC
- South Africa
- Rest of MEA
Key Players Analysis
The global life insurance hierarchy is anchored by Asia-Pacific incumbents leveraging scale and demographic tailwinds. Ping An posted 2025 revenue of RMB1.28 trillion (~$180B) with Life & Health NBV rising to RMB15,574 million in Q1 2026 alone, up 20.8% YoY. China Life Insurance recorded total revenues of RMB616.1 billion (+16.5% YoY), net profit attributable to equity holders of RMB154.1 billion (+44.1%), and total assets of RMB7.59 trillion, underscoring dominant balance-sheet scale in the Chinese market.
AIA Group delivered a record Value of New Business (VONB) of $5,516 million (+15% YoY, CER), operating profit after tax of $7,136 million (+12% YoY per share), and EV Equity of $79.7 billion, reflecting pan-Asian distribution dominance, particularly Hong Kong (+28% VONB) and Mainland Chinese visitor demand.
Among Western majors, Allianz posted a record Group operating profit of €17.4 billion (+8.4%) on total business volume of €186.9 billion, while its Life/Health segment contributed strongly via PVNBP growth exceeding 16%.
MetLife generated FY2025 revenue of $77.1 billion (+8.6% YoY), but net income fell 24.9% to $3.2 billion, reflecting margin compression despite premium growth to $57.6 billion (+10%). Prudential Financial reported FY2025 total revenues of $60.8 billion (down 13.7% YoY) with net income attributable to shareholders of $3,576 million, versus AXA’s turnover of €115.4 billion (+5%), of which Life and Health premiums contributed €56.5 billion.
Manulife posted core earnings of $7.5 billion (+3% CER) and net income of $5.6 billion (+2% YoY) in 2025, with Asia core earnings up 16% to $2,184 million, signaling its pivot toward high-growth Asian distribution to offset flat North American segments.
Capital allocation increasingly favors shareholder returns and Asia-Pacific expansion over product R&D: AIA announced a fresh $1.7 billion share buyback alongside a 10% dividend hike, funded by underlying free surplus generation of $6,765 million (+11% per share). Allianz’s Property-Casualty segment drove incremental operating profit gains (+3.0% in Q4 to €4.3 billion), while its life insurers pursued VONB margin expansion rather than volume growth.
Top Key Players in the Market
- American International Group (AIG)
- Allianz SE
- AXA Group
- Enstar Group
- The Prudential Insurance Company of America
- MetLife, Inc
- Berkshire Hathaway Life
- China Life Insurance (Overseas) Company Ltd.
- Ping An Insurance (Group) Company of China, Ltd.
- China Ping An Insurance (Group) Co., Ltd.
- AIA Group Ltd.
- Assicurazioni Generali S.p.A.
Recent Developments
- In February 2026, Enstar Group acquired workers’ compensation and life-adjacent specialty carrier Accident Fund Holdings from Blue Cross Blue Shield of Michigan for $1.59 billion, a healthcare-affiliated mutual carve-out to a legacy run-off/specialty consolidator.
- In March 2026, Corebridge Financial and Equitable Holdings announced a merger valued at approximately $22 billion, combining two scaled retirement, life insurance, and wealth management platforms with roughly $1.5 trillion in combined assets under management and administration, one of the largest strategic combinations in the life and retirement insurance sector to date.
Report Scope
| Report Features | Description |
|---|---|
| Market Value (2025) | USD 4.3 Trillion |
| Forecast Revenue (2035) | USD 14.0 Trillion |
| CAGR (2026-2035) | 12.5% |
| Base Year for Estimation | 2025 |
| Historic Period | 2020-2024 |
| Forecast Period | 2026-2035 |
| Report Coverage | Revenue Forecast, Market Dynamics, Competitive Landscape, Recent Developments |
| Segments Covered | By Type (Term Life Insurance, Whole Life Insurance, Universal Life Insurance, Others), By Premium Range (Low, Medium, High), By Provider (Insurance Companies, Insurance Agents/Brokers, Insurtech Companies, Others) |
| Regional Analysis | North America – US, Canada; Europe – Germany, France, The UK, Spain, Italy, Rest of Europe; Asia Pacific – China, Japan, South Korea, India, Australia, Singapore, Rest of APAC; Latin America – Brazil, Mexico, Rest of Latin America; Middle East & Africa – GCC, South Africa, Rest of MEA |
| Competitive Landscape | American International Group (AIG), Allianz SE, AXA Group, The Prudential Insurance Company of America, MetLife, Inc., Berkshire Hathaway Life, China Life Insurance (Overseas) Company Ltd., Ping An Insurance (Group) Company of China, Ltd., China Ping An Insurance (Group) Co., Ltd., AIA Group Ltd., Assicurazioni Generali S.p.A. |
| Customization Scope | Customization for segments, region/country-level will be provided. Moreover, additional customization can be done based on the requirements. |
| Purchase Options | We have three licenses to opt for: Single User License, Multi-User License (Up to 5 Users), Corporate Use License (Unlimited Users and Printable PDF) |





































