Report Overview
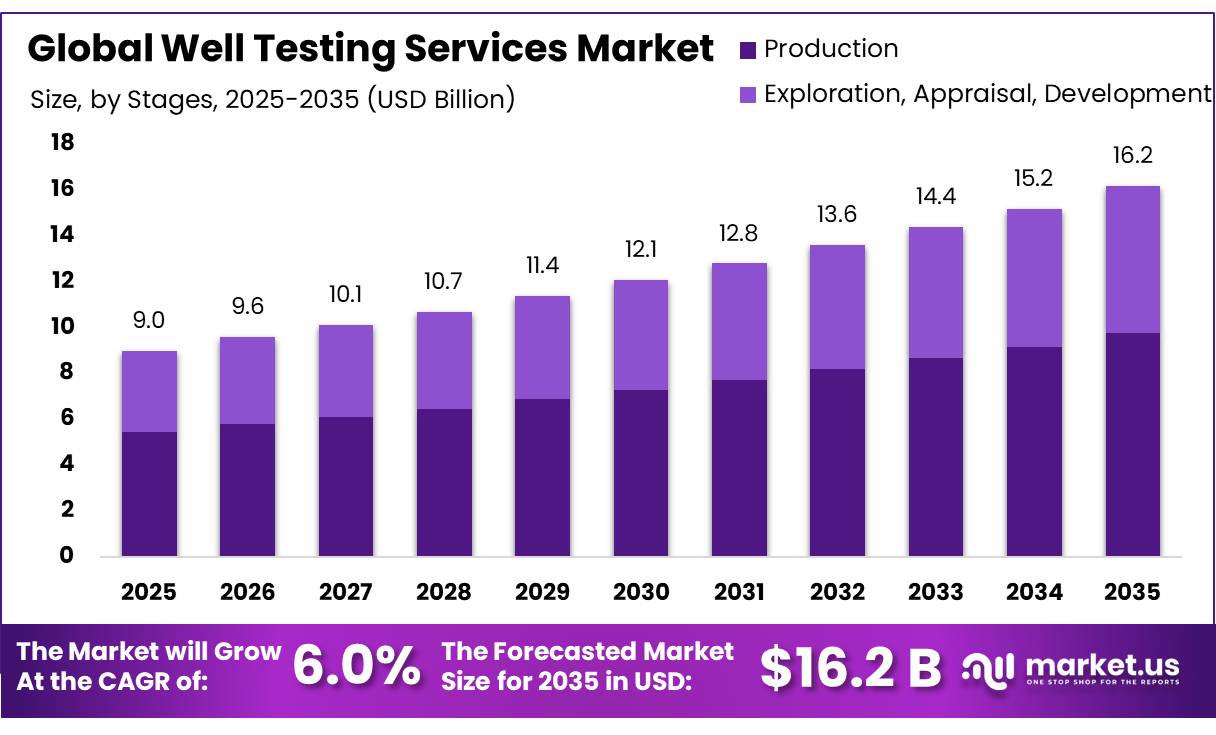
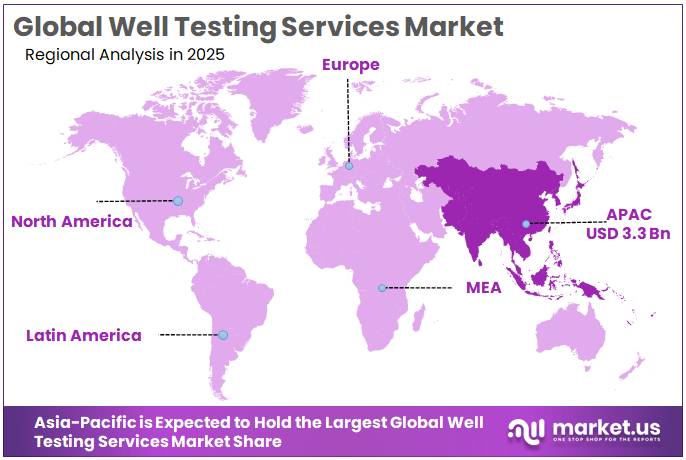
The Global Well Testing Services Market size is expected to be worth around USD 16.2 Billion by 2035, from USD 9.0 Billion in 2025, growing at a CAGR of 6.0% during the forecast period from 2026 to 2035. In 2025, Asia-Pacific held a dominant market position, capturing more than a 37.45% share, holding USD 3.3 Billion revenue.
Well testing services play an important role in the oil and gas industry by evaluating the performance, productivity, pressure, and flow characteristics of oil and gas wells. These services help operators understand the quantity and quality of hydrocarbons available from a reservoir before starting full-scale production. Well testing generally includes formation testing, drill stem testing, production testing, pressure testing, flowback testing, and fluid sampling.
The industrial scenario for well testing services is closely linked to global oil and natural gas production, exploration activities, and investments in upstream operations. According to the U.S. Energy Information Administration (EIA), U.S. crude oil production reached a record 13.2 million barrels per day in 2024, representing a 2% increase over 2023. The Permian region contributed approximately 48% of total U.S. crude oil production during 2024. Higher production volumes and continued drilling activities increase the requirement for reliable well evaluation, pressure monitoring, and production testing services.
- According to the EIA’s December 2025 report, the United States had 918,481 producing oil and natural gas wells in 2024. Horizontal wells accounted for 22% of producing wells, compared with 10% in 2014. These developments increase the need for accurate pressure measurements, flow-rate monitoring, reservoir evaluation, and production testing. Testing is particularly important in unconventional reservoirs, where production characteristics can change significantly after well completion.
Another major driving factor is the requirement to improve operational efficiency and reduce production-related risks. Oil and gas operators use well testing to identify reservoir pressure, water production, gas-to-oil ratios, and potential production problems. Reliable testing data helps companies select suitable production methods, reduce unnecessary operating costs, and improve recovery from existing wells. Offshore operations create additional demand because of complex subsea infrastructure, high operating costs, and strict safety requirements.
The U.S. Bureau of Safety and Environmental Enforcement (BSEE) has strengthened offshore well-control requirements through equipment testing, third-party reviews, and real-time monitoring provisions. Its regulations also require operators to submit blowout preventer test results within 72 hours when BSEE cannot witness the tests.
However, the industry faces challenges associated with fluctuating crude oil prices, high equipment costs, operational complexity, and changes in upstream investment. According to the International Energy Agency (IEA), global upstream oil and gas investment was expected to decline by approximately 4% in 2025, reaching slightly below USD 570 billion. Around 40% of this investment was directed towards slowing production declines at existing fields. This investment pattern highlights the importance of well testing, particularly for monitoring mature reservoirs, identifying production losses, and improving the performance of existing assets.
Key Takeaways
- Well Testing Services Market size is expected to be worth around USD 16.2 Billion by 2035, from USD 9.0 Billion in 2025, growing at a CAGR of 6.0%.
- Production held a dominant market position, capturing more than a 60.34% share.
- Real Time Well Testing held a dominant market position, capturing more than a 36.78% share.
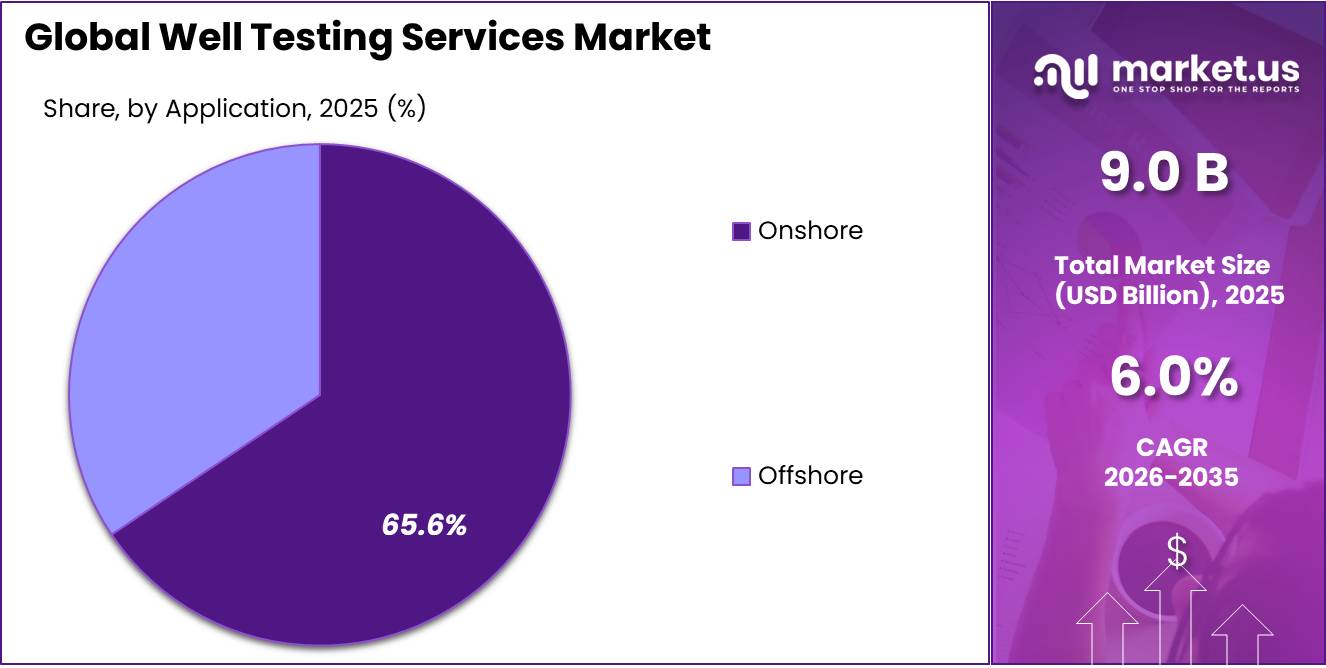
- Onshore held a dominant market position, capturing more than a 65.67% share.
- Horizontal Wells held a dominant market position, capturing more than an 82.34% share.
- Asia-Pacific held a leading position in the Well Testing Services market in 2025, accounting for 37.45% of the market, with a value of USD 3.3 billion.
By Stages Analysis
Production dominates the market due to the continuous need for well performance monitoring, flow measurement, and reservoir management.
In 2025, “Production” held a dominant market position, capturing more than a 60.34% share. This segment leads because well testing remains important throughout the production phase, when operators need to monitor oil and gas flow rates, reservoir pressure, water production, and overall well performance. Regular testing helps identify production problems, improve operating efficiency, and maintain consistent output from existing wells.
Government data further supports the importance of this segment. According to the U.S. Energy Information Administration (EIA), U.S. crude oil production reached a record 13.6 million barrels per day in 2025, increasing by 3% compared with the previous year. This continued production activity supports the need for well testing to monitor output and maintain production efficiency.
Exploration-stage well testing helps operators determine whether newly drilled wells contain commercially useful oil and gas reserves. Testing activities provide information about formation pressure, fluid composition, hydrocarbon flow, and reservoir characteristics. These results help companies evaluate the potential of unexplored areas and make informed decisions about further drilling investments.
By Services Analysis
Real Time Well Testing leads the market through faster data collection, continuous monitoring, and improved well performance assessment.
In 2025, “Real Time Well Testing” held a dominant market position, capturing more than a 36.78% share. This segment benefits from the growing need for accurate and timely information during oil and gas operations. Real-time well testing allows operators to monitor flow rates, pressure changes, fluid characteristics, and production conditions while testing activities are underway. It helps identify operational issues quickly, reduces delays in decision-making, and supports better reservoir management.
Government support also strengthens the adoption of this segment. The U.S. Bureau of Safety and Environmental Enforcement (BSEE), under 30 CFR §250.724, requires independent, automatic, and continuous real-time monitoring during specified offshore well operations, including subsea blowout preventer and high-pressure, high-temperature operations. The regulation covers blowout preventer systems, active fluid circulation, and downhole well conditions. It also requires the collected information to be transmitted during operations and monitored by qualified personnel.
According to the U.S. Bureau of Safety and Environmental Enforcement, offshore well monitoring requirements include recording and transmitting downhole conditions when downhole sensing systems are installed. The regulations also require continuous monitoring and the availability of collected data for regulatory review. These requirements highlight the importance of reliable downhole measurement technologies in offshore well operations.
By Application Analysis
Onshore dominates the market due to its wider operational presence, lower logistical complexity, and continuous well testing requirements.
In 2025, “Onshore” held a dominant market position, capturing more than a 65.67% share. The segment leads because a large number of oil and gas wells are located on land, creating consistent demand for well testing, pressure monitoring, flow measurement, and reservoir evaluation. Onshore testing operations are generally easier to access and manage compared with offshore projects, allowing service providers to deploy equipment and testing teams more efficiently.
Offshore well testing is essential for evaluating wells located in shallow-water and deepwater environments. It helps operators measure reservoir pressure, hydrocarbon flow rates, fluid composition, and well productivity under challenging operating conditions. Offshore projects require specialized testing equipment, pressure-control systems, subsea technologies, and experienced service teams to ensure reliable results. The segment benefits from deepwater exploration, new offshore field developments, and the need to improve production from existing offshore assets.
According to the U.S. Bureau of Safety and Environmental Enforcement (BSEE), offshore oil production from the U.S. Outer Continental Shelf reached a record 714 million barrels in 2025. This record production reflects continued activity across offshore oilfields and increases the importance of reliable well monitoring, production evaluation, and testing services. The agency also reported that deepwater projects played an important role in supporting offshore output.
By Well Type Analysis
Horizontal Wells dominate the market due to their wider reservoir contact, higher production potential, and growing use in unconventional oil and gas development.
In 2025, “Horizontal Wells” held a dominant market position, capturing more than an 82.34% share. The segment leads because horizontal drilling allows operators to access a larger portion of the reservoir compared with conventional vertical drilling. This increases the need for well testing to evaluate flow rates, reservoir pressure, fluid characteristics, and production performance.
Government data also highlights the growing importance of horizontal drilling. According to the U.S. Energy Information Administration (EIA), the United States recorded 10,881 horizontal and directional wells drilled in 2025, compared with 1,899 vertical wells. This difference reflects the strong use of horizontal and directional drilling in current oil and gas development. The increasing use of these wells supports demand for specialized testing services to measure reservoir pressure, evaluate production flow, and monitor well performance.
Vertical Wells are used in oil and gas operations where reservoirs can be accessed through a relatively straight wellbore. Well testing services help operators evaluate formation pressure, fluid properties, flow rates, and production potential in these wells. The segment remains relevant in conventional oilfields, mature reservoirs, and areas where geological conditions do not require horizontal drilling. Vertical well testing also supports production monitoring, reservoir assessment, and maintenance activities.
According to the U.S. Energy Information Administration, 1,899 vertical wells were drilled in the United States during 2025. This government data demonstrates the continued use of vertical drilling alongside horizontal and directional techniques.
Key Market Segments
By Stages
- Exploration, Appraisal, Development
- Production
By Services
- Downhole Well Testing
- Surface Well Testing
- Reservoir Sampling
- Real Time Well Testing
- Hydraulic Fracturing
- Method Testing
- Others
By Application
- Onshore
- Offshore
By Well Type
- Horizontal Wells
- Vertical Wells
Driver Analysis
Deepwater Gas Development Testing
Funded offshore gas developments create executable demand for pressure measurement, fluid characterization, cleanup and deliverability assessment before wells are connected to long-lived production infrastructure. SLB’s February 2026 Tangkulo award offshore Indonesia explicitly includes well testing within an integrated drilling and completion scope, with first gas targeted before the end of 2028; this provides direct evidence of contracted testing demand, unlike an offshore equipment award that merely implies future activity.
In an illustrative six-well development, assume each well requires a 12-day surface-testing campaign at USD 35,000.0/day plus USD 150,000.0 of attributable mobilization, specialist sampling and interpretation. Eligible revenue is USD 570,000.0 per well, or USD 3.42 million for the campaign, excluding rig time, subsea hardware and non-testing completion services. If testing identifies a deliverability shortfall before tie-in, the customer can reassess completion settings, operating envelopes or development sequencing; that decision value is not additional service revenue.
Commercially, suppliers benefit from repeat equipment configurations, local readiness and coordinated deployment across several wells, while operators increasingly procure testing within broader well-delivery packages. The +1.0 pp contribution assumes 20.0% revenue exposure grows 5.0 percentage points faster through development-related testing, excluding exploration and appraisal wells within the same integrated award and avoiding any assumption that its entire contract value belongs to this market.
Drivers Impact Analysis
| Driver | (~) % Impact on CAGR Forecast | Geographic Relevance | Impact Timeline |
|---|---|---|---|
| Deepwater gas development testing | +1.0 pp | Indonesia, Brazil, Guyana, West Africa | Medium term (2–4 years) |
| Exploration and appraisal campaigns | +0.8 pp | Norway, Brazil, Namibia, Southeast Asia | Short term (≤ 2 years) |
| Unconventional completion diagnostics | +0.7 pp | Saudi Arabia, US, Argentina | Short term (≤ 2 years) |
| Producing-well performance verification | +0.7 pp | North Sea, Middle East, US, West Africa | Short term (≤ 2 years) |
| Reduced-flaring testing packages | +0.6 pp | North Sea, Australia–NZ, North America | Medium term (2–4 years) |
Restraint Analysis
Deferred Drilling-Linked Procurement
Well testing tied to new wells cannot be sold on its original schedule when operators reduce drilling or postpone completions, creating a direct procurement constraint rather than an operational-efficiency problem. SLB’s January 2026 results reported a 10.0% year-on-year reduction in fourth-quarter Well Construction revenue, citing lower drilling activity across Mexico, Saudi Arabia, sub-Saharan Africa, North America and Asia.
In an illustrative 100-well annual customer program, postponing 20 wells removes 20 potential testing assignments from the original schedule. At a hypothetical 60.0% testing attachment rate and USD 150,000.0 per assignment, immediate procurement exposure is USD 1.8 million. If eight assignments subsequently execute within the forecast period, they should be treated as delayed revenue rather than permanently lost demand.
Providers face lower utilization and weaker pricing leverage where specialized equipment cannot be redeployed economically, while operators prioritize tests essential to near-term production. The −0.6 pp contribution assumes 20.0% revenue exposure grows 3.0 percentage points more slowly through net drilling-linked deferrals, excluding tests rejected independently on economics or consent grounds and allowing for recovery in funded gas and offshore programs already included among drivers.
Restraint Impact Analysis
| Restraint | (~) % Impact on CAGR Forecast | Geographic Relevance | Impact Timeline |
|---|---|---|---|
| Deferred drilling-linked procurement | −0.6 pp | US land, Mexico, Saudi Arabia, Africa | Short term (≤ 2 years) |
| Lower-revenue test substitution | −0.4 pp | Norway, UK, Brazil, US Gulf | Medium term (2–4 years) |
| Unapproved flow-test campaigns | −0.3 pp | UK core; sensitive offshore projects | Short term (≤ 2 years) |
| Permanent-metering displacement | −0.3 pp | North Sea, Gulf states, Brazil, US Gulf | Medium term (2–4 years) |
| Uneconomic discretionary diagnostics | −0.3 pp | US mature fields, North Sea, West Africa | Short term (≤ 2 years) |
Opportunity Analysis
CO₂-Storage Testing Programs
Geological CO₂ storage offers an adjacent testing market in which injectivity, pressure behaviour and containment evidence can support project qualification and recurring operating assessments. SLB’s 2025 carbon-storage offering explicitly includes pressure tests and falloff testing, demonstrating that the technical service category already exists; the opportunity is additional project penetration and multi-stage testing contracts beyond existing awarded work, not counting all carbon-storage investment as testing revenue.
EPA’s March 2026 Front Range draft-permit fact sheet identifies pressure-falloff testing at least once every five years under 40 CFR 146.90(f), while final Class VI permits also specify that more frequent testing may be required. This is not an annual testing mandate, and a draft permit does not establish that a well is operating.
In an illustrative portfolio of 20 newly qualified injection wells, a USD 250,000.0 initial injectivity-and-falloff package represents USD 5.0 million of one-time testing revenue. If those wells subsequently require USD 100,000.0 repeat packages on staggered five-year cycles, the long-run equivalent is USD 400,000.0 annually, although actual revenue arrives unevenly and depends on commissioning dates and approved plans. Providers need CO₂-compatible equipment, representative fluid data, defensible interpretation and clear boundaries between testing and broader monitoring. The +0.40 pp contribution assumes 8.0% revenue exposure grows 5.0 percentage points faster through additional storage applications, excluding permanent sensing, permit consultancy and tests already embedded in funded projects.
Opportunity Impact Analysis
| Opportunity | (~) % Potential CAGR Upside | Geographic Relevance | Execution Window |
|---|---|---|---|
| CO₂-storage testing programs | +0.40 pp | US Gulf Coast, North Sea, Canada | Medium term (2–4 years) |
| Geothermal reservoir qualification | +0.35 pp | US West, Germany, Indonesia, Kenya | Medium term (2–4 years) |
| Managed interpretation subscriptions | +0.25 pp | US, Middle East, North Sea | Short term (≤ 2 years) |
| Permanent-meter verification services | +0.20 pp | North Sea, Gulf states, Brazil | Short term (≤ 2 years) |
| Pooled marginal-well campaigns | +0.20 pp | US mature basins, UK, West Africa | Short term (≤ 2 years) |
Challenges Analysis
Multiphase Measurement Uncertainty
Changing gas fractions, water cuts, emulsions and slugging make reliable phase-rate measurement a continuing technical task rather than a simple matter of installing a separator or multiphase meter. SLB’s testing guidance explains that excessive flow can overwhelm separator capacity, cause liquid carryover or foaming, and require test design to account for retention time and pressure conditions; its measurement portfolio also addresses slug flows and emulsions without physical separation. These capabilities do not imply identical uncertainty across technologies or operating envelopes.
In an illustrative well producing 10,000 barrels/day of total liquid at 90.0% water cut, inferred oil production is 1,000 barrels/day. A one-percentage-point absolute water-cut error, with total liquid held constant, changes inferred oil rate by 100 barrels/day, or 10.0%; the calculation isolates water-cut sensitivity and excludes total-flow uncertainty. At an assumed USD 25.0/barrel contribution, that represents USD 2,500.0/day of decision-value uncertainty, not a direct service-provider revenue loss.
Providers need calibrated reference measurements, operating-envelope checks, synchronized pressure and temperature records, and explicit uncertainty reporting before claiming a meaningful production change. The −0.35 pp estimate assumes 14.0% revenue exposure grows 2.5 percentage points more slowly through repeat measurements, acceptance disputes and corrective analysis, excluding permanent-meter substitution and reservoir-model uncertainty assessed separately.
Challenges Impact Analysis
| Challenge | (~) % CAGR Friction Drag | Geographic Relevance | Mitigation Horizon |
|---|---|---|---|
| Multiphase measurement uncertainty | −0.35 pp | Middle East, North Sea, Brazil, US | Medium term (2–4 years) |
| HPHT and sour-service integrity | −0.30 pp | Gulf states, US Gulf, North Sea, Southeast Asia | Long term (≥ 4 years) |
| Representative fluid-sample recovery | −0.25 pp | Brazil, Guyana, West Africa, Middle East | Medium term (2–4 years) |
| Reservoir interpretation non-uniqueness | −0.25 pp | North Sea, US shale, Middle East, geothermal hubs | Long term (≥ 4 years) |
| Solids-driven equipment degradation | −0.25 pp | US shale, Saudi Arabia, Argentina, offshore sand producers | Medium term (2–4 years) |
Geopolitical Impact Analysis
Geopolitical Impact of Ongoing Wars on the Well Testing Services Market
Ongoing geopolitical conflicts, particularly the Russia-Ukraine war and tensions in the Middle East, are influencing the Well Testing Services market through changes in oil and gas supply, investment decisions, equipment costs, and operational risks. Disruptions to energy transportation routes and restrictions on energy trade have encouraged oil and gas producers to reassess production strategies and strengthen domestic energy supplies. These developments can increase demand for well testing as operators seek to improve output from existing fields and evaluate alternative production opportunities.
The International Energy Agency reported that disruptions to the Strait of Hormuz affected approximately 20% of global liquefied natural gas trade in 2025, creating additional pressure on energy supply chains. According to the U.S. Energy Information Administration, Brent crude prices averaged USD 124 per barrel in October 2026, reflecting supply concerns and shipping disruptions.
Regional Insights
Asia-Pacific – Dominating Region
Asia-Pacific held a leading position in the Well Testing Services market in 2025, accounting for 37.45% of the market, with a value of USD 3.3 billion. The region’s position is supported by continued oil and gas exploration, expanding offshore activities, and the development of mature and unconventional fields.
China, Australia, Indonesia, and Malaysia contribute to regional demand through upstream exploration, drilling, and production operations. Well testing services are increasingly important for evaluating reservoir pressure, measuring production flow, and improving recovery from existing wells. According to the International Energy Agency, Asia-Pacific remains an important centre for global energy demand, encouraging investment in domestic oil and gas supply and supporting the need for reliable well evaluation and production monitoring.
The Middle East and Africa represent an important growth opportunity for well testing services, supported by investments in oil and gas exploration, offshore developments, and production expansion. The International Energy Agency (IEA) reported that the Middle East accounted for approximately 30% of global oil production and 17% of global natural gas production in 2024.
Regional oil and gas supply investment was expected to reach USD 130 billion in 2025, representing around 15% of global investment. Saudi Arabia’s upstream oil and gas investment was projected at approximately USD 40 billion in 2025. These investments support demand for reservoir evaluation, pressure testing, flow measurement, and production monitoring services.
Key Regions and Countries Insights
- North America
- US
- Canada
- Europe
- Germany
- France
- The UK
- Spain
- Italy
- Rest of Europe
- Asia Pacific
- China
- Japan
- South Korea
- India
- Australia
- Rest of APAC
- Latin America
- Brazil
- Mexico
- Rest of Latin America
- Middle East & Africa
- GCC
- South Africa
- Rest of MEA
Key Players Analysis
SLB maintains a strong position in the well testing services industry through its reservoir evaluation, well construction, production, and intervention capabilities. In 2025, the company reported total revenue of USD 35.7 billion. Its Well Construction division generated USD 11.86 billion, while Reservoir Performance contributed USD 6.82 billion. These businesses support well evaluation, pressure measurement, formation testing, and production optimization. Its digital technologies and integrated oilfield solutions strengthen its ability to serve complex onshore and offshore projects.
Halliburton is an important participant in the well testing services market, offering solutions across drilling, completion, production, and reservoir evaluation activities. In 2025, the company generated total revenue of USD 22.2 billion. Its Completion and Production division recorded an operating margin of 17%, while Drilling and Evaluation achieved 15%. The company continues to focus on advanced completion technologies, well intervention, and production efficiency to support oil and gas operators across international markets.
Baker Hughes provides oilfield services and equipment for exploration, well construction, completion, intervention, and production operations. In 2025, the company reported total revenue of USD 27.73 billion, including USD 14.32 billion from its Oilfield Services and Equipment division. Its Well Construction business generated USD 3.65 billion, while Completions, Intervention, and Measurements contributed USD 3.75 billion. These capabilities support well evaluation, pressure management, and production monitoring across onshore and offshore operations.
Top Key Players Outlook
- Schlumberger Limited
- Halliburton Company
- Baker Hughes Company
- Weatherford International Plc
- Expro Group Holdings NV
- TETRA Technologies Inc.
- SGS SA
- Core Laboratories
- CETCO Energy Services
- Petrofac Ltd
- Other Key Players
Recent Developments
- In June 2026, Weatherford announced a definitive agreement to acquire NCS Multistage, with expected annual cost synergies of at least USD 15 million; the acquisition was completed in September 2026, expanding its well completion and unconventional resource technology portfolio.
- In May 2026, Expro Group Holdings N.V announced an agreement to acquire Norway-based Enhanced Drilling for approximately NOK 2 billion (USD 215 million), adding managed pressure drilling technology and approximately USD 275 million in order backlog.
Report Scope
| Report Features | Description |
|---|---|
| Market Value (2025) | USD 9.0 Bn |
| Forecast Revenue (2035) | USD 16.2 Bn |
| CAGR (2026-2035) | 6.0% |
| Base Year for Estimation | 2025 |
| Historic Period | 2020-2024 |
| Forecast Period | 2026-2035 |
| Report Coverage | Revenue Forecast, Market Dynamics, Competitive Landscape, Recent Developments |
| Segments Covered | By Stages (Exploration, Appraisal, Development, Production), By Services (Downhole Well Testing, Surface Well Testing, Reservoir Sampling, Real Time Well Testing, Hydraulic Fracturing, Method Testing, Others), By Application (Onshore, Offshore), By Well Type (Horizontal Wells, Vertical Wells) |
| Regional Analysis | North America – US, Canada; Europe – Germany, France, The UK, Spain, Italy, Rest of Europe; Asia Pacific – China, Japan, South Korea, India, Australia, Singapore, Rest of APAC; Latin America – Brazil, Mexico, Rest of Latin America; Middle East & Africa – GCC, South Africa, Rest of MEA |
| Competitive Landscape | Schlumberger Limited, Halliburton Company, Baker Hughes Company, Weatherford International Plc, Expro Group Holdings NV, TETRA Technologies Inc., SGS SA, Core Laboratories, CETCO Energy Services, Petrofac Ltd, Other Key Players |
| Customization Scope | Customization for segments, region/country-level will be provided. Moreover, additional customization can be done based on the requirements. |
| Purchase Options | We have three licenses to opt for: Single User License, Multi-User License (Up to 5 Users), Corporate Use License (Unlimited User and Printable PDF) |