


Report Overview
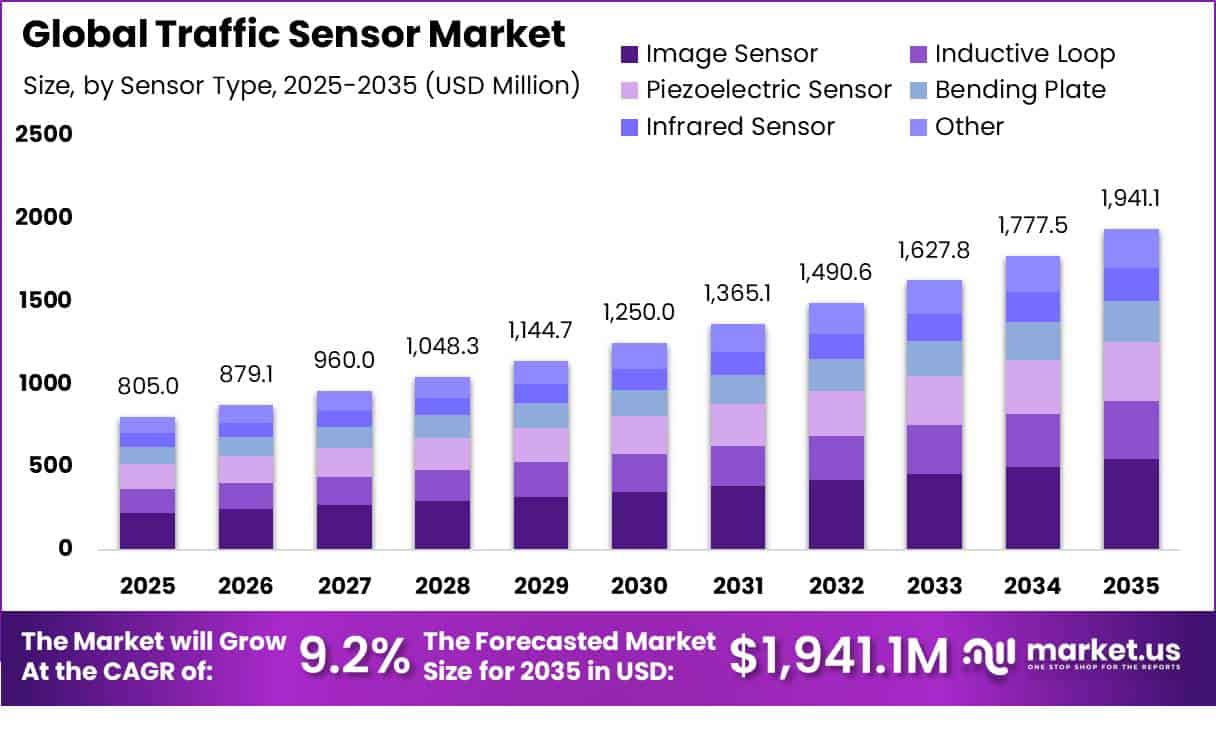
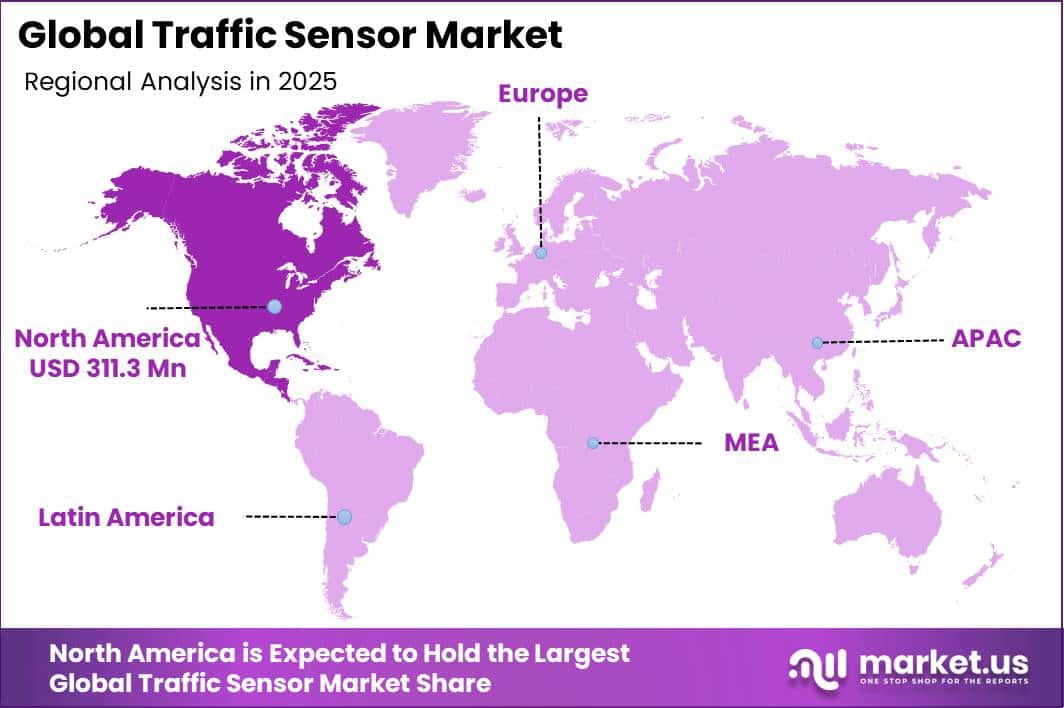
In 2025, the Global Traffic Sensor Market was valued at USD 805.0 million. The market is projected to grow at a CAGR of 9.2% during 2026–2035, reaching approximately USD 1,941.1 million by 2035. North America dominated the global market in 2025, accounting for more than 38.2% of the total market share and generating approximately USD 311.3 million in revenue.
The U.S. Department of Transportation’s SMART program has funded more than 122 Stage 1 grants and several Stage 2 awards, including USD 85 million for eight Stage 2 implementation projects. These investments support connected signals, traffic monitoring systems, sensor networks, and other smart mobility solutions, creating a strong deployment base for traffic sensors across the region.
Key Takeaway
- Traffic Sensor Market is valued at USD 805.0 million in 2025, projected to reach USD 1,941.1 million by 2035 at a CAGR of 9.2%.
- Image Sensor is the leading sensor type with a 28.3% share, driven by camera-based freeway monitoring.
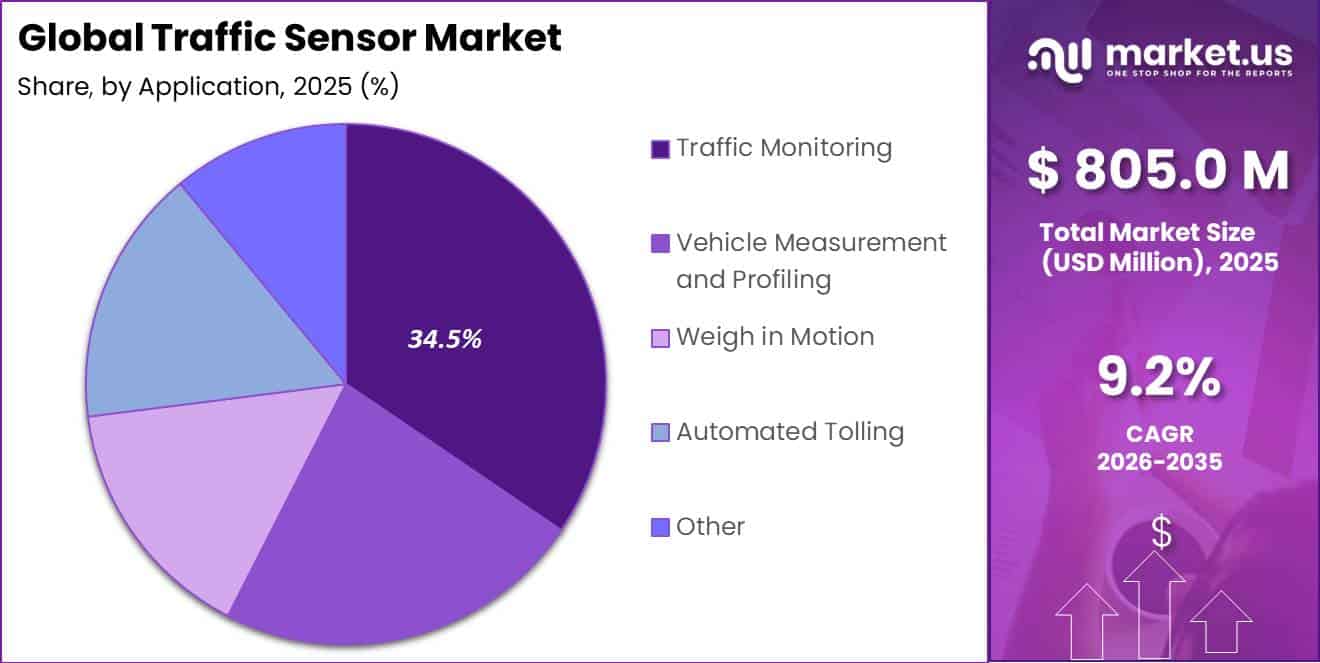
- Traffic Monitoring is the leading application segment with a 34.5% share amid rising congestion and road-safety concerns.
- North America led the market in 2025 with a 38.2% share and around USD 311.3 million in revenue.
Market Statistics and Data Insights
- Global vehicle volumes continue to increase the amount of traffic that road authorities need to detect and manage. OICA reported that global vehicle production reached 96.4 million units in 2025, increasing 3.9%, while global vehicle sales reached 99.8 million units. This supports higher requirements for vehicle counting, intersection monitoring, speed detection, and congestion sensing.
- Urbanization is expanding the number of people moving through dense road networks. The World Bank reports that around 4.7 billion people now live in urban areas, representing approximately 58% of the global population, while nearly 7 in 10 people are expected to live in urban areas by 2050. Denser cities create a stronger operational need for traffic counting, adaptive signals, congestion monitoring, and incident-detection systems.
- Road-safety pressure remains high even as fatalities decline. NHTSA estimated 36,640 U.S. traffic deaths in 2025, a 6.7% decline from 2024, with a fatality rate of 1.10 deaths per 100 million vehicle-miles traveled. Persistent fatalities support investment in real-time incident detection, pedestrian sensing, speed monitoring, and intelligent intersections.
- U.S. public-sector technology funding shows direct institutional demand for sensing infrastructure. USDOT reports 122 Stage 1 projects, 7 active Stage 2 projects, and USD 85 million of Stage 2 implementation funding under the SMART program, covering technologies including sensor-based infrastructure, connected vehicles, and smart traffic signals.
- Semiconductor tariffs create direct hardware-cost exposure for traffic sensor manufacturers. USTR increased the Section 301 tariff rate on covered Chinese semiconductors to 50% in 2025, while certain critical minerals carry 25% rates and selected Chinese electric-vehicle products carry tariffs of up to 100%. Traffic cameras, radar units, controllers, and connected roadside equipment depend heavily on electronic components.
- Critical-material concentration increases sourcing risk for optical and electronic sensor components. USGS reports that China accounted for approximately 99% of world gallium production, 82% of natural graphite production, and 71% of mined rare-earth production in its latest country data. This concentration increases supply-chain exposure for advanced electronics, photonics, radar, and imaging components.
- V2X infrastructure offers a measurable sensor-expansion opportunity. An Oakland County USDOT-backed prototype covering 5 intersections and 10 vehicles cost about USD 550,000, while a planned scaled deployment covering 112 intersections and 1,000 vehicles was estimated at USD 9.27 million. The architecture includes cameras, edge devices, roadside units, and vulnerable-road-user detection.
- Climate-resilient road monitoring represents another emerging sensor niche. USDOT awarded Louisville approximately USD 1.9 million for a sensor-based system designed to monitor real-time flooding and congestion. At the same time, Washington’s Rainier Valley safety project received USD 2.0 million, and Idaho’s Yellowstone Corridor smart-signal project received about USD 1.3 million.
- Large ITS contracts are increasingly combining detection hardware with long-term traffic-management software. Q-Free’s U.S. Transurban deployment covers more than 65 miles, includes 349 detection points, and operates under a 12-year deployment and maintenance contract for its Kinetic Mobility ATMS.
- Smart-highway deployments are shifting toward dense multi-sensor corridor coverage. China’s Sichuan vehicle-road cooperation program reported 340 km of demonstration corridors, including 85 km of full-perception coverage, while another smart-highway deployment uses sensing poles at approximately 800-meter intervals.
- TomTom’s 2026 Traffic Index, based on more than 2.2 trillion miles driven during 2025, found that global congestion increased by 5 percentage points, from 20% to 25%. This provides direct behavioral evidence that road networks are becoming harder to manage and that continuous traffic measurement is increasingly important.
By Sensor Type
The Image Sensor segment leads the Traffic Sensor Market with a 28.3% share, supported by the growing use of camera-based systems for freeway monitoring and incident detection. The U.S. Federal Highway Administration’s 2023 Freeway Management Survey reported that CCTV use for incident detection reached 85% among responding agencies.
Among historically surveyed agencies, adoption increased from 90% in 2020 to 98% in 2023, showing strong preference for visual monitoring technologies. In comparison, radar and microwave detection systems recorded 69% adoption, while inductive loop systems stood at 57%.
Image sensors are widely preferred because a single camera feed can support accident verification, license-plate recognition, lane-change monitoring, weather observation, and stalled-vehicle detection. The trend is also visible in China, where the Ministry of Transport reported that around 18,000 kilometers of expressways had been upgraded to smart-highway standards by the end of 2025.
By Application
The Traffic Monitoring application segment leads the Traffic Sensor Market with a 34.5% share, supported by growing traffic congestion and road-safety concerns. According to the Texas A&M Transportation Institute’s 2025 Urban Mobility Report, U.S. commuters lost an average of 63 hours to traffic delays in 2024, the highest level recorded, creating an estimated annual cost of USD 269 billion from wasted time and fuel.
Road safety is another major factor supporting continuous traffic monitoring. The World Health Organization’s Global Status Report on Road Safety 2023 recorded around 1.1 million road deaths worldwide each year, while road injuries remained the leading cause of death among people aged 5–29.
In Europe, the EU CARE database recorded 19,934 road fatalities in 2024, further highlighting the need for stronger road monitoring systems. Traffic sensors provide continuous information on vehicle movement, congestion, incidents, and road conditions.
Key Market Segments
By Sensor Type
- Image Sensor
- Inductive Loop
- Piezoelectric Sensor
- Bending Plate
- Infrared Sensor
- Other
By Application
- Traffic Monitoring
- Vehicle Measurement and Profiling
- Weigh in Motion
- Automated Tolling
- Other
Geopolitical Impact Analysis
Rising US-China trade tensions are increasing cost pressure across the traffic sensor supply chain, mainly because these systems depend on semiconductors, imaging chips, and rare-earth-based components. Effective January 1, 2025, the US increased Section 301 tariffs on Chinese semiconductors and integrated circuits from 25% to 50%, raising the cost of processors and image-sensor chips used in radar, LiDAR, and camera-based traffic sensors.
Supply pressure has also increased from China’s export controls. Through 2025, unwrought gallium exports fell to near zero, contributing to a 365% rise in European gallium prices. Wrought germanium exports declined by 60%, while prices increased by around 400%. Antimony exports also dropped sharply, with prices rising by 437%.
China controls roughly 90% of global rare-earth refining and processing capacity, making these restrictions important for sensor manufacturers that depend on gallium, germanium, and related materials for infrared and photonic components.
Tariff pressure has remained volatile. By mid-2026, the US average effective import tariff had risen to 12.4%, while intermediate goods, including many sensor sub-components, faced an average rate of 15.8%, compared with a 2% low earlier in the year. China’s expanded export-control framework now covers more than twenty elements, with approvals handled case by case.
Regional Analysis
North America dominated the global Traffic Sensor Market in 2025, accounting for a 38.2% share and generating around USD 311.3 million in revenue. The region’s strong position is supported by well-developed intelligent transportation infrastructure and continued federal investment.
Programs such as the US Department of Transportation’s SMART grants are supporting real-time traffic monitoring, connected signals, and sensor-based mobility systems across major cities, creating steady demand for upgrades and replacement of traffic sensing equipment.
Asia Pacific is emerging as the fastest-growing region due to large government-backed smart-city and highway modernization programs. India’s Smart Cities Mission has a total outlay of INR 1.6 lakh crore, or about USD 19.6 billion, and has installed more than 83,000 CCTV surveillance cameras.
Intelligent Traffic Management Systems have also been deployed across 35 cities, supported by Integrated Command and Control Centres. During FY25, the program completed 177 smart-mobility projects, including vehicle counters, ANPR cameras, and red-light violation sensors. China has also upgraded roughly 18,000 kilometers of expressways to smart-highway standards with closely placed cameras and sensor units.
In addition, the World Bank expects East Asia’s urban population share to increase from 62% in 2024 to 69% by 2050, while nearly 200 million people moved to cities during the previous decade. These factors are accelerating traffic sensor adoption across Asia Pacific.
Key Regions and Countries
North America
- US
- Canada
Europe
- Germany
- France
- The UK
- Spain
- Italy
- Rest of Europe
Asia Pacific
- China
- Japan
- South Korea
- India
- Australia
- Rest of APAC
Latin America
- Brazil
- Mexico
- Rest of Latin America
Middle East & Africa
- GCC
- South Africa
- Rest of MEA
Market Dynamics
Drivers
| Driver | (~) % CAGR | Geographic Relevance | Impact Timeline |
|---|---|---|---|
| Road-safety sensing mandates | +2.1% | Global | Short term (2 years or less) |
| Smart-corridor investment | +1.7% | North America and Europe | Medium term (2 to 4 years) |
| Urban signal modernization | +1.4% | Asia Pacific | Medium term (2 to 4 years) |
| Automated tolling rollout | +1.0% | Europe and Latin America | Short term (2 years or less) |
| Edge-video analytics adoption | +0.8% | Global | Medium term (2 to 4 years) |
Road-safety sensing mandates
Road-safety policies are turning traffic sensors from optional city upgrades into essential tools for high-risk roads. The US National Highway Traffic Safety Administration estimated 39,345 road deaths in 2024, despite a 3.8% decline from the previous year. The US Department of Transportation also provided USD 100 million annually from fiscal 2022 to 2026 through the SMART Grants program to support advanced mobility technologies.
In Europe, ITS policies prioritize data services on major road networks carrying more than 8,500 vehicles per day and urban roads handling over 7,000 vehicles per day. These measures are increasing demand for incident detection, video analytics, adaptive traffic control, and sensor-health monitoring, potentially adding around +2.1% to the market’s 9.2% baseline CAGR.
Restraints
| Restraint | (~) % CAGR | Geographic Relevance | Impact Timeline |
|---|---|---|---|
| Legacy-road retrofit funding gap | -1.8% | Global | Medium term (2 to 4 years) |
| Public procurement delays | -1.3% | Europe and North America | Short term (2 years or less) |
| Camera-data privacy limits | -1.0% | Europe | Short term (2 years or less) |
| Municipal budget constraints | -0.9% | Emerging markets | Medium term (2 to 4 years) |
| Utility-permit bottlenecks | -0.6% | Urban markets | Short term (2 years or less) |
Legacy-road retrofit funding gap
Retrofitting active roads remains a major restraint because installation often requires civil works, lane closures, utility coordination, and lengthy public approvals. The US Department of Transportation’s SMART program provides USD 100 million per year from fiscal 2022 to 2026, but this funding is still limited compared with the scale of road-network modernization required.
The European Commission’s ITS framework extends phased deployment targets to 2028, showing that many authorities must upgrade traffic infrastructure gradually. Older controller cabinets and back-office systems also increase integration costs. These factors can delay tenders, slow equipment purchases, and reduce near-term deployment volumes, creating an estimated -1.8% drag on forecast CAGR.
Challenges
| Challenge | (~) % CAGR | Geographic Relevance | Mitigation Horizon |
|---|---|---|---|
| Semiconductor supply exposure | -1.5% | Global | Medium term (2 to 4 years) |
| Multi-vendor data interoperability | -1.2% | Global | Medium term (2 to 4 years) |
| Cybersecurity lifecycle management | -1.0% | Global | Short term (2 years or less) |
| Field-calibration labor shortage | -0.7% | North America and Europe | Medium term (2 to 4 years) |
| Extreme-weather asset failures | -0.5% | Global | Long term (4 years or more) |
Semiconductor supply exposure
Traffic-sensor manufacturing remains dependent on semiconductors, image processors, radar modules, and optical materials sourced through global supply chains. The US maintained a 50% Section 301 tariff on covered Chinese semiconductor imports from 2025, increasing sourcing costs and supply risks for manufacturers using Chinese-origin components.
NIST’s 2025 IoT guidance adds requirements for secure updates, device identification, and vulnerability management. To reduce disruption, manufacturers are increasing dual sourcing and safety inventories, but these measures can raise working-capital needs and slow product qualification, creating an estimated -1.5% drag on the market’s maximum growth potential.
Opportunities
| Opportunity | (~) % CAGR | Geographic Relevance | Execution Window |
|---|---|---|---|
| Sensor-data subscription platforms | +2.0% | Global | Medium term (2 to 4 years) |
| Vulnerable-road-user sensing | +1.5% | Europe and Asia Pacific | Medium term (2 to 4 years) |
| Freight-corridor digital twins | +1.3% | North America and Europe | Long term (4 years or more) |
| Vehicle-to-infrastructure integration | +1.1% | North America and Asia Pacific | Long term (4 years or more) |
| Regional service roll-ups | +0.8% | Global | Short term (2 years or less) |
Sensor-data subscription platforms
Sensor-data subscriptions represent a future growth opportunity, as many transport agencies still depend on one-time capital budgets for traffic equipment. The European Commission’s ITS framework is encouraging dynamic transport data to be shared through National Access Points, while US connected-vehicle deployments are increasing the need for continuous roadside data exchange.
Recurring service models could improve revenue stability for traffic sensor vendors. Siemens Mobility reported service revenue of EUR 2,205 million in fiscal 2025, up from EUR 1,991 million in fiscal 2024. By offering congestion analytics, device-health monitoring, and predictive maintenance as subscriptions, vendors could potentially improve gross margins by 10% to 20% and add around +2.0% upside to market CAGR at scale.
Key Players Analysis
The Traffic Sensor Market has a two-tier competitive structure, with large diversified technology companies leading the market and specialized sensor and intelligent transportation system providers serving focused applications. Siemens AG remains one of the major players, with its Mobility division generating EUR 12,444 million in FY2025, representing 9% year-over-year comparable growth.
The division also maintained an order backlog of around EUR 52 billion, supporting continued investment in intelligent traffic management and detection technologies. TE Connectivity reported USD 911 million in FY2025 sensor segment net sales, equal to around 10% of its Transportation Solutions revenue.
This was lower than USD 1,112 million in FY2023, while the company’s total net sales reached USD 17,262 million. SICK AG recorded group revenue growth of 6.5% to approximately EUR 1,850 million in FY2025, while its EBIT margin stood at 3.0%, equal to about EUR 54.7 million.
Tier-2 companies such as SWARCO AG, Q-Free ASA, International Road Dynamics, and Kistler Group compete in specialized areas including weigh-in-motion sensors, tolling systems, and variable message signs, generally holding low single-digit shares individually. Teledyne’s Digital Imaging segment generated USD 1.5 billion in Q3 2025 sales, increasing 6.7% year-over-year, supported partly by demand for infrared imaging and monitoring components.
Top Key Players in the Market
- International Road Dynamics, Inc.
- Kistler Group
- Flir Systems, Inc.
- TE Connectivity Ltd
- SWARCO AG
- Q-Free ASA
- SICK AG
- Raytheon Company
- Siemens AG
Recent Developments
- In 2026, SWARCO expanded its UK traffic-infrastructure operations through the acquisition of 100% of Hi-Way Services Ltd. The transaction became effective on 30 June 2026. Hi-Way Services employs around 60 people and generates approximately £10.8 million in annual revenue.
- In 2025, Q-Free secured a three-year contract to supply 2.4 million tolling transponders to Via Verde Portugal. Announced on 26 May 2025, the multi-million-dollar/euro agreement covers interoperable devices designed for use across Portugal, Spain, and France.
Report Scope
| Report Features | Description |
|---|---|
| Market Value (2025) | USD 805.0 Million |
| Forecast Revenue (2035) | USD 1,941.1 Million |
| CAGR (2026-2035) | 9.2% |
| Base Year for Estimation | 2025 |
| Historic Period | 2020-2024 |
| Forecast Period | 2026-2035 |
| Report Coverage | Revenue Forecast, Market Dynamics, Competitive Landscape, Recent Developments |
| Segments Covered | By Sensor Type: (Image Sensor, Inductive Loop, Piezoelectric Sensor, Bending Plate, Infrared Sensor, Other); By Application: (Traffic Monitoring, Vehicle Measurement and Profiling, Weigh in Motion, Automated Tolling, Other) |
| Regional Analysis | North America – US, Canada; Europe – Germany, France, The UK, Spain, Italy, Rest of Europe; Asia Pacific – China, Japan, South Korea, India, Australia, Singapore, Rest of APAC; Latin America – Brazil, Mexico, Rest of Latin America; Middle East & Africa – GCC, South Africa, Rest of MEA |
| Competitive Landscape | International Road Dynamics, Inc., Kistler Group, Flir Systems, Inc., TE Connectivity Ltd, SWARCO AG, Q-Free ASA, SICK AG, Raytheon Company, Siemens AG |
| Customization Scope | Customization for segments and region/country-level will be provided. Moreover, additional customization can be done based on the requirements. |
| Purchase Options | We have three licenses to opt for: Single User License, Multi-User License (Up to 5 Users), Corporate Use License (Unlimited Users and Printable PDF) |





























