


Market Overview
Global pH Meter Market size is expected to be worth around US$ 2.6 Billion by 2035 from US$ 1.8 Billion in 2025, growing at a CAGR of 3.9% during the forecast period from 2026 to 2035. In 2025, North America led the market, achieving over 34.5% share with a revenue of US$ 0.62 Billion.
The pH meter market is experiencing steady growth due to increasing demand for accurate measurement of acidity and alkalinity across water quality monitoring, healthcare, pharmaceuticals, environmental testing, and industrial applications.
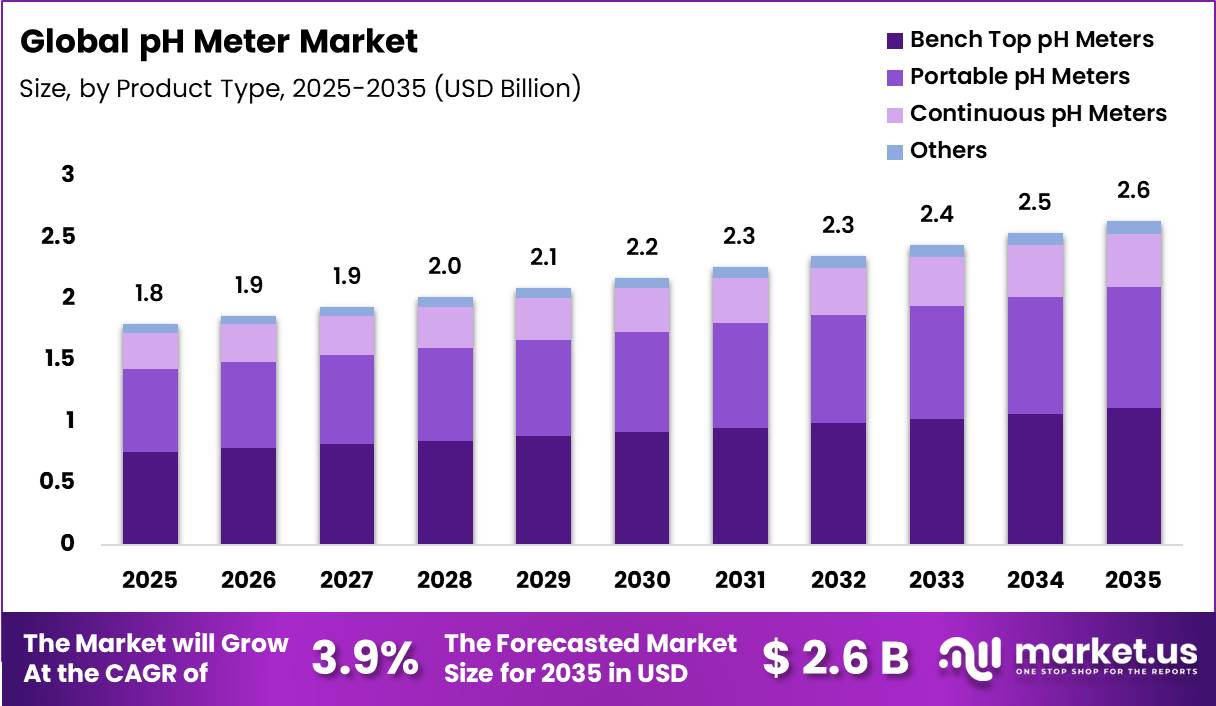
A pH meter is an analytical instrument used to determine hydrogen ion concentration in liquids, making it essential for maintaining safety and quality standards in laboratories, clinical testing, and field analysis. According to the World Health Organization (WHO), safe drinking water should typically maintain a pH range of 6.5 to 8.5 to ensure public health safety and prevent corrosion in water distribution systems.
In India, demand for pH meters is rising due to growing concerns over water pollution and stricter environmental monitoring regulations. Government agencies such as the Central Pollution Control Board (CPCB) emphasize continuous monitoring of industrial effluents and wastewater to ensure compliance with discharge standards.
This has increased adoption across municipal corporations, laboratories, and industrial facilities. Technological advancements are further supporting market growth. Modern digital pH meters now offer high precision levels up to ±0.01 pH units, along with features such as automatic temperature compensation and digital calibration. Portable pH meters are also gaining traction due to their ease of use in field testing and environmental surveys.
Additionally, regulatory frameworks such as India’s Medical Device Rules, 2017 support the use of analytical instruments in healthcare and laboratory diagnostics. Increasing applications in clinical research, pharmaceutical quality control, and environmental safety testing continue to strengthen the adoption of pH meters globally, making them a critical tool for quality assurance and regulatory compliance.
Key Takeaways
- Market Size: Global pH Meter Market size is expected to be worth around US$ 2.6 Billion by 2035 from US$ 1.8 Billion in 2025.
- Market Share: The market is growing at a CAGR of 3.9% during the forecast period from 2026 to 2035.
- Product Type: Benchtop pH Meters dominate the product type segment with a 42.1% market share in 2025.
- Technology: The Digital pH Meters segment dominated the pH Meter Market, accounting for 82.1% of total market revenue in 2025.
- End Use: Pharmaceuticals and Biotechnology dominate the end-use segment with a 36.4% market share in 2025.
- Regional Analysis: In 2025, North America led the market, achieving over 34.5% share with a revenue of US$ 0.62 Billion.
Product Type Analysis
Benchtop Systems Lead Market Demand Driven by Precision Laboratory Applications.
Product Type segmentation in the pH meter market is led by Benchtop pH Meters, which dominate with a 42.1% market share in 2025. This dominance is attributed to their high accuracy, stability, and suitability for laboratory-based applications across research institutes, quality control labs, and industrial testing environments.
Their ability to deliver precise measurements in controlled settings makes them the preferred choice in pharmaceuticals, chemicals, and academic laboratories. Portable pH Meters account for 37.6% share, driven by increasing field-based testing needs in environmental monitoring, agriculture, and water quality assessment.
These devices are widely adopted due to their compact design, ease of use, and real-time measurement capabilities. Continuous pH Meters hold a 16.4% share and are primarily used in industrial process monitoring, wastewater treatment plants, and chemical manufacturing units where uninterrupted pH tracking is essential.
The Others segment, with 3.9% share, includes specialized and hybrid devices catering to niche applications. Overall, the segmentation reflects a balanced demand between laboratory precision and field mobility, with growing emphasis on automation and real-time monitoring solutions across industries and regulatory compliance needs in various sectors globally.
Technology Analysis
Digital pH Meters Dominate with Strong Shift Toward Automated and Connected Testing Systems.
Technology segmentation in the pH meter market is overwhelmingly dominated by Digital pH Meters, which account for 82.1% market share in 2025. Their dominance is driven by superior accuracy, automated calibration features, user-friendly interfaces, and integration with modern laboratory and industrial systems.
Digital meters are widely used across pharmaceuticals, environmental monitoring, food safety testing, and chemical industries due to their reliability and ability to provide fast, precise readings with minimal human error. The increasing adoption of smart laboratories and IoT-enabled analytical instruments further strengthens the demand for digital solutions.
In contrast, Analog pH Meters hold a 17.9% share and are primarily utilized in educational institutions, basic field testing, and cost-sensitive applications where simplicity and affordability are key considerations. Although they lack advanced automation, analog devices remain relevant in regions with limited access to advanced laboratory infrastructure.
Overall, the technology segmentation reflects a strong transition toward digitization, supported by advancements in sensor technology, data logging capabilities, and regulatory requirements for accurate and traceable pH measurement across critical applications and industrial compliance standards worldwide ensuring consistent quality assurance practices in operations globally.
End Use Analysis
Pharmaceuticals and Biotechnology Remain the Core Demand Driver Due to Strict Quality and Regulatory Needs.
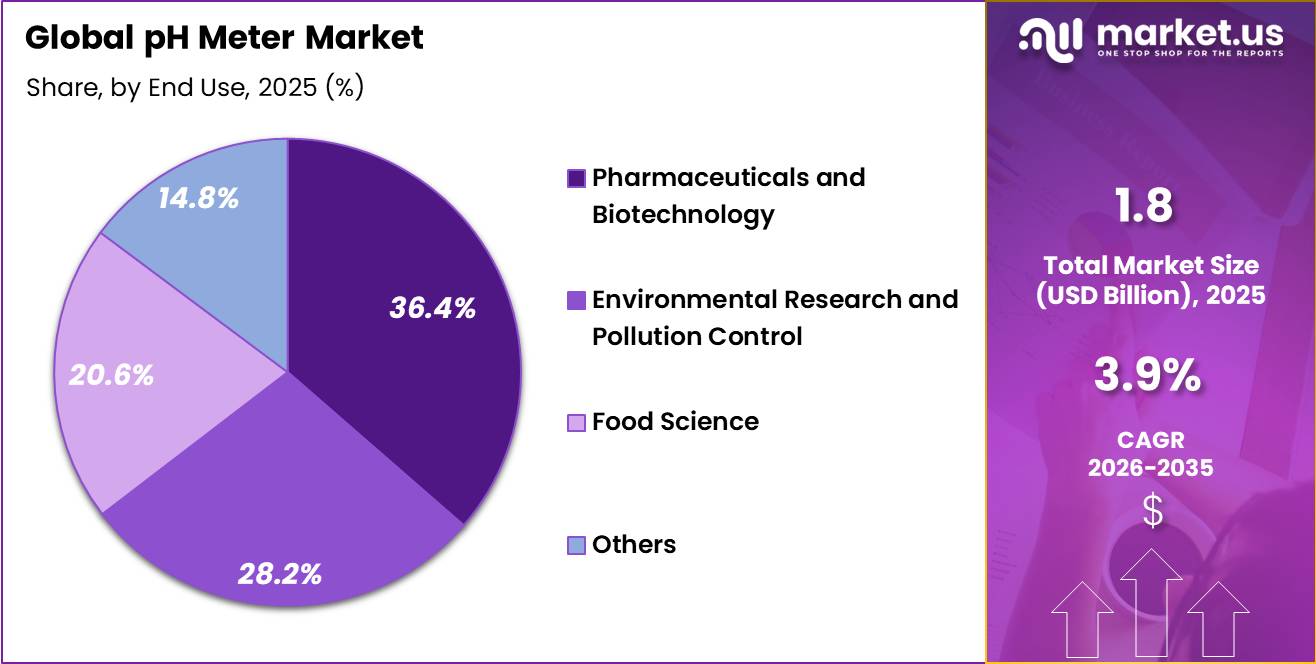
End Use segmentation in the pH meter market is led by Pharmaceuticals and Biotechnology, which dominate with a 36.4% market share in 2025. This dominance is driven by stringent regulatory standards, high precision requirements, and extensive use of pH meters in drug formulation, quality control, and bioprocess monitoring. These sectors rely heavily on accurate pH measurement to ensure product safety, stability, and compliance with global healthcare guidelines.
Environmental Research and Pollution Control represents a significant growing segment, supported by increasing government initiatives for water quality monitoring, wastewater treatment, and ecological conservation programs.
Food Science is another expanding application area, where pH meters are essential for quality assurance, fermentation control, and food safety compliance across processing industries.The Others segment includes academic research, chemical manufacturing, and industrial applications that collectively contribute to steady demand.
Overall, the segmentation highlights strong demand from regulated industries, with pharmaceuticals and biotechnology maintaining leadership due to critical precision needs, while environmental and food-related applications continue to expand steadily across global markets driven by innovation and regulatory compliance requirements across emerging and developed regions worldwide demand growth.
Key Market Segments
Product Type
- Bench Top pH Meters
- Portable pH Meters
- Continuous pH Meters
- Others
Technology
- Digital pH Meters
- Analog pH Meters
End Use
- Pharmaceuticals and Biotechnology
- Environmental Research and Pollution Control
- Food Science
- Others
Opportunity
PFAS-era water analytics bundles.
This is an opportunity rather than a baseline driver because the upside does not come from routine pH testing already embedded in municipal and industrial water workflows; it comes from vendors repositioning pH meters as part of bundled compliance architectures sold alongside conductivity, ORP, sampler integration, cloud logging, and service contracts to utilities reacting to tighter contaminant oversight.
The U.S. Environmental Protection Agency PFAS rule requires public water systems to complete initial monitoring by 2027 under the current framework, while parallel 2026 proposals could reshape compliance timing, which creates a 24- to 60-month procurement window for instrument vendors that can convert a single-point pH sale into a broader water-quality node sale.
In Europe, the updated Urban Wastewater Treatment Directive adds phased micropollutant-removal obligations through 2033, 2039, and 2045, with producer-responsibility economics pushing treatment plants and industrial dischargers toward more continuous chemistry monitoring, even though pH itself is not the headline pollutant.
The white space is therefore cross-sell intensity: if manufacturers lift attachment rates from roughly one standalone meter per site to 1.3 to 1.5 instrument nodes per site through bundled systems, average revenue per installation could expand 30% to 55%, service gross margin could rise 400 to 700 basis points, and the addressable compliance-linked submarket could plausibly add around 1.6 percentage points to category CAGR versus a replacement-led baseline.
| Opportunity | (~) % Potential CAGR Upside | Geographic Relevance | Execution Window |
|---|---|---|---|
| PFAS-era water analytics bundles | +1.6% | North America core, EU | Short term (≤ 2 years) |
| Inline food-process digitization | +1.3% | North America, EU, APAC manufacturing hubs | Short term (≤ 2 years) |
| Pharma compliance-to-data platforms | +1.1% | US, EU, India, Japan | Medium term (2-4 years) |
| Precision ag multi-parameter probes | +1.8% | APAC emerging markets, LATAM, North America | Medium term (2-4 years) |
| Semiconductor UPW monitoring tier | +1.0% | East Asia, US, EU advanced fabs | Medium term (2-4 years) |
| Recurring-calibration service models | +1.4% | Global, strongest in fragmented distributor markets | Long term (≥ 4 years) |
Driver
PFAS and drinking-water compliance monitoring demand.
The strongest near-term commercial trigger is the conversion of drinking-water monitoring from a routine chemistry task into a compliance-intensive workflow linked to PFAS remediation and broader source-water surveillance.
The U.S. Environmental Protection Agency finalized enforceable PFAS limits in April 2024, including 4 ppt limits for PFOA and PFOS, with public water systems given three years to complete initial monitoring and five years overall to implement solutions where exceedances occur; larger systems must begin with four quarterly samples, while smaller systems conduct biannual sampling.
Although pH meters do not detect PFAS directly, treatment trains for activated carbon, ion exchange, membrane systems, and downstream corrosion-control programs all require frequent pH verification, which raises meter replacement rates, buffer consumption, probe turnover, and demand for portable and benchtop instruments across municipal labs and contractor networks.
The economic effect is less about one-time instrument placement and more about installed-base densification: each new compliance workflow typically needs field screening, laboratory confirmation support, and post-treatment water balancing, which expands unit demand per site and favors multi-parameter and data-logging capable platforms in North America first, with similar spill-over logic in advanced EU and APAC utility markets.
| Driver | (~) % Impact on CAGR Forecast | Geographic Relevance | Impact Timeline |
|---|---|---|---|
| PFAS and drinking-water compliance monitoring demand | +1.4% | North America core, EU spill-over, developed APAC utilities | Short term (≤ 2 years) |
| Wastewater upgrade cycle and continuous water-quality digitization | +1.1% | EU core, North America, China, India urban corridors | Medium term (2-4 years) |
| Pharma and bioprocess QC tightening under compendial pH control | +0.9% | North America, EU, India, East Asia pharma hubs | Short term (≤ 2 years) |
| Semiconductor and electronics ultrapure-water capacity additions | +0.8% | East Asia core, U.S., India emerging nodes | Medium term (2-4 years) |
| Shift toward smart meters, ISFET probes, and lower-maintenance platforms | +1.0% | North America, EU, Japan, South Korea, premium APAC labs | Short term (≤ 2 years) |
| Battery recycling and hydrometallurgical process scaling | +0.6% | China core, EU, North America, India emerging | Medium term (2-4 years) |
Challenge
Certified Buffer Dependence.
pH measurement accuracy is only as strong as calibration chemistry, and USGS guidance is explicit that buffers should be NIST-traceable, temperature-corrected, never reused, and discarded at expiry because carbon dioxide absorption, evaporation, or contamination can materially shift readings; the same protocol also requires 15 to 30 minutes of thermal equilibration in many field settings.
That means the market carries a hidden consumables-and-process friction in which each meter deployed into regulated or field environments pulls recurring purchases of pH 4, 7, and 10 buffers, storage solutions, and verification standards while also extending workflow cycle time; across distributed testing networks this can translate into 3% to 6% annual operating-cost inflation and 5 to 12 lost labor hours per instrument per quarter from calibration, range checks, and buffer-management discipline.
Companies therefore have to redesign around sealed single-use sachets, auto-recognition buffers, local buffer packaging footprints, and higher software prompts for expiry governance, because demand remains intact but expansion into decentralized and low-skill testing environments is slowed by the chemistry chain that must accompany every installed device
| Challenge | (~) % CAGR Friction Drag | Geographic Relevance | Mitigation Horizon |
|---|---|---|---|
| Electrode Drift Management | -0.8% | North America core, EU regulatory hubs, APAC industrial labs | Medium term (2-4 years) |
| Certified Buffer Dependence | -0.7% | EU regulatory hubs, North America core, emerging APAC testing corridors | Short term (≤ 2 years) |
| Lab Talent Availability | -1.0% | North America core, Western Europe, India and Southeast Asia lab clusters | Long term (≥ 4 years) |
| Electronics Lead-Time Volatility | -0.9% | APAC manufacturing corridors, North America OEM channels, EU instrument assemblers | Medium term (2-4 years) |
| Low-Conductivity Accuracy Limits | -0.6% | Nordic water monitoring, North America environmental testing, high-purity industrial systems in East Asia | Long term (≥ 4 years) |
| Compliance Data Integration Gaps | -0.8% | Pharma and food testing hubs in North America, EU, India, East Asia | Medium term (2-4 years) |
Restraints
Volatile electrode & glass inputs.
The most immediate structural drag on the pH meter market in 2026 is the volatility in specialty glass, platinum-group metals, and reference electrolyte chemicals that together account for roughly 30–40% of probe bill-of-materials value and 15–20% of total meter system cost, with multiple vendors reporting 20–35% price swings on high-alkali glass tubing and platinum wire since 2022 due to gas-intensive glass melting and constrained mining output.
This feeds directly into margin compression for premium lab and process probes, as OEMs are often locked into annual price agreements with key pharma and water-utility customers, forcing them to absorb 300–500 basis points of gross margin erosion or defer specification upgrades such as double-junction designs or low-drift glass formulations.
Simultaneously, batch yields on complex glass membranes remain highly sensitive to furnace downtime and energy spikes, so a 5–7% scrap rate can quickly become 10–12% in stress scenarios, adding 3–4 weeks of effective lead time on specialty electrodes for aggressive media.
Because environmental and pharma customers typically run risk-averse dual-sourcing strategies, any instability in electrode supply pushes them to extend meter replacement cycles from 5–7 years towards 7–9 years and to refurbish existing probes rather than upgrade to higher-ASP smart electrodes, trimming unit growth by an estimated 150–250 basis points annually in heavily regulated segments.
Strategically, this volatility discourages greenfield capacity additions for probe manufacturing in Europe and North America—where energy and labor are structurally higher—and shifts incremental CapEx to Asia, but with a 18–24 month lag on new furnaces and tooling, which keeps supply structurally tight through at least 2027–2028 and sustains a negative impact on realized market CAGR of around 1.8 percentage points versus a stable-input scenario.
| Restraint | (~) % Impact on CAGR Forecast | Geographic Relevance | Impact Timeline |
|---|---|---|---|
| Volatile electrode & glass inputs | -1.8% | EU, North America, East Asia | Short–Medium term |
| Electronics lead-time & MCU tightness | -1.5% | North America, EU, APAC export hubs | Short term |
| Tightening water regulations & compliance costs | -1.2% | EU, North America, Selected Asia | Medium–Long term |
| Calibration standards & service burden | -0.9% | Global labs, pharma, food & beverage | Short–Medium term |
| Low-cost commoditization from China & India | -1.3% | Global, esp. EM & price-sensitive OEMs | Medium term |
| Fragmented replacement & aftermarket channels | -0.8% | Latin America, MEA, SEA | Long term |
Regional Analysis
North America Leads the pH Meter Market Driven by Strong Industrial and Research Demand.
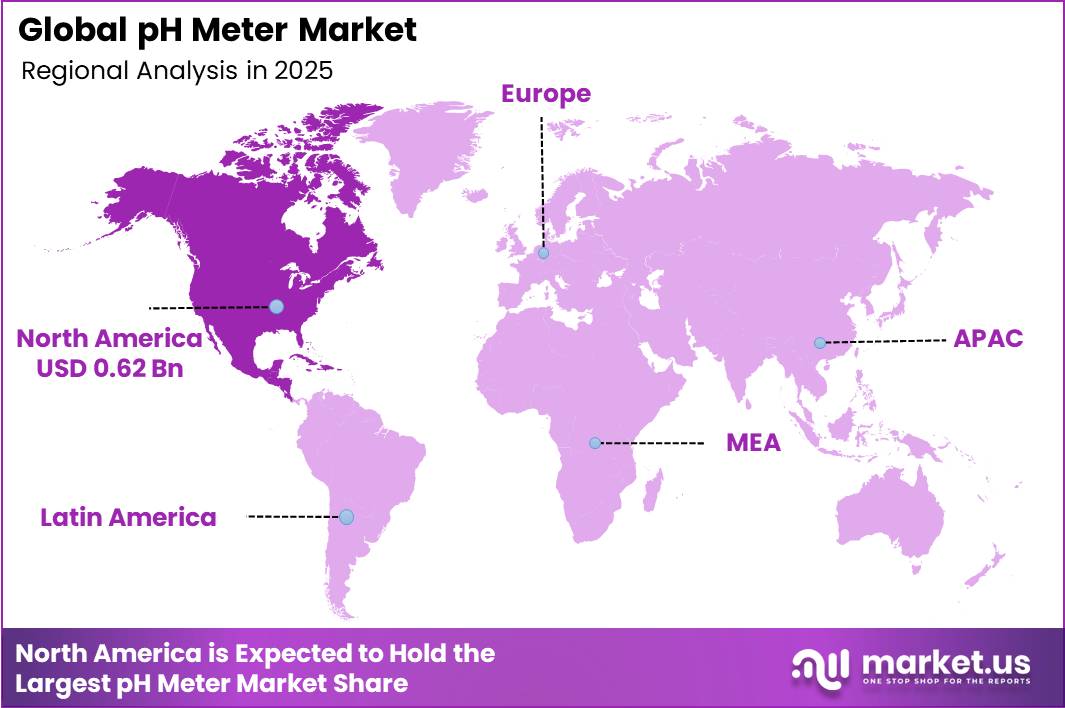
North America dominated the pH Meter Market in 2025, accounting for over 34.5% share with a revenue of approximately US$ 0.62 Billion. This leadership is primarily driven by the strong presence of advanced laboratory infrastructure, high adoption of precision analytical instruments, and stringent regulatory standards across pharmaceuticals, biotechnology, and environmental testing industries.
The region’s well-established research ecosystem and continuous investments in quality control and R&D further strengthen its market position. In addition, widespread use of pH meters in water quality monitoring and food safety applications continues to support sustained demand.
Europe follows as a significant market, supported by strict environmental regulations and increasing emphasis on sustainable industrial processes. The region benefits from strong adoption in chemical manufacturing, academic research, and healthcare diagnostics.
Meanwhile, Asia-Pacific is emerging as the fastest-growing market, driven by rapid industrialization, expanding pharmaceutical production, and increasing government initiatives for water quality management. Growing investments in laboratory infrastructure across countries such as India and China are further accelerating demand.
Other regions, including Latin America and the Middle East & Africa, are witnessing gradual growth due to improving healthcare systems and expanding environmental monitoring programs. However, their adoption levels remain comparatively lower.
Overall, the market shows a balanced regional expansion, with North America maintaining dominance while Asia-Pacific continues to gain strong momentum through industrial and research-driven demand.
Key Regions and Countries
North America
- The US
- Canada
Europe
- Germany
- France
- The U.K.
- Italy
- Spain
- Russia & CIS
- Rest of Europe
Asia Pacific
- China
- India
- Japan
- South Korea
- ASEAN
- Australia & New Zealand
- Rest of Asia Pacific
Middle East & Africa
- GCC
- South Africa
- Rest of Middle East & Africa
Latin America
- Brazil
- Mexico
- Rest of Latin America
Key Player Analysis
The pH Meter Market is moderately consolidated, with a strong presence of global analytical instrument manufacturers competing alongside niche and regional suppliers. Competitive dynamics are shaped by rising demand for high-precision, regulatory-compliant, and easy-to-integrate measurement solutions across pharmaceuticals, environmental testing, chemical processing, and academic research.
Continuous innovation in sensor accuracy, digital calibration, and smart connectivity is intensifying competition, while companies are increasingly focusing on end-to-end laboratory solutions rather than standalone instruments.
Key players such as Danaher Corporation, Thermo Fisher Scientific Inc., Agilent Technologies, METTLER TOLEDO, Merck KGaA, Hanna Instruments, Metrohm AG, and PerkinElmer Inc. strengthen their positions through heavy R&D investment, advanced product portfolios, and global distribution networks. These companies emphasize workflow integration, automation, and cloud-enabled data management to improve laboratory efficiency and compliance.
Specialized and emerging participants, including Surtex Instruments Limited and Mölnlycke Health Care AB, compete by offering application-specific and cost-efficient solutions, particularly for targeted industrial and healthcare uses.
Meanwhile, Other Key Players contribute to fragmented demand fulfillment in regional and price-sensitive markets. Across the ecosystem, strategic partnerships, continuous product innovation, and integration of smart laboratory technologies are key competitive strategies shaping long-term market evolution.
Top Key Players
- Danaher Corporation
- Hanna Instruments
- Thermo Fisher Scientific Inc.
- PerkinElmer Inc.
- Agilent Technologies
- Metrohm AG
- METTLER TOLEDO
- Merck KGaA
- Surtex Instruments Limited
- Mölnlycke Health Care AB
- Other Key Players
Recent Developments
- In February 2025, Thermo Fisher Scientific expanded its laboratory instrumentation portfolio by launching the Orion Pro Star electrochemistry bench meter series, featuring a 7-inch touchscreen, automated calibration logs, and GLP data compliance support with seamless data export functionality via USB or direct computer connection.
- In September 2025, Mettler-Toledo introduced its next-generation NineFocus benchtop meter system featuring InLab DES smart digital sensors, designed to improve measurement stability, reduce downtime, and enhance calibration tracking with integrated temperature probes and modular onboard diagnostics.
- In June 2025, Hanna Instruments launched the HI98594 portable multiparameter meter, capable of simultaneous pH, conductivity, optical dissolved oxygen, and turbidity measurement with Bluetooth 5.0 wireless data logging functionality.
Report Scope
| Report Features | Description |
|---|---|
| Market Value (2025) | US$ 1.8 Billion |
| Forecast Revenue (2035) | US$ 2.6 Billion |
| CAGR (2026-2035) | 3.9% |
| Base Year for Estimation | 2025 |
| Historic Period | 2020-2024 |
| Forecast Period | 2026-2035 |
| Report Coverage | Revenue Forecast, Market Dynamics, Competitive Landscape, Recent Developments |
| Segments Covered | By Product Type (Bench Top pH Meters, Portable pH Meters, Continuous pH Meters, Others), By Technology (Digital pH Meters, Analog pH Meters), By End Use (Pharmaceuticals and Biotechnology, Environmental Research and Pollution Control, Food Science, Others) |
| Regional Analysis | North America – The US, Canada; Europe – Germany, France, U.K., Italy, Spain, Russia & CIS, Rest of Europe; Asia Pacific – China, India, Japan, South Korea, ASEAN, Australia & New Zealand, Rest of Asia Pacific; Middle East & Africa – GCC, South Africa, Rest of Middle East & Africa; Latin America – Brazil, Mexico, Rest of Latin America |
| Competitive Landscape | Danaher Corporation, Hanna Instruments, Thermo Fisher Scientific Inc., PerkinElmer Inc., Agilent Technologies, Metrohm AG, METTLER TOLEDO, Merck KGaA, Surtex Instruments Limited, Mölnlycke Health Care AB, Other Key Players |
| Customization Scope | Customization for segments, region/country-level will be provided. Moreover, additional customization can be done based on the requirements. |
| Purchase Options | We have three licenses to opt for: Single User License, Multi-User License (Up to 5 Users), Corporate Use License (Unlimited User and Printable PDF) |





































