Report Overview
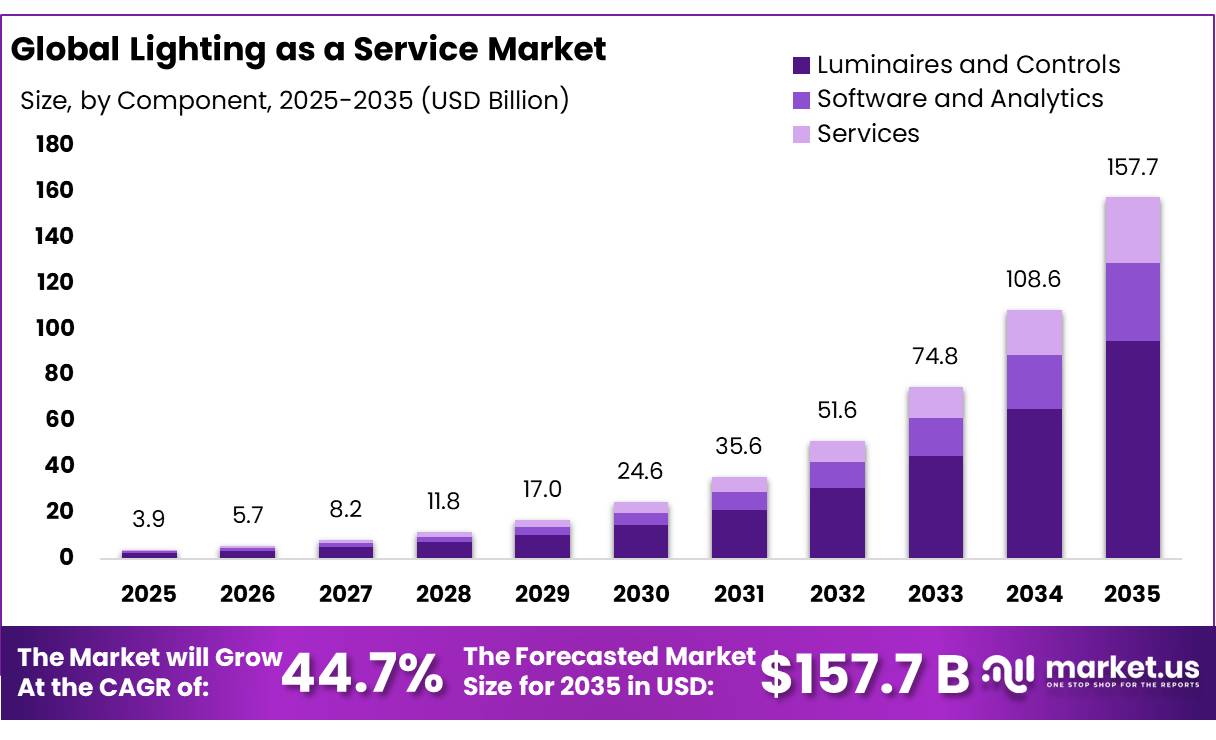
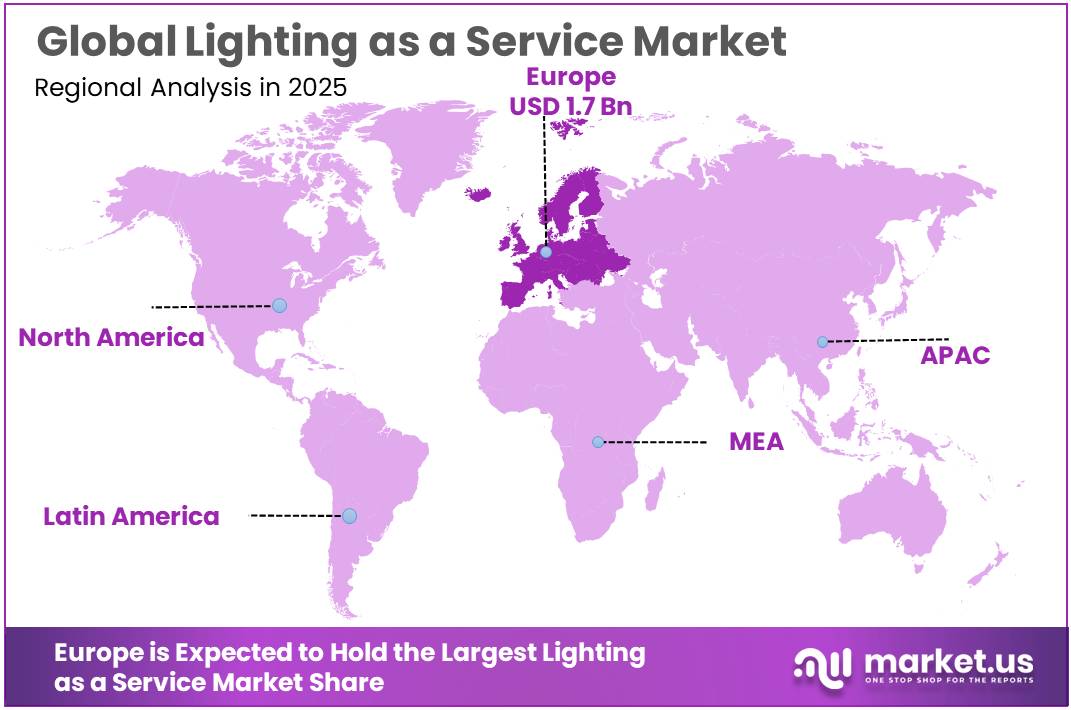
The Global Lighting as a Service Market size is expected to be worth around USD 157.7 Billion by 2035, from USD 3.9 Billion in 2025, growing at a CAGR of 44.7% during the forecast period from 2026 to 2035. In 2025, Europe held a dominant market position, capturing more than a 44.12% share, holding USD 1.7 Billion revenue.
Lighting as a Service (LaaS) is an emerging business model in the lighting industry that provides lighting equipment, installation, maintenance, monitoring, and technology upgrades through subscription-based or performance-based agreements. Unlike traditional lighting systems, where customers purchase and manage equipment, LaaS allows businesses to pay a regular service fee while the provider manages the lighting infrastructure. The model generally includes light-emitting diode (LED) fixtures, intelligent lighting controls, sensors, energy monitoring software, and maintenance services.
- According to the International Energy Agency (IEA), lighting in buildings and outdoor applications accounted for approximately 2,200 terawatt-hours (TWh) of global electricity demand in 2024, representing around 8% of total global electricity demand. This creates opportunities for service providers to replace conventional lighting installations with energy-efficient LED systems and connected lighting solutions.
The growing adoption of LED technology is an important factor supporting the Lighting as a Service industry. Modern LED products sold globally deliver an average efficiency of approximately 100 lumens per watt, while premium professional products can exceed 200 lumens per watt. These improvements help businesses achieve higher lighting output with lower electricity consumption. The U.S. Department of Energy (DOE) also identifies LED technology as an important solution for commercial and industrial energy savings. Its efficiency requirements include minimum efficacy levels of 140 lumens per watt for selected commercial LED luminaires and 175 lumens per watt for industrial high-bay luminaires.
- Government energy-efficiency initiatives are further supporting industry development. In the United States, the Department of Energy has projected that LED lighting could deliver more than 569 TWh of annual energy savings by 2035 if its advanced solid-state lighting research and development objectives are achieved. The department also highlights connected lighting systems and intelligent controls as important contributors to future electricity savings.
Technological advancements are creating additional opportunities through the integration of Internet of Things (IoT) technology, occupancy sensors, daylight harvesting, wireless controls, and cloud-based monitoring platforms. These technologies allow lighting systems to automatically adjust brightness according to occupancy, available natural light, and operational schedules. In addition, connected lighting infrastructure can support predictive maintenance by identifying equipment performance issues before major failures occur. Integration with building management systems also creates opportunities for service providers to deliver broader facility-management solutions.
Key Takeaways
- Lighting as a Service Market size is expected to be worth around USD 157.7 Billion by 2035, from USD 3.9 Billion in 2025, growing at a CAGR of 44.7%.
- Luminaires and Controls held a dominant market position, capturing more than a 60.21% share.
- Indoor held a dominant market position, capturing more than a 68.45% share.
- Retrofit Projects held a dominant market position, capturing more than a 73.21% share.
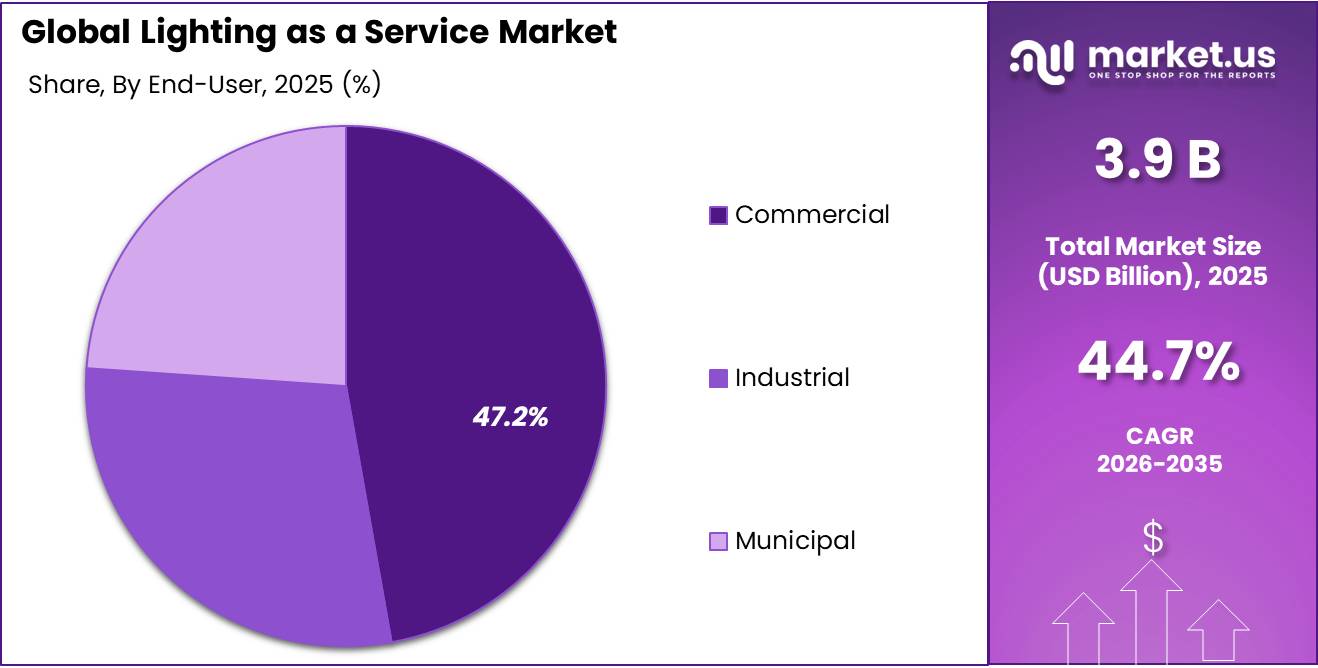
- Commercial held a dominant market position, capturing more than a 47.21% share.
- Europe held the leading position in the Lighting as a Service market in 2025, accounting for 44.12% of the global market, valued at USD 1.7 billion.
By Component Analysis
Luminaires and Controls dominate through energy-efficient lighting installations and intelligent lighting management.
In 2025, “Luminaires and Controls” held a dominant market position, capturing more than a 60.21% share. This segment leads because luminaires and lighting controls form the main physical infrastructure of Lighting as a Service solutions. Commercial buildings, warehouses, manufacturing facilities, hospitals, and retail establishments increasingly use LED luminaires, occupancy sensors, dimming systems, and automated controls to reduce electricity consumption and improve lighting performance.
In 2025, demand was also supported by the replacement of conventional lighting installations with energy-efficient LED fixtures and connected control systems. The U.S. Department of Energy identifies LED technology as an important energy-saving solution for commercial and industrial applications. Its research also highlights the role of advanced lighting controls in improving overall system efficiency.
In 2025, demand for this component was supported by the growing adoption of smart buildings, Internet of Things (IoT) technology, and connected lighting systems. Businesses increasingly use analytics platforms to track electricity usage, identify inefficient lighting operations, and adjust illumination according to occupancy and daylight conditions.
According to the U.S. Department of Energy, lighting control strategies generated an estimated 6.188 terawatt-hours (TWh) of annual electricity savings in the United States, including 5.601 TWh from commercial applications. This demonstrates the importance of intelligent monitoring and control technologies. Software and Analytics are also gaining importance as service providers use digital platforms to improve energy reporting, maintenance planning, and overall lighting system performance.
By Installation Type Analysis
Indoor lighting dominates due to its widespread use across commercial buildings, offices, and industrial facilities.
In 2025, “Indoor” held a dominant market position, capturing more than a 68.45% share. The segment leads because indoor lighting is essential across offices, shopping centres, hospitals, educational institutions, warehouses, hotels, and manufacturing facilities. Businesses increasingly adopt Lighting as a Service to replace conventional lighting with energy-efficient LED fixtures, automated controls, occupancy sensors, and smart lighting systems.
The service-based model reduces the need for large upfront investments while providing installation, maintenance, and performance monitoring. In 2025, demand was further supported by commercial building modernization and the growing focus on reducing electricity expenses. Indoor installations also offer opportunities for centralized lighting management, automated brightness adjustment, and occupancy-based controls, making them attractive for organizations seeking better energy management and lower maintenance requirements.
Outdoor plays an important role in the Lighting as a Service market due to increasing demand for energy-efficient lighting across roads, highways, parking areas, public spaces, industrial campuses, and commercial properties. In 2025, adoption was supported by the growing need to modernize streetlights, improve nighttime visibility, and reduce public infrastructure maintenance expenses.
According to the U.S. Department of Energy, automatic lighting controls can reduce energy costs by up to 30–75% in exterior and parking structure lighting applications. Furthermore, the DOE’s Memphis streetlighting project covered more than 77,000 streetlights, with expected annual energy savings exceeding 37 million kWh and energy cost savings of 55%.
By Contract Type Analysis
Retrofit Projects dominate as businesses modernize existing lighting systems without replacing entire infrastructure.
In 2025, “Retrofit Projects” held a dominant market position, capturing more than a 73.21% share. The segment leads because many commercial buildings, warehouses, manufacturing facilities, and public properties already have established lighting infrastructure that requires energy-efficient upgrades. Through Lighting as a Service agreements, customers can replace conventional lighting fixtures with LED luminaires, smart sensors, automated controls, and connected monitoring systems without making large upfront investments.
In 2025, demand for retrofit projects was supported by the need to reduce electricity expenses, improve lighting performance, and extend the operational life of existing facilities. These projects also allow service providers to offer installation, maintenance, energy monitoring, and technology upgrades under a single contract. The retrofit model is particularly attractive for organizations seeking energy savings while avoiding major building modifications.
New Installations represent an important segment of the Lighting as a Service market as businesses increasingly incorporate energy-efficient lighting systems into newly constructed commercial buildings, industrial facilities, warehouses, hospitals, and office spaces. In 2025, demand was supported by the development of smart buildings and the growing preference for LED luminaires, automated controls, occupancy sensors, and connected lighting platforms.
The U.S. Department of Energy reports that lighting accounts for approximately 35% of electricity consumption in commercial buildings, highlighting the importance of efficient lighting design in new construction. This creates opportunities for Lighting as a Service providers to offer complete installation, maintenance, monitoring, and energy-management agreements. New commercial construction and industrial facility development are expected to support demand for integrated lighting solutions.
By End Use Analysis
Commercial applications dominate through widespread adoption across offices, retail spaces, and public buildings.
In 2025, “Commercial” held a dominant market position, capturing more than a 47.21% share. The segment leads because commercial properties require reliable and energy-efficient lighting across offices, shopping centres, hotels, hospitals, educational institutions, and retail outlets. Businesses increasingly adopt Lighting as a Service to reduce electricity expenses, avoid high upfront equipment costs, and simplify lighting maintenance.
In 2025, the demand was supported by the replacement of conventional fixtures with LED luminaires, smart lighting controls, occupancy sensors, and automated monitoring systems. The service-based model allows commercial property owners to access installation, maintenance, and technology upgrades through regular payments. It also helps facility managers monitor lighting performance and adjust energy consumption according to building occupancy and operating hours.
Industrial represents an important end-use segment of the Lighting as a Service market, supported by growing demand from manufacturing plants, warehouses, production units, logistics centres, and processing facilities. In 2025, industrial facilities increasingly focused on replacing conventional lighting with LED high-bay fixtures, smart controls, motion sensors, and automated lighting management systems. These solutions help manufacturers reduce electricity expenses, improve workplace visibility, and manage lighting across large operational areas.
According to the U.S. Department of Energy, lighting accounts for approximately 5% of total electricity use in U.S. manufacturing facilities. This creates opportunities for service providers to introduce energy-efficient lighting solutions across factories and industrial buildings. The growing focus on operational cost reduction, workplace safety, and energy management is expected to support industrial adoption.
Key Market Segments
By Component
- Luminaires and Controls
- Software and Analytics
- Services
By Installation Type
- Indoor
- Outdoor
By Contract Type
- Retrofit Projects
- New Installations
By End Use
- Commercial
- Industrial
- Municipal
Driver Analysis
Low-Cost Household Servings
Cordials offer a low packaged-ingredient cost per prepared drink, supporting household substitution from more expensive packaged beverages without requiring consumers to abandon flavour. A November 2026 Sainsbury’s listing prices Robinsons Double Strength Lemon No Added Sugar Squash at GBP 3.75 for 1.75 litres, with 70 servings of 250 ml when diluted one part concentrate to nine parts water. That equates to 17.5 litres of prepared beverage, approximately GBP 0.054 per serving or GBP 0.214 per prepared litre, excluding water, refrigeration and wastage; it is one retailer’s listed price, not a national average.
Against an assumed packaged alternative costing GBP 0.50 per 250 ml, the ingredient-cost difference is approximately GBP 0.446 per serving, making the category commercially attractive even when consumers prepare only part of their weekly drinks this way. In an illustrative household consuming 20 such servings weekly, one bottle lasts 3.5 weeks and annual purchases approach 15 bottles, before seasonality and alternative beverages.
Manufacturers therefore compete on clearly communicated servings, taste consistency and repeat purchase rather than bottle price alone, while retailers can position cordials as an affordable basket staple. However, concentrating a product further may reduce purchase frequency unless pricing and household recruitment compensate. The +1.1 pp estimate assumes 27.5% revenue exposure grows 4.0 percentage points faster through value-led household adoption and additional occasions, excluding reduced-sugar switching and distribution gains counted separately.
Drivers Impact Analysis
| Driver | (~) % Impact on CAGR Forecast | Geographic Relevance | Impact Timeline |
|---|---|---|---|
| Low-cost household servings | +1.1 pp | UK, Ireland, Australia, South Africa | Short term (≤ 2 years) |
| Reduced-sugar portfolio adoption | +0.9 pp | UK core; EU, Australia, New Zealand | Short term (≤ 2 years) |
| Concentrated-format distribution economics | +0.7 pp | UK, EU; Australia, Southern Africa | Medium term (2–4 years) |
| Flavour-led retail penetration | +0.6 pp | UK, Ireland; selected export markets | Short term (≤ 2 years) |
| Premium mixed-drink occasions | +0.4 pp | UK, Western Europe, Australia, North America | Medium term (2–4 years) |
Restraint Analysis
Sugar-Levy Price Penalties
Added-sugar cordials that cross levy thresholds face a direct pricing disadvantage because UK liability is calculated on the prepared drink rather than simply the litres of concentrate shipped. HMRC’s current guidance specifies rates effective from 1 April 2026 of GBP 2.08 per 10 litres for qualifying drinks containing at least 5.0 but less than 8.0 g sugar/100 ml, and GBP 2.78 per 10 litres at 8.0 g/100 ml or above; diluted-drink reporting uses the volume produced according to the stated dilution ratio.
In an illustrative 500-ml cordial diluted one part concentrate to nine parts water, prepared volume is 5.0 litres, creating GBP 1.04 of lower-band or GBP 1.39 of higher-band liability per bottle. Against an assumed GBP 2.00 manufacturer realization before levy, those amounts equal 52.0% and 69.5%, respectively, demonstrating why affected recipes can require substantial repricing or reformulation. These are not universal cordial costs: no-added-sugar products and formulations below the relevant threshold can fall outside liability, and applicable exemptions must be assessed individually. Nichols, for example, states that its entire UK Packaged portfolio is below the announced future 4.5 g/100 ml threshold, illustrating that exposure differs materially by supplier.
Manufacturers consequently face a choice between preserving a traditional recipe at a higher consumer price and funding a commercially acceptable reformulation. The −0.5 pp deduction assumes 12.5% revenue exposure grows 4.0 percentage points more slowly through tax-related price resistance, excluding reduced-sugar sales gains already counted in the drivers analysis.
Restraint Impact Analysis
| Restraint | (~) % Impact on CAGR Forecast | Geographic Relevance | Impact Timeline |
|---|---|---|---|
| Sugar-levy price penalties | −0.5 pp | UK; exporters into UK | Short term (≤ 2 years) |
| Restricted advertising and promotions | −0.4 pp | UK advertising; England retail | Short term (≤ 2 years) |
| Preparation-dependent channel access | −0.4 pp | UK, EU, North America, Australia | Long term (≥ 4 years) |
| Open-bottle consumption limits | −0.3 pp | UK, EU, Australia; premium exports | Short term (≤ 2 years) |
| Uneconomic low-volume listings | −0.2 pp | UK, EU, North American export channels | Medium term (2–4 years) |
Opportunity Analysis
Contracted Workplace Cordial Dispensing
Multi-year workplace supply agreements could turn cordial from an occasionally purchased bottle into a replenished consumable sold against installed dispensing capacity, accessing office occasions not currently served by in-scope concentrates. Britvic’s existing Aqua Libra platform demonstrates the technical feasibility of monitored dispensing: its Flavour Tap Nano offers up to 10,000 serves before restocking, a customer usage portal and predictive cartridge replacement.
The opportunity is a separately qualified fruit- or botanical-cordial offering supplied to additional workplace accounts, not relabelling established flavour-water cartridges or counting equipment rental as ingredient revenue. In an illustrative deployment across 500 sites, 100 eligible staff per site consuming one 250-ml serving on 220 working days generate 11.0 million annual servings. At a one-part-concentrate-to-nine-parts-water formulation, this requires 275,000 litres of cordial; an assumed manufacturer realization of USD 2.00/litre produces USD 550,000.0 annually before displaced cordial purchases.
Site utilization, cleaning, product stability and service costs determine viability, while installation and hardware income remain outside market revenue. The +0.35 pp contribution assumes 7.0% revenue exposure grows 5.0 percentage points faster through incremental contracted workplace demand, excluding ordinary household distribution and existing foodservice supply.
Opportunity Impact Analysis
| Opportunity | (~) % Potential CAGR Upside | Geographic Relevance | Execution Window |
|---|---|---|---|
| Contracted workplace cordial dispensing | +0.35 pp | UK, Germany, Netherlands, Nordics | Medium term (2–4 years) |
| Targeted functional cordial platforms | +0.30 pp | UK, EU, Australia, Singapore | Medium term (2–4 years) |
| Occasion-sized discovery subscriptions | +0.25 pp | UK, Germany, US, Australia | Short term (≤ 2 years) |
| Local-finish cordial partnerships | +0.30 pp | Malaysia, Indonesia, Gulf states, East Africa | Medium term (2–4 years) |
| Modular hospitality recipe systems | +0.20 pp | UK, EU, Gulf states, Australia | Short term (≤ 2 years) |
Challenges Analysis
Fruit-Input Specification Variability
Weather-sensitive fruit sourcing creates recurring variation in ingredient availability and specifications, requiring cordial manufacturers to balance sensory consistency, recipe compliance and procurement flexibility rather than simply purchase interchangeable concentrate. Britvic identifies adverse weather, low harvest yields and citrus greening as challenges to stable juice supplies; its sourcing case study describes switching less-available fruits and adjusting juice ratios, supported by technical development and geographically diversified suppliers.
In an illustrative recipe requiring 1,000 kg of soluble solids from a fruit concentrate, material at 65.0°Brix supplies that quantity in approximately 1,538.5 kg, whereas material at 60.0°Brix requires 1,666.7 kg, an 8.3% increase in purchased mass. At an assumed unchanged USD 2.00/kg, ingredient expenditure rises by approximately USD 256.4 before offsetting water adjustments; actual contracts may price on standardized solids and therefore avoid this particular penalty. Matching soluble solids also does not guarantee equivalent acidity, aroma or colour.
Suppliers need origin-specific specifications, incoming sensory and analytical checks, approved substitute sources and controlled blending procedures. The −0.30 pp estimate assumes 15.0% revenue exposure grows 2.0 percentage points more slowly through reformulation work, yield adjustments and release delays, excluding outright shortages that prevent production and commodity-price effects already embedded in the baseline.
Challenges Impact Analysis
| Challenge | (~) % CAGR Friction Drag | Geographic Relevance | Mitigation Horizon |
|---|---|---|---|
| Fruit-input specification variability | −0.30 pp | Brazil, EU, Southern Africa; UK processors | Long term (≥ 4 years) |
| Reduced-sugar preservation control | −0.30 pp | UK, EU, Australia, New Zealand | Medium term (2–4 years) |
| Dilution and dosing consistency | −0.25 pp | UK, EU, Gulf foodservice, Australia | Short term (≤ 2 years) |
| Seasonal inventory forecast error | −0.25 pp | UK, Northern Europe, Australia, South Africa | Medium term (2–4 years) |
| Multi-format production changeovers | −0.20 pp | UK, EU; Southeast Asian export hubs | Medium term (2–4 years) |
Geopolitical Impact Analysis
Geopolitical Impact of the Middle East War on the Lighting as a Service Market
The ongoing Middle East war in 2026 is creating cost and supply chain challenges for the Lighting as a Service market. Disruptions around the Strait of Hormuz have increased energy prices, shipping expenses, and uncertainty across international trade. According to the World Bank’s October 2026 Commodity Markets Outlook, global energy prices are projected to increase by 32% in 2026, while overall commodity prices are expected to rise by 23%. These increases can raise manufacturing and transportation costs for LED luminaires, lighting controls, electronic components, and installation equipment.
Higher electricity and operating costs may encourage commercial buildings, factories, and warehouses to adopt energy-efficient lighting through subscription-based contracts rather than purchasing complete systems. However, rising financing costs and delayed equipment deliveries could affect project implementation and profitability. The conflict may also encourage service providers to diversify suppliers and strengthen regional sourcing networks. In the longer term, the growing focus on energy security and reduced electricity consumption could support Lighting as a Service adoption. Therefore, geopolitical tensions present both cost-related risks and new opportunities for energy-efficient lighting providers.
Regional Insights
Dominating Region: Europe – 44.12% Share, USD 1.7 Billion
Europe held the leading position in the Lighting as a Service market in 2025, accounting for 44.12% of the global market, valued at USD 1.7 billion. The region’s leadership is supported by strong energy-efficiency regulations, increasing adoption of smart buildings, and growing investment in commercial infrastructure modernization. Countries such as Germany, the United Kingdom, France, and the Netherlands are supporting demand through LED replacement projects, intelligent lighting controls, and building renovation programmes.
According to the European Commission, the revised Energy Performance of Buildings Directive targets renovation of the 16% worst-performing non-residential buildings by 2030 and 26% by 2033. These requirements create opportunities for service providers offering lighting upgrades, maintenance, and energy monitoring under long-term contracts.
Asia Pacific represents an important growth opportunity as commercial construction, industrial expansion, warehouse development, and smart infrastructure projects increase demand for modern lighting systems. China is an important contributor to regional LED adoption, with the International Energy Agency reporting an LED market share exceeding 85%.
Growing interest in connected lighting, automated controls, and energy-efficient industrial facilities is creating opportunities for subscription-based lighting services. The region’s expanding commercial buildings and manufacturing infrastructure also encourage businesses to consider service-based lighting arrangements to manage installation and maintenance costs. However, a verified regional growth rate is required before formally ranking Asia Pacific as the fastest-growing region.
Key Regions and Countries Insights
- North America
- US
- Canada
- Europe
- Germany
- France
- The UK
- Spain
- Italy
- Rest of Europe
- Asia Pacific
- China
- Japan
- South Korea
- India
- Australia
- Rest of APAC
- Latin America
- Brazil
- Mexico
- Rest of Latin America
- Middle East & Africa
- GCC
- South Africa
- Rest of MEA
Key Players Analysis
Signify Holding maintains a strong position in the lighting industry through its professional lighting products, connected systems, and energy-management services. In 2025, the company reported annual sales of EUR 5.765 billion, employed approximately 27,000 people, and operated in more than 70 countries. Its connected lighting network reached 167 million connected light points by the end of 2025. Its Signify Interact and Dynalite platforms support intelligent lighting management, remote monitoring, and energy optimization, strengthening its relevance to Lighting as a Service solutions.
Current, formerly known as GE Current, a Daintree company, focuses on commercial and industrial lighting, connected controls, and building energy management. Its Daintree technology supports wireless lighting controls and monitoring across commercial and industrial facilities. GE reported that Daintree-based technology was managing more than 1 million lights, thermostats, and sensors across customer locations, with lighting and heating, ventilation, and air-conditioning energy cost savings of up to 60%. These capabilities support subscription-based lighting management and energy-efficiency services.
Acuity Brands strengthens its market presence through advanced lighting products, intelligent controls, and building-management technologies. In fiscal 2025, its Acuity Brands Lighting segment generated net sales of USD 3.612 billion, recording 1.1% growth compared with the previous year. Its Acuity Intelligent Spaces segment generated USD 764.3 million, increasing by 161.8%. The company offers connected lighting and intelligent building solutions that support energy monitoring, automated controls, and efficient facility operations, making it relevant to the Lighting as a Service market.
Top Key Players Outlook
- Signify Holding
- GE Current, a Daintree company
- Acuity Brands
- Zumtobel Group
- Enlighted Inc (Siemens)
- LEDVANCE GmbH
- Ameresco Inc.
- Orion Energy Systems
- Lumenix
- Stouch Lighting
- LumenServe Inc.
- Lime Energy (now Willdan)
- RAB Lighting
- Other Key Players
Recent Developments
- In March 2025, Zumtobel acquired the remaining 52% stake in Swiss-based Inventron AG, taking full ownership to strengthen its customised lighting development and production capabilities.
- In March 2025, Enlighted Eazy, a smart lighting control system designed for small and medium-sized businesses, featuring laser-based commissioning that enabled installation up to 30% faster than traditional Bluetooth commissioning.
Report Scope
| Report Features | Description |
|---|---|
| Market Value (2025) | USD 3.9 Bn |
| Forecast Revenue (2035) | USD 157.7 Bn |
| CAGR (2026-2035) | 44.7% |
| Base Year for Estimation | 2025 |
| Historic Period | 2020-2024 |
| Forecast Period | 2026-2035 |
| Report Coverage | Revenue Forecast, Market Dynamics, Competitive Landscape, Recent Developments |
| Segments Covered | By Component (Luminaires and Controls, Software and Analytics, Services), By Installation Type (Indoor, Outdoor), By Contract Type (Retrofit Projects, New Installations), By End Use (Commercial, Industrial, Municipal) |
| Regional Analysis | North America – US, Canada; Europe – Germany, France, The UK, Spain, Italy, Rest of Europe; Asia Pacific – China, Japan, South Korea, India, Australia, Singapore, Rest of APAC; Latin America – Brazil, Mexico, Rest of Latin America; Middle East & Africa – GCC, South Africa, Rest of MEA |
| Competitive Landscape | Signify Holding, GE Current, a Daintree company, Acuity Brands, Zumtobel Group, Enlighted Inc (Siemens), LEDVANCE GmbH, Ameresco Inc., Orion Energy Systems, Lumenix, Stouch Lighting, LumenServe Inc., Lime Energy (now Willdan), RAB Lighting, Other Key Players |
| Customization Scope | Customization for segments, region/country-level will be provided. Moreover, additional customization can be done based on the requirements. |
| Purchase Options | We have three licenses to opt for: Single User License, Multi-User License (Up to 5 Users), Corporate Use License (Unlimited User and Printable PDF) |