Report Overview
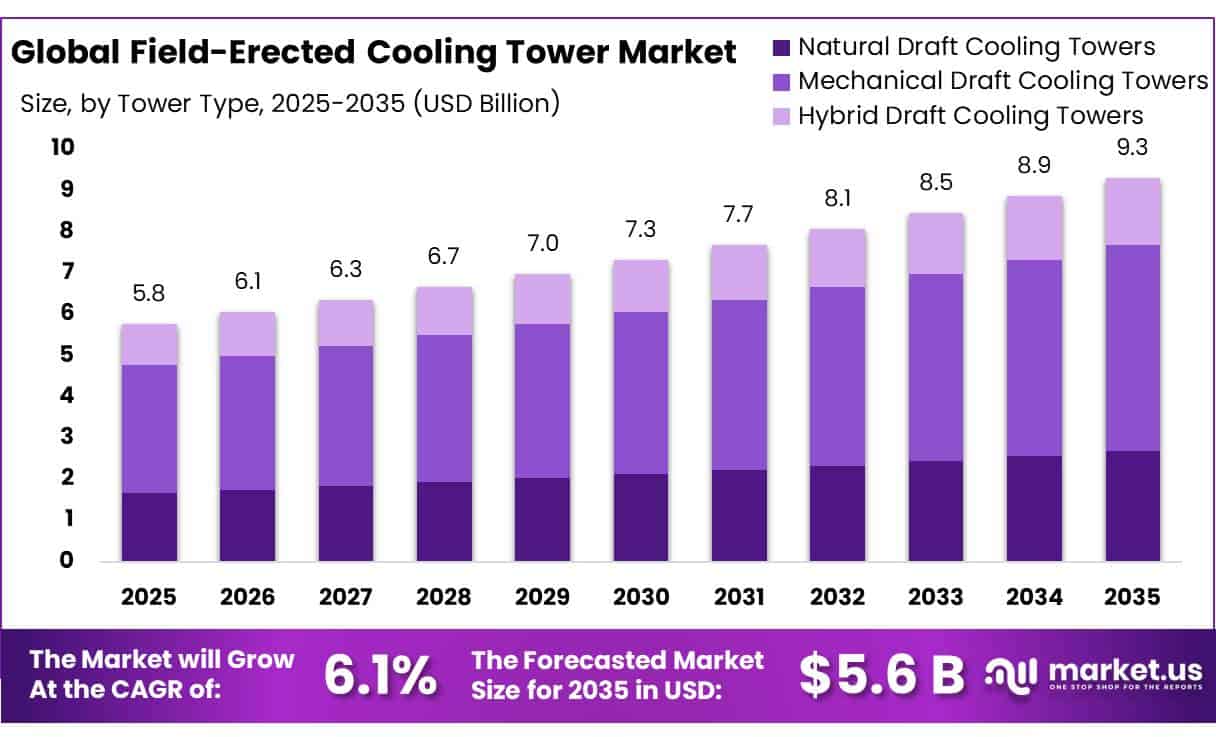
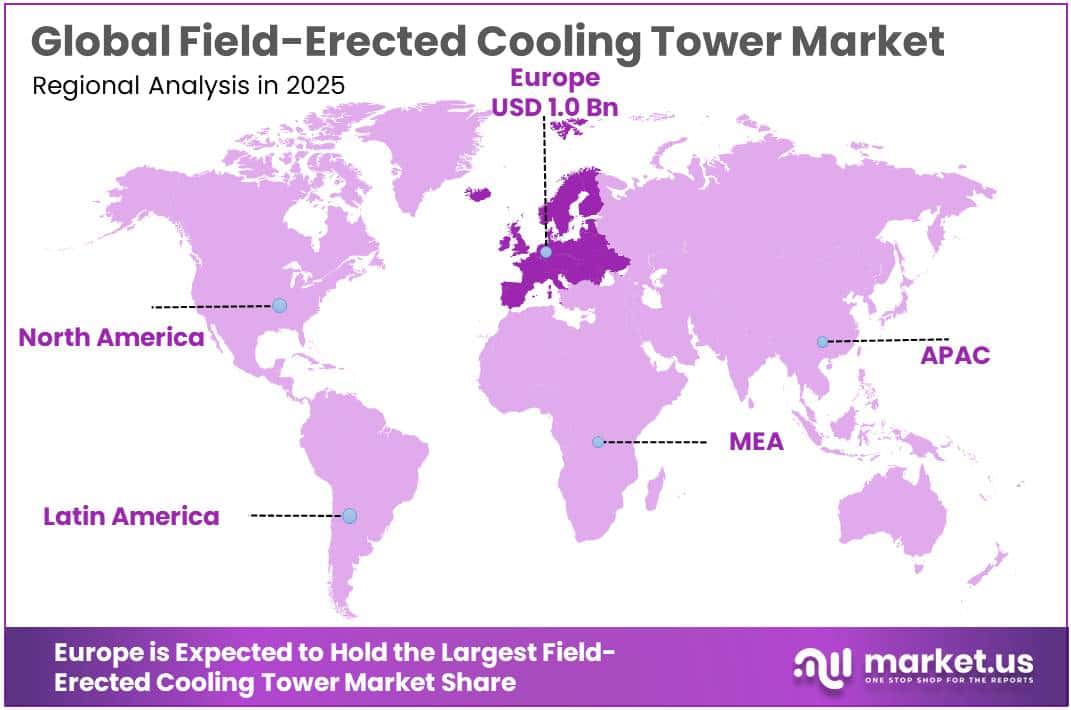
The Global Field-Erected Cooling Tower Market size is expected to be worth around USD 5.6 Billion by 2035, from USD 3.1 Billion in 2025, growing at a CAGR of 6.1% during the forecast period from 2026 to 2035. In 2025, Europe held a dominant market position, capturing more than a 35.00% share, holding USD 1.0 Billion revenue.
Field-erected cooling towers are large-scale industrial heat rejection systems assembled directly at the installation site to meet the cooling requirements of major industrial facilities. These structures are designed to manage high heat loads, continuous operations, and demanding process conditions that cannot always be accommodated by factory-assembled cooling towers.
- According to the U.S. Environmental Protection Agency (EPA), industrial process cooling towers are essential in petroleum refineries, chemical manufacturing, primary metals processing, glass manufacturing, and other process-intensive industries.
A major driving factor is the expansion of energy-intensive industrial operations and electricity generation. According to the U.S. Energy Information Administration (EIA), its 2012 assessment identified 875 out of 1,655 operable U.S. power plant cooling systems as recirculating systems, representing approximately 53% of the total. This illustrates the importance of cooling infrastructure that recycles water and supports thermal management.
Water conservation and environmental compliance are also influencing industrial cooling investments. The EPA’s WaterSense guidance indicates that cooling towers can account for 20% to 50% or more of total water consumption in certain commercial and institutional facilities. This highlights the importance of improving water efficiency, optimizing cycles of concentration, reducing blowdown, and implementing effective water treatment. Industrial operators are increasingly focusing on drift reduction, improved fill materials, corrosion control, and efficient water distribution systems to reduce operating costs and environmental impact.
Future growth opportunities are expected to emerge from the modernization of aging industrial infrastructure, the expansion of chemical and petrochemical complexes, and rising demand from power generation and large manufacturing facilities. Additional opportunities exist in digital monitoring, predictive maintenance, hybrid cooling technologies, water-recovery systems, and environmentally optimized tower designs. The VDMA Large-Scale Plant Engineering Status Report 2025/2026 highlights increasing electricity demand from artificial intelligence data centers as a potential source of investment in power generation and grid infrastructure.
Key Takeaways
- Field-Erected Cooling Tower Market size is expected to be worth around USD 5.6 Billion by 2035, from USD 3.1 Billion in 2025, growing at a CAGR of 6.1%.
- Mechanical Draft Cooling Towers held a dominant market position, capturing more than a 53.00% share.
- Counterflow Cooling Towers held a dominant market position, capturing more than a 58.00% share.
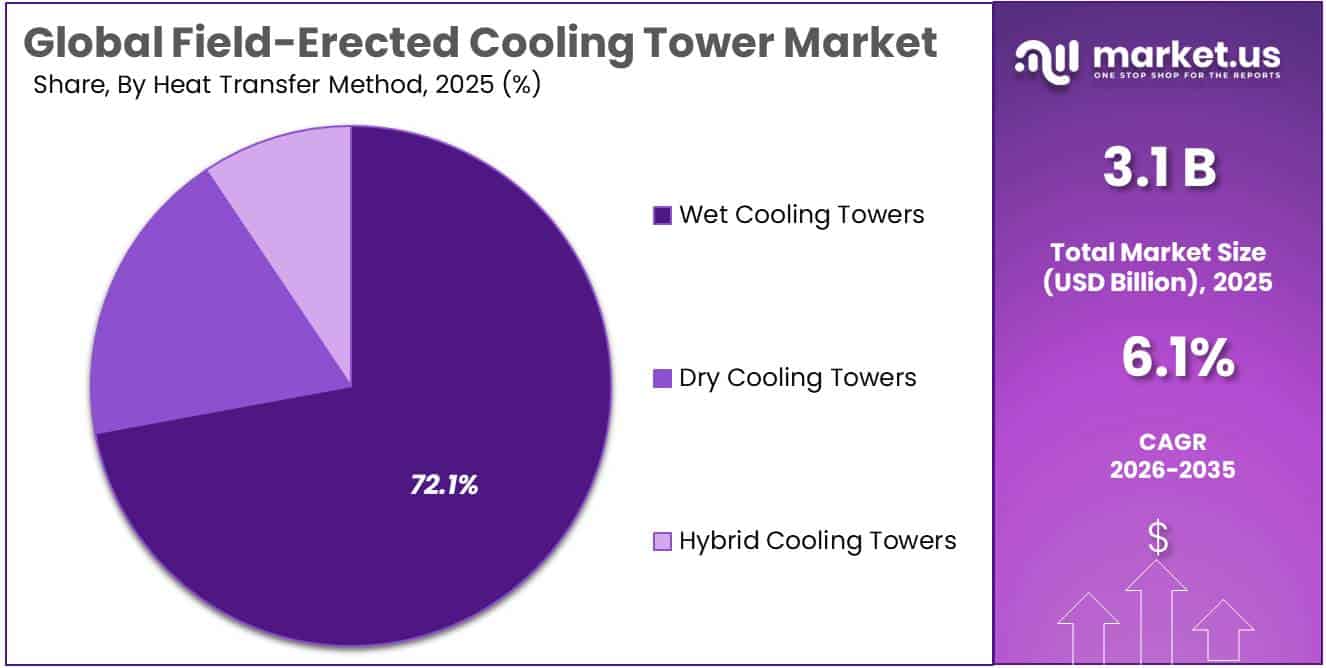
- Wet Cooling Towers held a dominant market position, capturing more than a 72.00% share.
- Concrete held a dominant market position, capturing more than a 42.00% share.
- Power Generation held a dominant market position, capturing more than a 45.00% share.
- Manufacturing Facilities held a dominant market position, capturing more than a 25.00%.
- Europe held a dominant market position in the Field-Erected Cooling Tower Market, capturing a 35.00% share valued at approximately USD 1.0 billion.
By Tower Type Analysis
Mechanical Draft Cooling Towers – Dominant Segment (53.00% Share)
In 2025, Mechanical Draft Cooling Towers held a dominant market position, capturing more than a 53.00% share of the Field-Erected Cooling Tower Market. Their strong position is supported by controlled airflow, reliable heat transfer, and consistent cooling performance across large industrial facilities. These towers use mechanically driven fans to circulate air, allowing operators to regulate cooling performance according to process requirements.
Chemical processing plants, refineries, and power generation facilities prefer mechanical draft systems because of their operational flexibility and suitability for demanding industrial environments. Their ability to maintain stable cooling performance under varying weather conditions further supports their adoption in large-scale industrial applications.
According to the U.S. Environmental Protection Agency (EPA), approximately 28% of existing power producers and 35% of existing manufacturers use cooling towers, highlighting their importance across electricity generation and industrial manufacturing. Mechanical draft cooling towers use electrically powered fans to move air through the system, providing controlled airflow and reliable cooling under different operating conditions.
These characteristics support their adoption in chemical, petrochemical, and industrial processing facilities. However, these government statistics refer to cooling tower usage overall and do not independently verify the 53.00% market share attributed to mechanical draft cooling towers in the supplied market data.
By Flow Type Analysis
Counterflow Cooling Towers – Dominant Segment (58.00% Share)
In 2025, Counterflow Cooling Towers held a dominant market position, capturing more than a 58.00% share of the Field-Erected Cooling Tower Market. Their leading position is supported by efficient heat transfer, compact design, and reliable cooling performance across large industrial facilities. In these towers, air moves upward while water flows downward, creating effective contact between air and water for heat removal.
Chemical processing plants, refineries, and power generation facilities prefer counterflow cooling towers because of their ability to support demanding industrial cooling requirements. Their suitability for high-temperature applications and flexible installation further strengthens their demand in large-scale industrial projects.
The U.S. Environmental Protection Agency (EPA) provides technical information on industrial cooling towers, including heat transfer, water consumption, and operating characteristics. According to EPA’s AP-42, Section 13.4: Wet Cooling Towers, cooling towers are important industrial systems for transferring waste heat to the atmosphere through water evaporation and sensible heat transfer.
The document also explains the operating principles of counterflow and crossflow designs. However, the EPA does not provide a verified 58.00% market-share figure for counterflow cooling towers. Therefore, the 58.00% share is retained exclusively from the supplied market data.
By Heat Transfer Method Analysis
Wet Cooling Towers – Dominant Segment (72.00% Share)
In 2025, Wet Cooling Towers held a dominant market position, capturing more than a 72.00% share of the Field-Erected Cooling Tower Market. Their dominance is supported by effective heat transfer, high cooling capacity, and widespread use across chemical processing, petrochemical, power generation, and heavy manufacturing industries. Wet cooling towers use water evaporation to remove heat from industrial processes, making them suitable for facilities with substantial cooling requirements.
According to the U.S. Environmental Protection Agency (EPA), wet cooling towers operate through evaporative heat transfer, where a portion of circulating water evaporates to remove heat from the system. The EPA’s WaterSense at Work guidance identifies cooling towers as significant water-consuming systems in commercial and industrial facilities. It reports that cooling towers can account for 20% to 50% or more of facility water consumption, depending on operating conditions and facility type.
By Construction Material Analysis
Concrete – Dominant Segment (42.00% Share)
In 2025, Concrete held a dominant market position, capturing more than a 42.00% share of the Field-Erected Cooling Tower Market. Its leading position is supported by high structural strength, durability, and suitability for large industrial installations. Concrete cooling towers are widely used in power generation, chemical processing, petrochemical, and heavy manufacturing facilities where long-term operational reliability is essential. Their ability to withstand demanding environmental conditions, heavy loads, and continuous industrial operations makes them a preferred choice for large-scale projects.
According to the U.S. Environmental Protection Agency (EPA), large natural-draft cooling towers used in power generation and industrial applications can reach heights of 500 feet or more, demonstrating the scale of cooling infrastructure that may require substantial structural support. Concrete is commonly selected for large cooling tower structures because of its strength, durability, and ability to support heavy industrial loads.
By Application Analysis
Power Generation – Dominant Segment (45.00% Share)
In 2025, Power Generation held a dominant market position, capturing more than a 45.00% share of the Field-Erected Cooling Tower Market. Its leading position is driven by the substantial cooling requirements of thermal power plants, nuclear power stations, and large electricity-generating facilities. Cooling towers play an essential role in removing excess heat from condensers and maintaining efficient plant operations. Field-erected cooling towers are particularly suitable for power plants because of their ability to handle large cooling loads, customized engineering requirements, and continuous operating conditions.
According to the U.S. Energy Information Administration (EIA), the United States had approximately 1,655 operable electric generating plants covered in its assessment of power plant cooling systems. The EIA also reported that 875 cooling systems were classified as recirculating systems, demonstrating the importance of cooling infrastructure in electricity generation. Recirculating systems commonly use cooling towers to manage heat and reduce continuous water withdrawal requirements.
By End User Analysis
Manufacturing Facilities: Dominant Segment with a 25.00% Share
In 2025, “Manufacturing Facilities” held a dominant market position, capturing more than a 25.00% share of the Field-Erected Cooling Tower Market. Manufacturing facilities require large-scale cooling systems to manage heat generated during production, maintain equipment performance, and support uninterrupted industrial operations. Field-erected cooling towers are particularly suitable for large factories because they can be designed according to site conditions and specific cooling requirements.
According to the U.S. Environmental Protection Agency (EPA), cooling towers can account for 20% to 50% or more of total water use in commercial and institutional facilities, demonstrating the importance of cooling infrastructure. In 2025, industrial modernization and investments in production capacity continued to support demand for reliable cooling systems. In 2026, the emphasis on water efficiency, equipment reliability, and operational continuity is expected to further strengthen adoption across manufacturing industries.
According to the U.S. Energy Information Administration (EIA), in its assessment of electricity-generating cooling systems, 53% of U.S. electric generating capacity uses closed-cycle cooling systems, which commonly rely on cooling towers. In 2025, power generation facilities continued to focus on cooling efficiency and water conservation. In 2026, the adoption of recirculating cooling systems, modernization of existing plants, and growing requirements for dependable thermal management are supporting demand for field-erected cooling towers.
Key Market Segments
By Tower Type
- Natural Draft Cooling Towers
- Mechanical Draft Cooling Towers
- Hybrid Draft Cooling Towers
By Flow Type
- Counterflow Cooling Towers
- Crossflow Cooling Towers
By Heat Transfer Method
- Wet Cooling Towers
- Dry Cooling Towers
- Hybrid Cooling Towers
By Construction Material
- Concrete
- Steel
- Fiberglass-Reinforced Plastic (FRP)
- Other Materials
By Application
- Power Generation
- HVAC
- Industrial Process Cooling
- Oil and Gas
- Chemical and Petrochemical
- Pulp and Paper
- Food and Beverage
- Other Applications
By End User
- Power Plants
- Manufacturing Facilities
- Oil and Gas Facilities
- Chemical Plants
- Commercial and Institutional Facilities
Driver Analysis
Dispatchable-Power Cooling Investment — +0.7 Percentage Points
New and refurbished steam-cycle generation supports field-erected tower procurement where project owners select recirculating wet or hybrid cooling, but neither generating capacity nor electricity-demand growth translates automatically into tower orders. IEA reports 78 GW of nuclear capacity under construction across fifteen countries, approximately half in China, alongside 420 GW of operating nuclear capacity at end-2025; these figures establish a substantial thermal-generation pipeline but do not identify which projects use cooling towers rather than seawater, once-through or dry cooling. SPX identifies field-erected towers as engineered equipment for high-heat-load power applications, confirming the relevant technology pathway.
If three of five otherwise eligible projects select field-erected wet or hybrid towers at an assumed USD 25 million per package, supplier opportunity is USD 75 million—not the value of all five generating plants. The +0.7-point sensitivity assumes 25% of terminal counterfactual revenue is exposed to dispatchable-power projects and achieves approximately 13.6% cumulative outperformance, adding 3.4% terminal market revenue.
Drivers Impact Analysis
| Driver | (~) % Impact on CAGR Forecast | Geographic Relevance | Impact Timeline |
|---|---|---|---|
| Dispatchable-power cooling investment | +0.7 pp | China, India, US, Middle East | Long term (≥ 4 years) |
| Refining and petrochemical projects | +0.6 pp | China, India, Middle East, US | Medium term (2–4 years) |
| Ageing-tower reconstruction | +0.5 pp | US, EU, Japan, India | Medium term (2–4 years) |
| Industrial cooling debottlenecking | +0.5 pp | China, India, ASEAN, Brazil | Medium term (2–4 years) |
| Energy-efficiency retrofits | +0.4 pp | US, EU, Japan, South Korea | Short term (≤ 2 years) |
| Water-quality-driven specifications | +0.3 pp | India, Gulf states, US, China | Medium term (2–4 years) |
Restraint Analysis
Secure-Water Supply Limits — −0.6 Percentage Points
An evaporative tower cannot meet its intended duty without adequate makeup water, creating a direct investment barrier where reliable supply, discharge capacity or acceptable water chemistry cannot be secured. DOE’s cooling-tower guidance identifies makeup requirements as the combined effect of evaporation, blowdown and drift, and emphasizes that higher cycles of concentration are limited by scaling, corrosion and chemistry; water conservation therefore reduces but does not eliminate the underlying requirement.
In a constructed 200 MWth heat-rejection system, an illustrative evaporation estimate using 2.4 MJ/kg of latent heat is approximately 300 m³/hour if the duty is treated as latent heat; actual evaporation depends on the sensible–latent heat split and operating conditions. At five cycles of concentration and neglecting drift, blowdown is approximately 75 m³/hour and makeup approximately 375 m³/hour. Over 7,000 annual hours, makeup demand reaches roughly 2.63 million m³; at an assumed USD 2/m³ marginal supply cost, annual water expenditure is approximately USD 5.25 million before treatment and discharge charges.
A dependable allocation of only 250 m³/hour would leave a 125 m³/hour shortfall under those assumptions, requiring redesign, additional water sourcing or reduced duty. The −0.6-point sensitivity assumes 25% of terminal counterfactual revenue is water-constrained and experiences an 11.2% realization shortfall, producing approximately 2.8% market-wide terminal erosion. Suppliers may recover projects through qualified reclaimed-water or hybrid configurations, but water-treatment expenditure outside the tower scope is excluded and partial mitigation must offset the deduction.
Restraint Impact Analysis
| Restraint | (~) % Impact on CAGR Forecast | Geographic Relevance | Impact Timeline |
|---|---|---|---|
| Secure-water supply limits | −0.6 pp | India, Gulf states, northern China, US Southwest | Long term (≥ 4 years) |
| Dry-cooling substitution | −0.4 pp | Gulf states, Australia, US, China | Long term (≥ 4 years) |
| Installed-cost investment barriers | −0.4 pp | India, ASEAN, Brazil; US, EU retrofits | Medium term (2–4 years) |
| Wet-bulb and site ceilings | −0.3 pp | Gulf coast, India, ASEAN, US Gulf | Long term (≥ 4 years) |
| Packaged-tower substitution | −0.3 pp | US, EU, Japan, ASEAN | Medium term (2–4 years) |
| Aerosol-related siting constraints | −0.3 pp | US, EU, UK, Australia | Medium term (2–4 years) |
Opportunity Analysis
Campus-Scale Data-Center Cooling — +0.5 Percentage Points
The adjacent-market opportunity is to qualify field-erected towers for selected large data-center campuses whose heat-rejection architecture, plot and expansion plan support centralized evaporative cooling—not assume that all AI infrastructure uses water-cooled systems. SPX’s October 2026 data-center portfolio includes the Marley 400 field-erected tower alongside packaged towers, fluid coolers and dry coolers; its application guidance also explains that phased expansion can favor factory-assembled modular equipment, establishing a competitive choice rather than automatic field-erected demand.
In a constructed campus requiring 150 MWth of tower heat rejection across a 10°C water-temperature range, circulating flow is approximately 12,900 m³/hour using water heat capacity of 4.186 kJ/kg·°C. An assumed USD 12 million eligible field-erected package across eight qualified campuses creates USD 96 million of supplier opportunity; if only five select this architecture and reach procurement by 2031, executable scope falls to USD 60 million. Those package prices and conversion rates are planning assumptions, not supplier quotations.
The +0.5-point sensitivity requires approximately 2.4% incremental terminal market revenue from newly captured campus applications, net of existing field-erected projects displaced elsewhere. Execution depends on water availability, redundancy, maintenance access and validated design conditions; direct-to-chip liquid cooling describes heat collection inside the facility and does not by itself determine the outdoor heat-rejection technology. Supplier value lies in early architectural engagement and campus-level engineering, not counting the entire data-center cooling budget as tower revenue.
Opportunity Impact Analysis
| Opportunity | (~) % Potential CAGR Upside | Geographic Relevance | Execution Window |
|---|---|---|---|
| Campus-scale data-center cooling | +0.5 pp | US, EU, Japan, India | Medium term (2–4 years) |
| Hybrid plume-abatement conversions | +0.5 pp | EU, UK, US, Japan | Medium term (2–4 years) |
| Reclaimed-water tower packages | +0.4 pp | India, Gulf states, China, US Southwest | Medium term (2–4 years) |
| Verified-performance reconstruction contracts | +0.4 pp | US, EU, Japan, India | Short term (≤ 2 years) |
| Repeatable field-assembly platforms | +0.3 pp | India, ASEAN, Middle East, Brazil | Medium term (2–4 years) |
| Capability-led acquisition platforms | +0.3 pp | US, Germany, UK, India | Short term (≤ 2 years) |
Challenges Analysis
Specialist Erection Workforce Gaps — −0.4 Percentage Points
Field erection requires coordinated structural assembly, mechanical installation and site supervision, making delivery dependent on skilled crews rather than component availability alone. The August 2025 AGC–NCCER survey, covering 1,342 respondents across the US construction industry, found that approximately 92% of hiring firms struggled to fill positions and 45% reported project delays attributable to their own or subcontractors’ workforce shortages; the latter improved from 54% in 2024, indicating persistent but not uniformly worsening friction.
In a constructed tower project requiring 40,000 productive installation-hours, a 12% productivity loss raises actual hours to approximately 45,455, adding 5,455 hours and roughly USD 300,000 at USD 55 per hour. With twenty-five workers providing fifty productive hours weekly, the schedule expands from 32.0 to approximately 36.4 weeks unless additional capacity is secured. The −0.4-point sensitivity assumes 25% terminal revenue exposure and a 7.6% delivery shortfall, equivalent to approximately 1.9% aggregate terminal erosion; overruns recovered within the same forecast period do not automatically reduce CAGR.
Suppliers must maintain regional crew pipelines, qualify subcontractors, improve assembly instructions and preserve experienced supervisors rather than rely exclusively on overtime. This is an ongoing capacity-management challenge: orders remain commercially viable, but labor variability limits how rapidly suppliers can convert backlog into accepted installations.
Challenges Impact Analysis
| Challenge | (~) % CAGR Friction Drag | Geographic Relevance | Mitigation Horizon |
|---|---|---|---|
| Specialist erection workforce gaps | −0.4 pp | US, EU, Gulf states | Long term (≥ 4 years) |
| Cross-border component scheduling | −0.3 pp | Asia–EU, Asia–Gulf, Asia–US | Medium term (2–4 years) |
| Thermal acceptance testing complexity | −0.3 pp | US, EU, China, India | Medium term (2–4 years) |
| Variable circulating-water chemistry | −0.3 pp | India, China, Gulf states, US | Long term (≥ 4 years) |
| Brownfield scope discovery risk | −0.3 pp | US, EU, Japan, India | Medium term (2–4 years) |
| Mechanical integration reliability risk | −0.3 pp | US, EU, China, India | Medium term (2–4 years) |
Geopolitical Impact Analysis
Geopolitical Impact Analysis: Impact of Ongoing Wars on the Field-Erected Cooling Tower Market
The ongoing wars, particularly the conflict in the Middle East and the Russia–Ukraine war, are creating cost and supply challenges for the Field-Erected Cooling Tower Market in 2026. These conflicts are affecting energy prices, steel availability, transportation routes, and industrial investment decisions.
According to UN Trade and Development (UNCTAD), global merchandise trade growth is expected to slow from 4.7% in 2025 to 1.5%–2.5% in 2026 amid geopolitical uncertainty.
Higher fuel prices and shipping insurance costs are increasing the expenses associated with transporting tower components and construction materials. Project owners may delay expansion or replacement projects due to budget uncertainty, financing pressure, and longer delivery schedules. The OECD also highlights that rising energy costs and supply chain disruptions are placing additional pressure on steel-intensive industries.
Regional Insights
Dominating Region: Europe (35.00% Share, USD 1.0 Billion)
In 2025, Europe held a dominant market position in the Field-Erected Cooling Tower Market, capturing a 35.00% share valued at approximately USD 1.0 billion. The region’s strong position is supported by its established industrial base, power generation infrastructure, and growing focus on energy efficiency and sustainable water management. Germany, France, the United Kingdom, Italy, and the Netherlands contribute significantly through their manufacturing, chemical processing, and electricity generation industries.
According to the European Environment Agency (EEA), electricity production accounted for approximately 33% of total water abstraction across the EU-27 during 2020–2023, highlighting the substantial role of cooling systems in regional power infrastructure. Furthermore, Eurostat reported that industry represented 23.9% of the EU’s final energy consumption in 2024, reinforcing the demand for efficient industrial cooling. Modernization of aging facilities, environmental regulations, and investments in water-efficient cooling technologies continue to support regional market growth.
Asia-Pacific is expected to experience strong growth in the Field-Erected Cooling Tower Market, supported by rapid industrialization, expanding power generation capacity, and increasing investment in manufacturing infrastructure. China, Japan, South Korea, and Southeast Asian economies are contributing to demand through industrial expansion, petrochemical production, steel manufacturing, and infrastructure development.
Key Regions and Countries Insights
- North America
- US
- Canada
- Europe
- Germany
- France
- The UK
- Spain
- Italy
- Rest of Europe
- Asia Pacific
- China
- Japan
- South Korea
- India
- Australia
- Rest of APAC
- Latin America
- Brazil
- Mexico
- Rest of Latin America
- Middle East & Africa
- GCC
- South Africa
- Rest of MEA
Key Players Analysis
Synthite Industries, established in 1972, is a producer of spice oleoresins, essential oils, and botanical extracts. The company reports 8 manufacturing facilities, a workforce of more than 3,000 people, and customers in over 90 countries. CRISIL reported consolidated revenue of INR 3,074 crore in FY2025, compared with INR 2,513 crore in FY2024, while profit after tax reached INR 194 crore in FY2025. Its operations are focused on natural ingredients rather than cooling tower manufacturing.
Kalsec Inc. is a family-owned company founded in 1958, with its global headquarters in Kalamazoo, Michigan, United States. It develops natural food ingredients, including taste and sensory solutions, natural colors, food protection ingredients, and hop products. The company reports approximately 500 employees and maintains manufacturing, research, and distribution operations across North America, Europe, and Asia. In 2026, Kalsec opened a new Spice Processing Center in Kalamazoo to expand its ingredient-processing capabilities. Its business focus is the food and beverage industry, not cooling tower equipment.
Plant Lipids Pvt. Ltd., established in 1979, specializes in spice oleoresins, essential oils, natural food colors, and wellness ingredients. The company serves customers in more than 85 countries and operates 14 manufacturing units with 4 research and development hubs. Its supply network covers more than 35 countries, while its operations support processing of over 700 tonnes of raw materials per day, according to its European website. The company also supports sustainable farming across 20,000 acres. Its activities are concentrated on food, fragrance, and wellness ingredients rather than cooling tower systems.
Top Key Players Outlook
- Synthite Industries Pvt. Ltd.
- Kalsec Inc.
- Plant Lipids Pvt. Ltd.
- MANE Kancor Ingredients Pvt. Ltd.
- Chenguang Biotech Group Co., Ltd.
- AVT Natural Products Ltd.
- Akay Natural Ingredients Pvt. Ltd.
- Universal Oleoresins Pvt. Ltd.
- Givaudan SA
- PT Indesso Aroma
- Ozone Naturals Pvt. Ltd.
- Paprika Oleo’s India Ltd.
- Vidya Herbs Pvt. Ltd.
- Jean Gazignaire S.A.S.
- Ungerer & Company
Recent Developments
- In 2025, Chenguang completed a new health-food workshop, increasing its annual soft-capsule production capacity to 2.7 billion units, upgraded protein production lines, and continued developing its marigold cultivation base in Myanmar.
- In March 2025, CARE Ratings reported that the company’s bank facility limit was enhanced from INR 370 crore to INR 400 crore, reflecting its financing requirements and ongoing business operations.
Report Scope
| Report Features | Description |
|---|---|
| Market Value (2025) | USD 3.1 Bn |
| Forecast Revenue (2035) | USD 5.6 Bn |
| CAGR (2026-2035) | 6.1% |
| Base Year for Estimation | 2025 |
| Historic Period | 2020-2024 |
| Forecast Period | 2026-2035 |
| Report Coverage | Revenue Forecast, Market Dynamics, Competitive Landscape, Recent Developments |
| Segments Covered | By Tower Type (Natural Draft Cooling Towers, Mechanical Draft Cooling Towers, Hybrid Draft Cooling Towers), By Flow Type (Counterflow Cooling Towers, Crossflow Cooling Towers, By Heat Transfer Method, Wet Cooling Towers, Dry Cooling Towers, Hybrid Cooling Towers), By Construction Material (Concrete, Steel, Fiberglass-Reinforced Plastic (FRP), Other Materials), By Application (Power Generation, HVAC, Industrial Process Cooling, Oil and Gas, Chemical and Petrochemical, Pulp and Paper, Food and Beverage, Other Applications), By End User (Power Plants, Manufacturing Facilities, Oil and Gas Facilities, Chemical Plants, Commercial and Institutional Facilities) |
| Regional Analysis | North America – US, Canada; Europe – Germany, France, The UK, Spain, Italy, Rest of Europe; Asia Pacific – China, Japan, South Korea, India, Australia, Singapore, Rest of APAC; Latin America – Brazil, Mexico, Rest of Latin America; Middle East & Africa – GCC, South Africa, Rest of MEA |
| Competitive Landscape | Synthite Industries Pvt. Ltd., Kalsec Inc., Plant Lipids Pvt. Ltd., MANE Kancor Ingredients Pvt. Ltd., Chenguang Biotech Group Co., Ltd., AVT Natural Products Ltd., Akay Natural Ingredients Pvt. Ltd., Universal Oleoresins Pvt. Ltd., Givaudan SA, PT Indesso Aroma, Ozone Naturals Pvt. Ltd., Paprika Oleo’s India Ltd., Vidya Herbs Pvt. Ltd., Jean Gazignaire S.A.S., Ungerer & Company |
| Customization Scope | Customization for segments, region/country-level will be provided. Moreover, additional customization can be done based on the requirements. |
| Purchase Options | We have three licenses to opt for: Single User License, Multi-User License (Up to 5 Users), Corporate Use License (Unlimited User and Printable PDF) |