


Report Overview
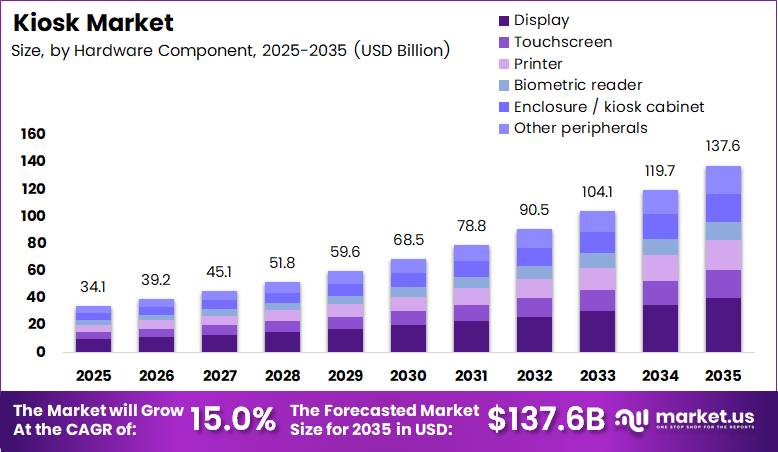
Global Kiosk Market size is expected to be worth around USD 137.6 Billion by 2035 from USD 34.1 Billion in 2025, growing at a CAGR of 15.0% during the forecast period 2026 to 2035.
The kiosk market spans self-contained, customer-facing terminal systems deployed across retail, banking, hospitality, healthcare, transportation, and government environments. These terminals integrate hardware components such as displays, touchscreens, printers, biometric readers, and enclosures with software platforms and managed services. Operators use them to automate routine transactions, reduce service queues, and collect structured customer data at the point of interaction.
Key Takeaways
- The Global Kiosk Market was valued at USD 34.1 Billion in 2025 and is forecast to reach USD 137.6 Billion by 2035, growing at a CAGR of 15.0% during the forecast period 2026 to 2035.
- By Component, Hardware dominates with a 56.00% share, reflecting the capital-intensive nature of physical terminal assembly across all deployment categories.
- By Hardware Component, Display holds the leading position at 29.00% share, as every kiosk transaction initiates at the screen surface regardless of application type.
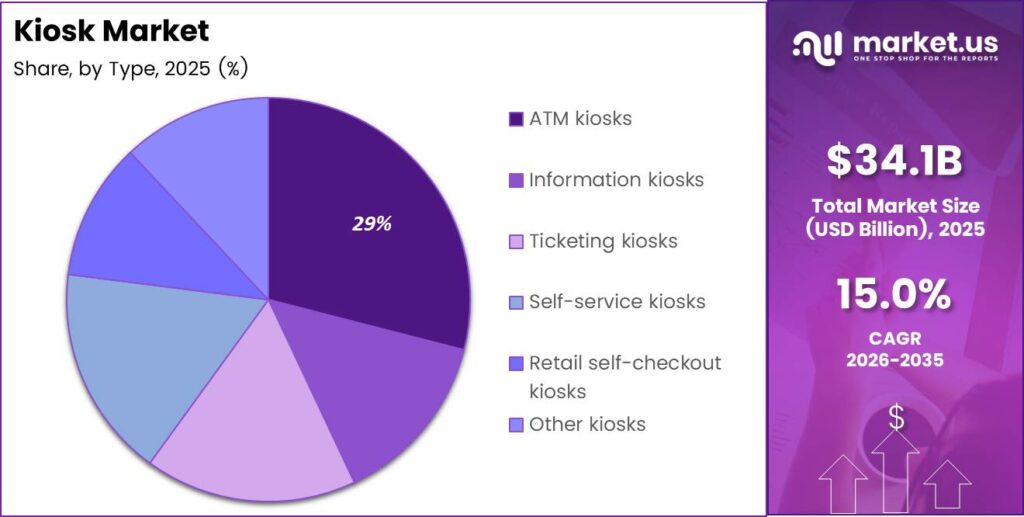
- By Type, ATM Kiosks account for the largest share at 29.00%, supported by sustained global dependency on physical cash-access infrastructure across banking and retail networks.
- By Deployment Location, Indoor Kiosks dominate with 72.00% share, driven by the concentration of high-footfall retail, banking, healthcare, and transit environments in controlled indoor settings.
- By Screen Size, the 17 to 32 inch range leads with 57.00% share, covering the primary transactional form factors used across QSR, retail, and healthcare check-in deployments.
- By End-Use Industry, Retail holds the largest share at 25.00%, where self-checkout and ordering kiosks address throughput bottlenecks and labor-cost pressures at scale.
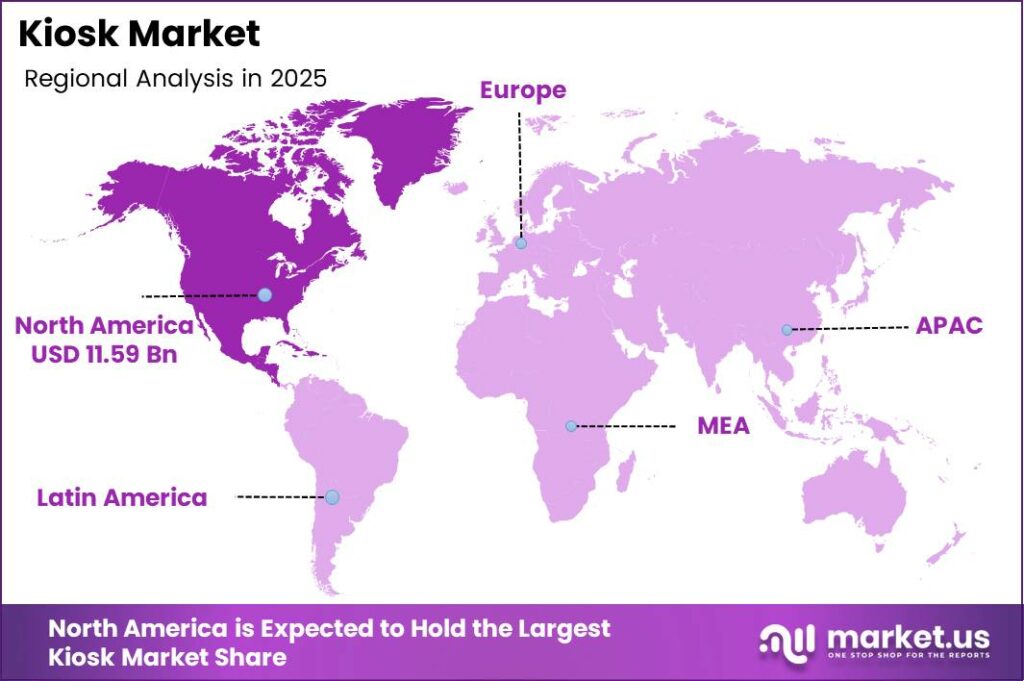
- By Region, North America dominates with a 34.00% share, valued at USD 11.59 Billion in 2025, supported by mature retail infrastructure and high kiosk adoption across banking and food-service sectors.
Government bodies across North America, Europe, and Asia-Pacific are actively deploying kiosks to automate public-sector services, including licensing, permit issuance, and transit ticketing. These deployments expand the addressable market beyond private-sector operators. Regulatory frameworks such as the European Accessibility Act are simultaneously shaping product design standards, pushing suppliers to embed accessible interfaces earlier in the development cycle rather than as aftermarket modifications.
As per our research, 76% of restaurant operators expected technology to give them a competitive edge in 2024. This consensus signals that kiosk procurement has shifted from discretionary spending to a baseline operational requirement in the food-service sector. Vendors that bundle software management tools with hardware can capture recurring revenue streams alongside initial unit sales rather than competing on hardware price alone.
GLORY’s subsidiary increased its ownership of Acrelec from 80% to 100% in November 2025, consolidating a specialized QSR kiosk software and hardware business under a single balance sheet. This consolidation reflects a broader strategic pattern where incumbent players absorb niche specialists to extend their software stack rather than build competing capabilities organically. Buyers evaluating multi-vendor kiosk ecosystems face a progressively more concentrated supplier landscape as a result.
Component Analysis
Hardware dominates with 56.00% due to high unit-cost physical integration requirements.
In 2025, Hardware held a dominant market position in the By Component segment of the Kiosk Market, with a 56.00% share. Physical terminal assemblies require enclosures, display panels, processors, input devices, and power systems before any software layer activates. The World Trade Organization reports that global trade in machinery and mechanical appliances exceeded USD 1.8 trillion in 2023, reflecting the deep industrial base that feeds component procurement. In February 2026, Advantech announced its DS-015 edge-AI computing platform for self-service kiosks, offering up to 157 TOPS of AI performance. Manufacturers that integrate high-performance compute at the hardware level command premium unit pricing and reduce the role of third-party software vendors in the value chain.
Software captures the recurring-revenue layer in kiosk deployments by controlling user interface logic, transaction processing, remote fleet management, and content scheduling. The OECD Digital Economy Outlook 2023 reported that business software investment grew faster than overall ICT investment in 22 of 38 OECD member countries between 2020 and 2022. Operators running large kiosk fleets depend on centralized software platforms to push firmware updates, monitor uptime, and reconfigure screens without physical site visits. Vendors that lock operators into proprietary software subscriptions convert one-time hardware sales into annuity contracts, which improves earnings predictability and raises switching costs for buyers.
Services cover installation, integration, preventive maintenance, remote monitoring, and break-fix field support across deployed kiosk fleets. The International Labour Organization’s World Employment and Social Outlook 2024 reported that services accounted for more than 50% of global employment, signaling sustained capacity for field-service delivery at scale. High-volume enterprise deployments across retail chains, airports, and healthcare networks generate predictable service contract volumes. Operators in regions with limited certified technician networks face longer mean-time-to-repair figures, which makes managed-service agreements from the original manufacturer a commercially rational choice over self-maintaining a distributed fleet.
Hardware Component Analysis
Display dominates with 29.00% due to screen-first user interaction design.
In 2025, Display held a dominant market position in the By Hardware Component segment of the Kiosk Market, with a 29.00% share. Every kiosk transaction begins at the display surface, making it the single non-negotiable hardware element regardless of application type. According to IATA’s 2025 Global Passenger Survey, 74% of travelers would share biometric information if doing so allowed them to avoid presenting a passport or boarding pass at airport checkpoints. This preference for frictionless authentication reinforces investment in display-integrated biometric interfaces at airport and transit kiosks. Manufacturers that pair high-resolution displays with embedded biometric capture modules reduce peripheral count and simplify enclosure design.
Touchscreen components sit at the intersection of the display and input layers, converting passive viewing surfaces into transaction interfaces. The ITU’s Measuring Digital Development: Facts and Figures 2023 reported that 73% of the global population used the internet in 2023, with smartphone penetration driving tactile interface familiarity across all age groups. Consumers accustomed to capacitive smartphone displays apply the same interaction expectations to public kiosks, creating commercial pressure on operators to deploy multi-touch PCAP panels rather than older resistive technologies. Vendors that standardize on high-sensitivity touch modules reduce customer-complaint rates and lower the volume of unproductive service-call dispatches per deployed unit.
Printers, biometric readers, enclosures, and other peripherals each serve defined transactional roles that determine kiosk eligibility for regulated environments. The International Organization for Standardization maintains more than 24,000 published standards, many of which govern peripheral performance in financial and healthcare self-service terminals. Enclosure and cabinet specifications directly affect ingress-protection ratings, which determine whether a unit qualifies for outdoor deployment or controlled indoor environments only. Buyers specifying kiosks for high-traffic or weather-exposed sites pay a measurable premium for enclosures that meet IP65 or higher ratings compared with standard indoor-grade cabinets.
Type Analysis
ATM kiosks dominate with 29.00% due to established global cash-infrastructure dependency.
In 2025, ATM kiosks held a dominant market position in the By Type segment of the Kiosk Market, with a 29.00% share. Cash remains a primary settlement instrument across large portions of Asia, Africa, Latin America, and rural developed-market communities. The Bank for International Settlements’ Statistics on Payment, Clearing and Settlement Systems 2023 reported more than 3.8 million ATMs in operation globally across reporting jurisdictions. Financial institutions that maintain dense ATM networks reduce branch dependency while serving customers who require physical cash access. Deployers in underbanked regions treat ATM kiosks as the lowest-friction entry point for financial-service delivery at scale.
Information kiosks, ticketing kiosks, and self-service kiosks collectively serve wayfinding, transaction initiation, and service access functions across government, transportation, hospitality, and retail environments. As reported by IATA’s 2025 Global Passenger Survey, 50% of passengers had used biometrics during their airport journey, up from 46% in 2024. This adoption rate indicates that ticketing and check-in kiosks increasingly function as biometric capture points rather than simple boarding-pass printers, raising both unit value and integration complexity. Airports and transit authorities that upgrade legacy ticketing hardware to biometric-capable terminals generate replacement volume across their entire installed base.
Retail self-checkout kiosks, vending kiosks, and other specialized kiosk types address distinct transaction categories where staff-assisted service creates throughput bottlenecks or margin pressure. The World Bank’s Enterprise Surveys report that labor cost as a share of operating expenditure consistently ranks among the top constraints cited by retailers in middle-income economies. Retail self-checkout deployments address this constraint directly by substituting capital for recurring wage expense at high-volume checkpoints. Operators that pair self-checkout hardware with loss-prevention analytics software reduce shrinkage exposure while recovering a portion of the technology investment through measurable theft reduction.
Deployment Location Analysis
Indoor kiosks dominate with 72.00% due to climate-controlled environment reducing hardware protection costs.
In 2025, Indoor kiosks held a dominant market position in the By Deployment Location segment of the Kiosk Market, with a 72.00% share. Retail centers, airports, hospitals, financial branches, and government offices provide the footfall concentration and controlled environments where kiosk economics are most favorable. The United Nations Department of Economic and Social Affairs reported that 57% of the global population lived in urban areas in 2023, with that share projected to reach 68% by 2050. Dense urban retail and transit infrastructure directly expands the addressable indoor deployment base. Operators in controlled indoor environments also face lower hardware maintenance costs because enclosures do not require weatherproofing upgrades.
Outdoor kiosks serve fuel stations, drive-throughs, transit stops, parking facilities, and public-space information points where indoor infrastructure is unavailable or commercially impractical. The International Energy Agency’s Global EV Outlook 2024 documented more than 40 million electric vehicles in active use globally, with associated public charging infrastructure creating new outdoor kiosk integration points for payment and session management. Outdoor deployments require IP65-rated or higher enclosures, extended operating-temperature components, and anti-glare display coatings that add between 15% and 30% to per-unit hardware cost compared with equivalent indoor configurations. Manufacturers that build modular outdoor-hardening kits compatible with existing indoor product lines reduce development cost while serving both deployment segments from a shared component inventory.
Screen Size Analysis
17 to 32 inches dominates with 57.00% due to optimal counter and floor-stand ergonomic fit.
In 2025, the 17 to 32 inches screen size held a dominant market position in the By Screen Size segment of the Kiosk Market, with a 57.00% share. This range covers the primary transactional workhorses across QSR, retail, banking, and healthcare check-in environments where screen real estate must balance readability with physical footprint constraints. Olea lists 32-, 42-, and 46-inch LCD configurations in its Milan Portrait interactive digital-signage kiosk, anchoring the upper boundary of this range as a commercially proven form factor. Advantech’s UTK-7000 platform supports 15.6-, 21.5-, and 23.8-inch screens, covering the mid-range where most counter-mount and floor-stand deployments concentrate. Buyers standardizing across large fleets favor this size range because panel supply is deepest and replacement lead times are shortest.
Screens up to 17 inches serve compact counter-mount applications such as payment terminals, signature pads, and assisted-service tablets in space-constrained retail and healthcare environments. Advantech’s UTC-300 series includes all-in-one touch computers with displays ranging from 7 to 21.5 inches, confirming active product development at the small-screen end of the kiosk hardware spectrum. The ITU reports that mobile broadband subscriptions exceeded 8.8 billion globally in 2023, creating a consumer base accustomed to small-screen interaction that transfers readily to compact kiosk formats. Operators deploying compact terminals in pharmacies, quick-service check-out lanes, and clinic waiting rooms benefit from lower per-unit acquisition cost while maintaining full transaction capability.
Screens above 32 inches serve wayfinding, digital signage, and high-visibility information display applications in airports, shopping centers, stadiums, and transit hubs where readability at distance is the primary design requirement. Elo’s 2794L open-frame touchscreen has a 27-inch display, positioning it at the boundary between mid-range transactional use and large-format display applications for vendors that need a flexible bridge product. Large-format kiosks carry higher panel procurement costs and require heavier structural enclosures, which increases total deployment cost per unit. Operators that combine large-format display capability with interactive transaction functions can monetize screen inventory through advertising or sponsorship revenue streams that partially offset hardware amortization.
End-Use Industry Analysis
Retail dominates with 25.00% due to high-volume checkout throughput automation requirements.
In 2025, Retail held a dominant market position in the By End-Use Industry segment of the Kiosk Market, with a 25.00% share. Self-checkout and assisted-service kiosks address the throughput bottleneck at the most capital-intensive point of the retail operating model. Data from the Census Bureau shows that U.S. e-commerce sales accounted for 16.4% of total retail sales in 2025, indicating that physical retail still processed the dominant share of transactions and maintained strong justification for in-store automation investment. Retailers expanding omnichannel fulfillment models are deploying kiosks as returns and recommerce stations alongside traditional checkout lanes. These dual-function deployments increase kiosk utilization rates and improve return on hardware investment per square foot of floor space.
The BFSI sector deploys kiosks as the primary physical interface for account servicing, cash recycling, and customer onboarding at locations where staffed branches are not economically viable. The IMF’s Financial Access Survey 2023 reported that commercial bank branch density in Sub-Saharan Africa averaged fewer than 5 branches per 100,000 adults, creating structural demand for unattended self-service terminals. Financial institutions that replace or supplement low-traffic branches with kiosk clusters reduce occupancy and staffing costs while preserving a physical service touchpoint for customers requiring cash or document-based transactions. Vendors offering integrated cash-recycling and biometric verification in a single enclosure compete for the highest-value BFSI contracts.
Food and beverage, healthcare, government, entertainment, IT and telecommunications, and education end-use sectors each deploy kiosks to automate high-volume, low-complexity service interactions that create staff bottlenecks. The WHO’s World Health Statistics 2024 reported a global average of 1.7 hospital beds per 1,000 people, indicating strained healthcare infrastructure that benefits directly from kiosk-mediated patient registration and appointment check-in. Government agencies that deploy kiosks for permit, license, and benefits access reduce queue wait times and extend service hours beyond staffed office availability. Vendors that design kiosks for cross-sector adaptability through configurable software and modular peripheral bays can serve multiple end-use verticals from a single certified hardware platform.
Key Market Segments
By Component
- Hardware
- Software
- Services
By Hardware Component
- Display
- Touchscreen
- Printer
- Biometric Reader
- Enclosure / Kiosk Cabinet
- Other Peripherals
By Type
- ATM Kiosks
- Information Kiosks
- Ticketing Kiosks
- Self-Service Kiosks
- Retail Self-Checkout Kiosks
- Vending Kiosks
- Other Kiosks
By Deployment Location
- Indoor Kiosks
- Outdoor Kiosks
By Screen Size
- Up to 17 Inches
- 17 to 32 Inches
- Above 32 Inches
By End-Use Industry
- Retail
- BFSI
- Food and Beverage
- Healthcare
- Government
- Entertainment
- IT and Telecommunications
- Education
- Other End-Use Industries
Regional Analysis
North America Dominates the Kiosk Market with a Market Share of 34.00%, Valued at USD 11.59 Billion
North America holds the largest share of the global kiosk market at 34.00%, valued at USD 11.59 Billion in 2025. The region’s mature retail infrastructure, dense banking networks, and high-volume quick-service restaurant sector create sustained procurement cycles across all major kiosk application categories. The Census Bureau’s Q2 2026 release estimated that U.S. retail e-commerce sales rose 12.2% year over year, reinforcing physical retailers’ urgency to deploy in-store automation that matches the speed and convenience of digital channels. Vendors that bundle managed-service agreements with hardware deployments capture recurring revenue tied to this expansion cycle. Advantech’s acquisition of AURES shares in October 2024 positioned the company to serve European and North American markets through a combined hardware portfolio.
Asia-Pacific represents the fastest-growing regional market, driven by rapid urbanization, rising airport passenger volumes, and government investment in smart-city infrastructure across China, India, and Southeast Asia. Middle Eastern airlines recorded a 6.7% increase in international passenger traffic measured in revenue passenger kilometers in 2025 compared with 2024, reflecting the broader aviation expansion across adjacent high-growth geographies. This passenger-traffic growth directly translates into airport kiosk procurement for check-in, baggage processing, and immigration automation. Governments across Asia-Pacific that mandate digital-first public service delivery create captive demand for government information and licensing kiosks that private-sector vendors cannot replicate through organic market development alone.
Latin America is an emerging growth corridor for the kiosk market, supported by internet penetration reaching 84% of the population in 2025. Digital infrastructure investment at this scale creates a consumer base capable of interacting with self-service terminals across retail, banking, and transit applications without significant digital-literacy barriers. The World Bank’s regional data confirms that connectivity coverage now extends into secondary cities and peri-urban zones, expanding the viable deployment geography beyond the largest metropolitan markets. Operators entering Latin America with localized payment integration and Spanish and Portuguese-language interfaces face lower competitive intensity than in saturated North American or Western European markets.
Key Regions and Countries
North America
- US
- Canada
Europe
- Germany
- France
- The UK
- Spain
- Italy
- Rest of Europe
Asia Pacific
- China
- Japan
- South Korea
- India
- Australia
- Rest of APAC
Latin America
- Brazil
- Mexico
- Rest of Latin America
Middle East and Africa
- GCC
- South Africa
- Rest of MEA
Market Dynamics
Market Opportunity Analysis - Underserved deployment categories and emerging regional markets offer structured entry points for focused kiosk vendors
Outdoor kiosk deployments remain underpenetrated relative to indoor installations, which held 72.00% of the market in 2025. The gap reflects higher per-unit hardware cost for weatherproofed enclosures rather than absence of demand. New entrants that develop modular outdoor-hardening kits compatible with existing indoor product architectures can address fuel stations, transit stops, and parking facilities without building entirely separate product lines. This approach reduces development cost while unlocking deployment categories that incumbent vendors have historically treated as premium-margin segments requiring proprietary hardware.
The BFSI sector in Sub-Saharan Africa and South Asia represents a structurally underserved kiosk opportunity where commercial branch economics cannot justify physical expansion. IMF Financial Access Survey data confirms that branch density in these regions falls below 5 branches per 100,000 adults in many markets. Vendors that design kiosks specifically for multi-provider shared-terminal deployment in these regions, with integrated cash-recycling and biometric verification, address a gap that neither mobile money nor conventional ATMs fully resolves. First movers that secure regulatory approval and local distribution partnerships face significantly lower competitive pressure than in mature North American or Western European banking markets.
The food and beverage end-use sector presents an organic expansion opportunity beyond the quick-service restaurant environments where kiosk penetration is already high. Casual dining, fast-casual, and entertainment venue food operators have lower current kiosk adoption rates but face the same labor-cost pressures that drove QSR deployments. Vendors that adapt existing QSR kiosk platforms for table-service and menu-complexity environments, using configurable software rather than new hardware development, can enter this adjacent segment at low incremental cost. The commercial case strengthens in markets where minimum wage legislation is accelerating, as these operators face the same margin pressure that drove initial QSR adoption.
The education and government end-use sectors collectively represent underexploited volume for information and licensing kiosks. Government agencies that deploy kiosks for permit issuance, benefits access, and licensing reduce staff workload at high-volume service counters while extending service availability beyond staffed operating hours. Education institutions that deploy registration and payment kiosks reduce administrative staff dependency at enrollment and fee-collection peaks. Vendors that develop compliant, accessible interfaces meeting government procurement standards unlock procurement frameworks that generate predictable multi-year replacement cycles rather than opportunistic one-off sales.
Technology and Innovation Landscape - Edge-AI integration, advanced touch engineering, and high-speed printing redefine kiosk hardware performance standards
Edge-AI computing platforms are entering the kiosk hardware stack as discrete compute modules rather than cloud-dependent software features. Advantech’s DS-015 platform, announced in February 2026 with mass production scheduled for that month, delivers up to 157 TOPS of AI performance for betting, lottery, retail, and QSR self-service kiosks. This on-device performance level enables real-time facial authentication, dynamic menu personalization, and predictive inventory signaling without round-trip latency to a central server. Manufacturers that integrate edge-AI modules at the platform level create a hardware differentiation point that cannot be replicated by competitors running equivalent software on standard compute architectures.
Capacitive PCAP touchscreen technology has matured into the standard for high-traffic public kiosk interfaces, replacing resistive panels that degrade under sustained multipoint interaction. Elo’s 2794L open-frame touchscreen supports 10-touch operation in its TouchPro PCAP configuration and enables touch-through operation through up to 6 mm of additional cover glass. This cover-glass tolerance allows operators to add protective glazing over deployed units without replacing the touch module, reducing maintenance cost per incident for high-vandalism-risk environments. In October 2025, Zebra Technologies completed its acquisition of Elo Touch Solutions for USD 1.3 billion, signaling that enterprise mobility and kiosk hardware are converging under integrated technology portfolios.
Thermal receipt printing speed directly determines throughput capacity at high-volume kiosk deployments in retail, QSR, and ticketing environments. Epson’s EU-m30 kiosk thermal receipt printer supports printing speeds of up to 250 mm per second, according to its October 2021 product announcement. At that speed, a single printer unit processes receipts fast enough to clear queue backlogs at peak transaction periods without creating a peripheral bottleneck that undermines the throughput advantage of deploying a kiosk in the first place. Operators evaluating high-volume retail or event-ticketing deployments that specify printers below this performance threshold risk re-creating the staff-queue problem that the kiosk investment was intended to eliminate.
Hardware platform modularity is emerging as a core design principle that determines long-term total cost of ownership for enterprise kiosk buyers. Advantech launched the UTC-320SL in August 2025, a 21.5-inch all-in-one touch computer supporting 12th-, 13th-, and 14th-generation Intel Core processors with an IP65-rated front panel. Multi-generation processor compatibility within a single certified enclosure extends platform lifecycle and reduces the frequency of full hardware refreshes triggered by compute obsolescence alone. Buyers that specify modular platforms at initial procurement negotiate a measurable reduction in five-year total cost of ownership compared with closed architectures that require full unit replacement at each processor generation boundary.
Drivers
Persistent wage pressure in the restaurant sector directly improves the return-on-investment calculation for kiosk ordering terminals. The National Restaurant Association’s 2024 technology survey found that 65% of limited-service customers favored kiosk ordering and 63% favored kiosk payment. The same research placed limited-service labor costs at a median 31.7% of sales during 2024. These figures connect consumer acceptance with an already material operating expense, confirming that kiosk adoption reduces a real and measurable cost item rather than addressing a speculative preference. Operators that deploy ordering kiosks reduce front-counter staffing requirements without reducing service capacity, which supports multi-site procurement decisions at the enterprise level rather than single-unit trials.
| Driver | (~) % Impact on CAGR Forecast | Geographic Relevance | Impact Timeline |
|---|---|---|---|
| Restaurant labor-cost substitution | +0.80% | Global; strongest in North America and Western Europe | Short term (≤ 2 years) |
| Airport passenger-processing automation | +0.45% | Global aviation hubs; Gulf states and Asia-Pacific | Short term (≤ 2 years) |
| Retail checkout throughput optimization | +0.35% | North America, Europe, and developed Asia-Pacific | Short term (≤ 2 years) |
| Healthcare registration digitization | +0.25% | North America, Europe, and urban Asia-Pacific | Medium term (2–4 years) |
| Public-transport ticketing automation | +0.20% | Asia-Pacific, Europe, and major emerging-market cities | Medium term (2–4 years) |
Restraints
The European Accessibility Act creates a present market-access barrier for noncompliant covered self-service terminals in the European Union. Requirements apply from June 28, 2025 to newly marketed payment terminals and specified ticketing, check-in, and information terminals. Qualifying terminals already in use before that date may continue operating until the end of their economically useful lives, capped at 20 years, while certain legacy service arrangements hold transitional protection through June 28, 2030. Suppliers must fund accessible interfaces, applicable physical-design changes, conformity assessment, and documentation before recognizing associated revenue. This compresses margins and delays product launches for any covered terminal in the European market, regardless of underlying customer demand.
| Restraint | (~) % Impact on CAGR Forecast | Geographic Relevance | Impact Timeline |
|---|---|---|---|
| Accessibility-related market-access restrictions | -0.45% | European Union; exporters supplying covered terminals | Short term (≤ 2 years) |
| Small-operator capital-rationing barriers | -0.30% | Global independent operators; financing-constrained economies | Short term (≤ 2 years) |
| Mobile-only service substitution | -0.25% | Digitally mature urban markets worldwide | Medium term (2–4 years) |
| Insufficient low-traffic site economics | -0.20% | Rural locations and low-volume independent outlets | Long term (≥ 4 years) |
| Biometric consent and purpose restrictions | -0.15% | European Union and privacy-sensitive jurisdictions | Short term (≤ 2 years) |
Challenges
Publicly accessible kiosks combine physical exposure with remote administration, network connectivity, and third-party software dependencies, creating a continuing security-management burden across deployed fleets. Verizon’s 2025 Data Breach Investigations Report analyzed more than 22,000 incidents and 12,195 confirmed breaches. Third parties featured in 30% of breaches, double the previous share, while credential abuse and vulnerability exploitation represented 22% and 20% of initial attack vectors. Operators maintaining large kiosk fleets must implement device identity management, network segmentation, and staged remote deployment to contain this exposure. Manufacturers that offer security-hardened platform software as a managed subscription convert a compliance burden into a recurring revenue stream.
| Challenge | (~) % CAGR Friction Drag | Geographic Relevance | Mitigation Horizon |
|---|---|---|---|
| Distributed Endpoint Security Exposure | -0.35% | Global connected kiosk fleets | Short term (≤ 2 years) |
| Legacy Application Integration Complexity | -0.25% | Global enterprise and public-sector installations | Medium term (2–4 years) |
| Peripheral Component Lifecycle Mismatches | -0.20% | Global manufacturers and systems integrators | Medium term (2–4 years) |
| Field Service Coverage Gaps | -0.15% | Emerging markets and geographically dispersed fleets | Medium term (2–4 years) |
| Outdoor Reliability Engineering Burdens | -0.10% | Tropical, coastal, desert, and cold-climate installations | Long term (≥ 4 years) |
Opportunities
Shared financial-access kiosks represent a conditional growth avenue in markets where financial institutions cannot justify dedicated branch infrastructure. The World Bank’s Global Findex 2025, drawing on 2024 data, reports global account ownership of 79%, with approximately 1.3 billion adults remaining unbanked. Nearly 900 million unbanked adults own a mobile phone, including 530 million with a smartphone. A shared terminal model serving multiple regulated providers improves transaction density at each site and reduces the fixed-cost allocation per transaction. Vendors that secure distribution agreements and cash-handling arrangements in underserved South Asian and Sub-Saharan African markets capture first-mover positioning in a segment that bank-branch economics cannot replicate.
| Opportunity | (~) % Potential CAGR Upside | Geographic Relevance | Execution Window |
|---|---|---|---|
| Shared financial-access service kiosks | +0.45% | South Asia, Sub-Saharan Africa, and underserved emerging markets | Medium term (2–4 years) |
| Parcel returns and recommerce stations | +0.35% | North America, Europe, and urban Asia-Pacific | Medium term (2–4 years) |
| Industrial tool-dispensing kiosks | +0.30% | Manufacturing clusters worldwide | Medium term (2–4 years) |
| Hospitality equipment-rental kiosks | +0.25% | Tourism destinations and leisure venues worldwide | Medium term (2–4 years) |
| Specialist configuration-software licensing | +0.15% | Global franchise networks and equipment manufacturers | Long term (≥ 4 years) |
Key Company Insights
NCR Voyix Corporation positions itself as an end-to-end commerce platform provider rather than a hardware vendor, combining point-of-sale software, payment processing, and managed services across retail and food-service environments. In July 2026, the company announced an exclusive platform agreement with Pizza Ranch, covering planned implementation of Aloha Next and Voyix Pay at more than 200 restaurants with rollout beginning in 2027. This pipeline secures future installation and recurring software revenue simultaneously. Operators evaluating enterprise kiosk programs gain a single-vendor accountability structure, but face concentration risk if NCR Voyix’s software roadmap diverges from their operational requirements.
Diebold Nixdorf, Incorporated concentrates on branch automation and ATM network modernization for financial institutions, competing on cash-recycling technology depth and fleet-management software rather than broad kiosk application diversity. In May 2026, VyStar Credit Union selected its Branch Automation Solutions and began upgrading more than 200 ATMs with DN Series cash-recycling devices. GLORY reported consolidated revenue of ¥339,582 million and ¥214,314 million in merchandise and finished-goods revenue for the fiscal year ended March 31, 2026, reflecting the scale that large integrated kiosk and cash-management players bring to competitive bidding against Diebold Nixdorf in the BFSI segment. Diebold Nixdorf’s specialization creates depth in financial-terminal procurement but limits its ability to cross-sell into retail or hospitality kiosk categories without significant portfolio expansion.
Key Players
- NCR Voyix Corporation
- Diebold Nixdorf, Incorporated
- KIOSK Information Systems
- Meridian Kiosks
- GLORY Ltd. / Glory Global Solutions
- Advantech Co., Ltd.
- Zebra Technologies Corporation
- Fujitsu Limited
- GRG Banking Equipment Co., Ltd.
- Nautilus Hyosung, Inc.
- Acrelec Group
- Olea Kiosks Inc.
- REDYREF Interactive Kiosks
- Embross
- Frank Mayer and Associates, Inc.
Recent Developments
- October 1, 2026: NCR Voyix announced a multiyear enterprise agreement with Rutter’s to deploy Voyix Commerce Platform applications, payments capabilities, and managed services across Rutter’s 94 locations.
- April 2, 2026: Diebold Nixdorf announced that FOREX had gone live with Branch Automation Solutions for end-to-end ATM management across nearly 90 ATMs in Sweden, Norway, Finland, and Denmark.
- January 12, 2024: GLORY completed its acquisition of Flooid Topco Limited at an estimated total acquisition cost of approximately £169 million, including share consideration, loan refinancing, advisory fees, and specified tax assets payable upon future realization.
Geopolitical Impact Analysis
Shipping-route disruptions in the Red Sea have materially extended transit times and raised freight costs for kiosk component supply chains reliant on Asian manufacturing and European assembly hubs. As reported by UNCTAD’s Review of Maritime Transport 2024, tonnage transiting the Suez Canal fell by 70% by mid-2024, while Cape of Good Hope arrivals surged by 89% as vessels rerouted around Africa. UNCTAD reported that maritime ton-miles increased by approximately 6% in 2024 as rerouting lengthened journeys. Kiosk manufacturers sourcing display panels, processors, and enclosure materials from Southeast Asia face extended replenishment cycles that inflate working capital requirements and compress delivery commitments to enterprise buyers.
Trade fragmentation between major manufacturing economies introduces tariff and customs complexity across the global kiosk component network. UNCTAD confirms that more than 80% of world trade volume moves by sea, meaning that any sustained disruption to maritime routing raises input costs across the entire hardware stack simultaneously rather than isolating a single component category. The World Bank estimates that a 1% rise in trade costs reduces bilateral trade volumes by approximately 2% to 3% based on historical gravity-model analysis. Kiosk vendors that concentrate procurement in single-geography supplier networks face greater margin exposure to tariff escalation than those that have diversified assembly across multiple customs jurisdictions.
Report Scope
| Report Features | Description |
|---|---|
| Market Value (2025) | USD 34.1 Billion |
| Forecast Revenue (2035) | USD 137.6 Billion |
| CAGR (2026-2035) | 15.0% |
| Base Year for Estimation | 2025 |
| Historic Period | 2020-2024 |
| Forecast Period | 2026-2035 |
| Report Coverage | Revenue Forecast, Market Dynamics, Market Opportunity Analysis, Technology and Innovation Landscape, Competitive Landscape, Recent Developments |
| Segments Covered | By Component (Hardware, Software, Services), By Hardware Component (Display, Touchscreen, Printer, Biometric Reader, Enclosure / Kiosk Cabinet, Other Peripherals), By Type (ATM Kiosks, Information Kiosks, Ticketing Kiosks, Self-Service Kiosks, Retail Self-Checkout Kiosks, Vending Kiosks, Other Kiosks), By Deployment Location (Indoor Kiosks, Outdoor Kiosks), By Screen Size (Up to 17 Inches, 17 to 32 Inches, Above 32 Inches), By End-Use Industry (Retail, BFSI, Food and Beverage, Healthcare, Government, Entertainment, IT and Telecommunications, Education, Other End-Use Industries) |
| Regional Analysis | North America (US and Canada), Europe (Germany, France, The UK, Spain, Italy, and Rest of Europe), Asia Pacific (China, Japan, South Korea, India, Australia, and Rest of APAC), Latin America (Brazil, Mexico, and Rest of Latin America), Middle East and Africa (GCC, South Africa, and Rest of MEA) |
| Competitive Landscape | NCR Voyix Corporation, Diebold Nixdorf Incorporated, KIOSK Information Systems, Meridian Kiosks, GLORY Ltd. / Glory Global Solutions, Advantech Co. Ltd., Zebra Technologies Corporation, Fujitsu Limited, GRG Banking Equipment Co. Ltd., Nautilus Hyosung Inc., Acrelec Group, Olea Kiosks Inc., REDYREF Interactive Kiosks, Embross, Frank Mayer and Associates Inc. |
| Customization Scope | Customization for segments, region / country-level will be provided. Additional customization can be done based on requirements. |
| Purchase Options | We have three licenses to opt for: Single User License | Multi-User License (Up to 5 Users) | Corporate Use License (Unlimited User and Printable PDF) |





































