


Report Overview
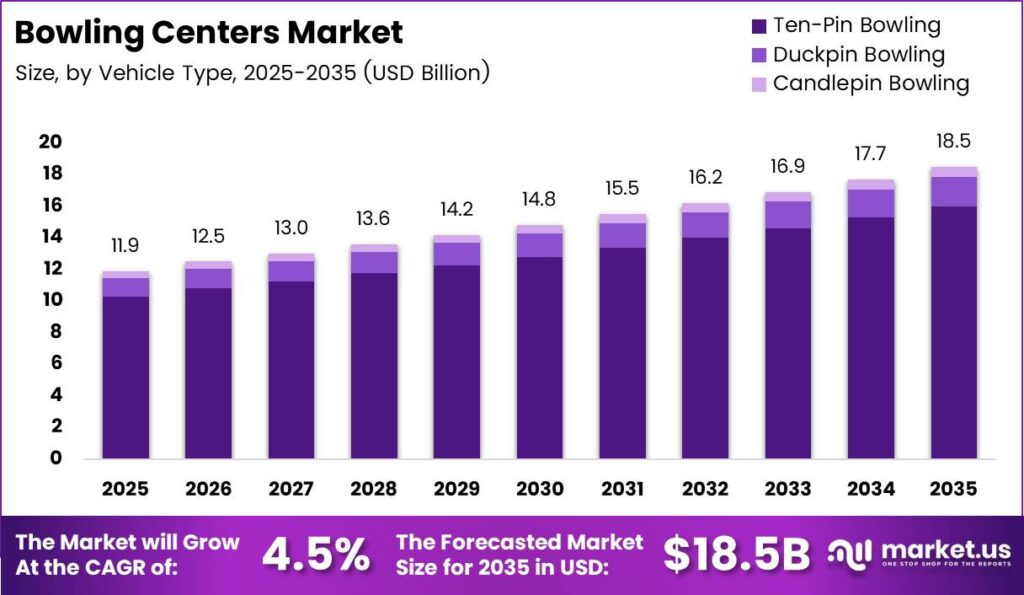
Global Bowling Centers Market size is expected to be worth around USD 18.5 Billion by 2035 from USD 11.9 Billion in 2025, growing at a CAGR of 4.5% during the forecast period 2026 to 2035. This steady climb reflects a durable shift toward out-of-home social leisure. Operators who modernize lanes and diversify revenue will capture the widening gap between casual and premium demand.
Bowling centers combine lane-based recreation with food, beverage, and entertainment services under one roof. The market spans traditional alleys, boutique lounges, and integrated Family Entertainment Centers Market that bundle arcades and dining. This structure means revenue no longer depends on lane play alone. Therefore operators treat lanes as anchors that pull higher-margin ancillary spend across every visit.
Key Takeaways
- Global market size reaches USD 18.5 Billion by 2035, up from USD 11.9 Billion in 2025 at a CAGR of 4.5%.
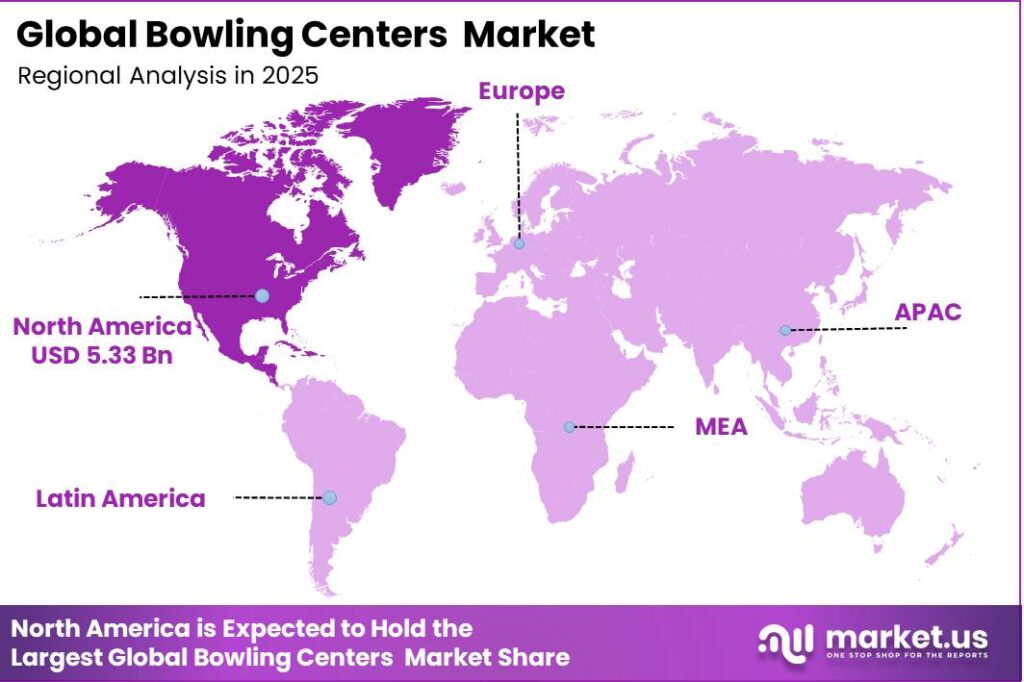
- North America leads with a 44.60% share, valued at USD 5.33 Billion.
- Traditional Bowling Centers dominate Center Type with a 42.80% share.
- Ten-Pin Bowling leads Bowling Type with an 86.40% share.
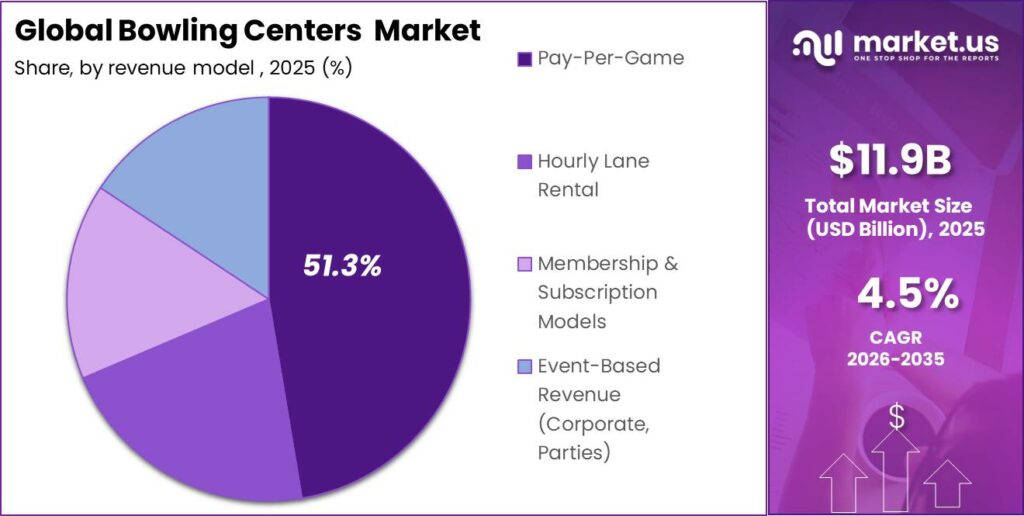
- Pay-Per-Game leads Revenue Model with a 51.30% share.
- Casual Players lead End User with a 64.20% share.
- Adults aged 25 to 44 lead Age Group with a 39.70% share.
- Indoor Bowling Centers lead Facility Type with a 91.20% share.
- Bowling Only Facilities lead Service Offering with a 37.50% share.
- Traditional Scoring Systems lead Technology Integration with a 58.10% share.
- Walk-In Customers lead Distribution Channel with a 62.40% share.
Government-backed urban redevelopment programs increasingly zone high-footfall retail districts for leisure anchors, and bowling venues qualify as family-friendly tenants. This zoning support lowers the entry barrier for boutique operators seeking prime locations. As a result, developers court multi-lane venues to raise dwell time and drive spillover spending across adjacent retail and dining tenants.
Rising participation in organized recreation lifts weekday lane demand across the sector. As per our research, U.S. bowling centers operate an average of 90 operating hours per week per facility in 2026, showing heavy fixed-capacity needs. This means idle daytime lanes carry the same overhead as peak hours. Operators who fill weekday slots with leagues convert unused capacity directly into margin.
End-use demand from corporate events and family outings pushes centers toward flexible layouts. As per our research, staff turnover in bowling centers reaches 45% annually in 2026 workforce reports, straining service consistency. This churn raises training costs and slows lane turnaround during peak demand. Therefore centers investing in automation and cross-training protect the group-booking revenue that increasingly funds expansion.
Center Type Analysis
Traditional Bowling Centers dominate with 42.80% due to established fixed-lane recreational footprints.
In 2025, Traditional Bowling Centers held a dominant market position in the By Center Type segment of Bowling Centers Market, with a 42.80% share. As per maket.us industry data, roughly 3,400 bowling centers operate across the United States, forming a stable base for global benchmarking. This installed footprint gives incumbents scale advantages. Operators with legacy lanes can amortize fixed costs faster than new entrants building from scratch.
Entertainment Bowling centers integrate arcade and food services to broaden per-visit spend. Data from Fly Bowling shows total revenue per lane hour reaches $55 to $90 in high-performing entertainment centers, including food and add-ons. This wide spread rewards diversified formats over game-only sites. Consequently investors favor entertainment conversions that lift blended margins beyond what pure lane play delivers.
Boutique Bowling Lanes target premium urban leisure with curated design and smaller footprints. As per Fly Bowling benchmarks, base play revenue per lane hour runs $35 to $55 before food and beverage. This premium positioning supports higher pricing per lane. Operators who anchor boutique venues in dense districts extract stronger yields from limited lane counts.
Family Entertainment Centers and Professional Tournament Alleys hold the remaining share collectively. Figures from Legal Clarity show top operations generate $36,000 to $45,000 revenue per lane per year in modern facilities. This benchmark separates viable formats from underperformers. Therefore both niche formats compete on programming depth rather than raw lane volume.
Bowling Type Analysis
Ten-Pin Bowling dominates with 86.40% due to universal equipment and rule standardization.
In 2025, Ten-Pin Bowling held a dominant market position in the By Bowling Type segment of Bowling Centers Market, with an 86.40% share. As per data, the average bowling center contains 32 lanes per facility, and nearly all are configured for ten-pin play. This standardization simplifies equipment sourcing. Operators benefit from interchangeable pinsetters and consistent maintenance supply chains across venues.
Duckpin Bowling serves regional heritage markets with smaller pins and no thumb holes. As per Legal Clarity operations data, centers need minimum 50% lane utilization for profitable operations. This threshold challenges niche formats with narrow audiences. Duckpin operators must concentrate in loyal local markets to clear the break-even bar.
Candlepin and Nine-Pin Bowling hold the remaining share collectively across concentrated regional pockets. Figures from Legal Clarity show peak utilization targets of 60% or higher during busy hours for healthy returns. This means niche pin formats survive only where dense fan communities exist. Therefore expansion beyond heritage regions rarely justifies the specialized equipment cost.
Revenue Model Analysis
Pay-Per-Game dominates with 51.30% due to simple transparent per-visit pricing.
In 2025, Pay-Per-Game held a dominant market position in the By Revenue Model segment of Bowling Centers Market, with a 51.30% share. As per maket.us data, industry-wide lane utilization averages around 55% during peak seasons in 2026, exposing large unused capacity. This gap favors flexible per-game pricing. Operators can layer surcharges on peak games while discounting off-peak slots to fill lanes.
Hourly Lane Rental appeals to groups seeking predictable session costs. Data from Fly Bowling shows base play revenue per lane hour reaches $55 at the upper end before extras. This ceiling rewards operators who convert rentals into extended stays. Bundling food with hourly blocks lifts total spend well past the base rate.
Membership Models and Event-Based Revenue hold the remaining share collectively. As per maket.us workforce data, staffing volatility disrupts service during high-demand corporate events. This means event revenue depends on reliable operations staffing. Therefore centers that stabilize teams win repeat corporate and party bookings that carry premium margins.
End User Analysis
Casual Players dominate with 64.20% due to low-commitment recreational bowling appeal.
In 2025, Casual Players held a dominant market position in the By End User segment of Bowling Centers Market, with a 64.20% share. As per Legal Clarity revenue data, modern centers generate $36,000 to $45,000 per lane per year, largely from casual walk-in play. This base funds fixed costs. Operators who convert casual visitors into repeat groups stabilize the year-round revenue floor.
Families and Groups drive higher per-visit spend through multi-person bookings and food orders. As per Fly Bowling data, total revenue per lane hour climbs to $90 in high-performing centers serving group demand. This premium rewards family-oriented layouts. Centers that add kid-friendly zones capture the fastest-growing visitor cohort.
Professional Bowlers and Corporate Clients hold the remaining share collectively. Figures from maket.us show top-tier centers achieve $51,000 per lane per year in 2026 high-performance operations. This peak depends on premium bookings from leagues and firms. Therefore centers courting these segments justify investment in tournament-grade lane conditioning.
Age Group Analysis
Adults aged 25 to 44 dominate with 39.70% due to strong discretionary leisure spending.
In 2025, Adults aged 25 to 44 held a dominant market position in the By Age Group segment of Bowling Centers Market, with a 39.70% share. As per Fly Bowling benchmarks, revenue per lane hour spans $35 to $55 in base play driven by this cohort. This spending power anchors evening demand. Operators schedule adult leagues to lock in reliable weekday revenue.
Youth and Teenagers drive fast-growing weekend and after-school traffic. As per maket.us data, centers run 90 operating hours weekly, leaving wide afternoon slots for youth programming. This open capacity suits school leagues. Centers that court teen groups fill otherwise idle daytime lanes profitably.
Children and Seniors hold the remaining share collectively across off-peak periods. As per Legal Clarity data, break-even needs 50% utilization, which these cohorts help sustain midweek. This means family and senior sessions smooth demand curves. Therefore inclusive programming protects margins during traditionally weak dayparts.
Facility Type Analysis
Indoor Bowling Centers dominate with 91.20% due to climate-controlled year-round operating reliability.
In 2025, Indoor Bowling Centers held a dominant market position in the By Facility Type segment of Bowling Centers Market, with a 91.20% share. As per maket.us data, the average facility runs 32 lanes indoors under controlled conditions. This consistency protects lane surfaces and scoring gear. Operators avoid weather-driven closures that would erode fixed-cost recovery.
Outdoor and Hybrid Bowling Venues serve experiential and seasonal leisure niches. As per Legal Clarity data, peak utilization targets of 60% govern profitability across all formats. This benchmark pressures weather-exposed venues. Hybrid operators must concentrate demand into favorable seasons to clear return thresholds.
Service Offering Analysis
Bowling Only Facilities dominate with 37.50% due to focused low-complexity operational models.
In 2025, Bowling Only Facilities held a dominant market position in the By Service Offering segment of Bowling Centers Market, with a 37.50% share. As per Legal Clarity data, these centers earn $36,000 to $45,000 per lane yearly from focused play. This simplicity lowers staffing complexity. Operators run lean teams that protect margins in price-sensitive markets.
Multi-Entertainment Centers combine bowling with arcade and food to lift per-capita spend. As per Fly Bowling data, blended revenue per lane hour reaches $90 in these diversified sites. This uplift rewards format expansion. Investors channel capital toward mixed-use conversions that outperform single-purpose venues.
Sports Training and Coaching Facilities hold the remaining share serving skill-focused bowlers. As per maket.us data, top centers reach $51,000 per lane yearly, partly through premium coaching. This premium justifies specialized equipment. Therefore training-focused sites monetize expertise rather than volume alone.
Technology Integration Analysis
Traditional Scoring Systems dominate with 58.10% due to widespread legacy installed infrastructure.
In 2025, Traditional Scoring Systems held a dominant market position in the By Technology Integration segment of Bowling Centers Market, with a 58.10% share. As per maket.us data, roughly 3,400 U.S. centers operate on largely legacy scoring backbones. This entrenched base slows replacement cycles. Operators upgrade selectively as budgets allow rather than replacing systems wholesale.
Automated Scoring and Digital Displays streamline lane turnover and reduce staff workload. As per maket.us data, staff turnover of 45% annually pressures operators toward automation. This churn raises the value of self-service tech. Centers that digitize scoring cut dependence on scarce trained labor.
AR/VR Enhanced Experiences and Mobile App Booking hold the remaining share collectively. As per Fly Bowling data, high-tech centers push revenue per lane hour toward $90 through immersive add-ons. This premium rewards innovation investment. Therefore early tech adopters differentiate on experience where price competition intensifies.
Distribution Channel Analysis
Walk-In Customers dominate with 62.40% due to spontaneous unplanned recreational visit behavior.
In 2025, Walk-In Customers held a dominant market position in the By Distribution Channel segment of Bowling Centers Market, with a 62.40% share. As per maket.us data, centers run 90 weekly hours to capture unplanned foot traffic. This wide availability suits spontaneous visits. Operators staff flexibly to absorb unpredictable walk-in surges without losing sales.
Online Booking Platforms let customers reserve lanes and pre-pay for peak slots. As per Legal Clarity data, 50% minimum utilization defines profitability, which pre-booking helps secure. This means digital reservations lock in demand early. Centers that push online booking smooth peak crowding and reduce turn-away losses.
Corporate Contracts and Event Bookings hold the remaining share collectively. As per Fly Bowling data, event-heavy centers reach $90 revenue per lane hour with bundled services. This premium rewards structured group sales. Therefore dedicated event teams convert contracts into the highest-yield lane hours.
Key Market Segments
By Center Type
- Traditional Bowling Centers
- Entertainment Bowling (Arcade + F&B Integrated)
- Boutique Bowling Lanes
- Family Entertainment Centers (FECs)
- Professional / Tournament Bowling Alleys
By Bowling Type
- Ten-Pin Bowling
- Duckpin Bowling
- Candlepin Bowling
- Nine-Pin Bowling
By Revenue Model
- Pay-Per-Game
- Hourly Lane Rental
- Membership & Subscription Models
- Event-Based Revenue (Corporate, Parties)
By End User
- Casual Players
- Families & Groups
- Professional Bowlers
- Corporate Clients
By Age Group
- Adults (25–44 Years)
- Youth & Teenagers
- Children
- Seniors
By Facility Type
- Indoor Bowling Centers
- Outdoor/Hybrid Bowling Venues
By Service Offering
- Bowling Only Facilities
- Multi-Entertainment Centers (Bowling + Arcade + Food & Beverage)
- Sports Training & Coaching Facilities
By Technology Integration
- Traditional Scoring Systems
- Automated Scoring & Digital Displays
- AR/VR Enhanced Bowling Experiences
- Mobile App-Based Booking Systems
By Distribution Channel (Booking)
- Walk-In Customers
- Online Booking Platforms
- Corporate Contracts & Event Bookings
Regional Analysis
North America Dominates the Bowling Centers Market with a Market Share of 44.60%, Valued at USD 5.33 Billion
North America leads the Bowling Centers Market with a 44.60% share, valued at USD 5.33 Billion. As per maket.us data, roughly 3,400 centers operate across the United States on a dense installed base. This scale anchors regional dominance. Operators leverage mature supply chains and high per-lane yields that newer regions cannot yet match.
Asia-Pacific ranks as the fastest-growing region as urban leisure demand expands. As per Legal Clarity data, centers require 50% utilization to profit, a bar rising APAC footfall increasingly clears. This means new urban venues reach viability faster. Investors target secondary APAC cities where Leisure and Entertainment Market demand outpaces existing lane supply.
Europe, Latin America, and the Middle East and Africa hold the remaining regional share collectively. As per Fly Bowling data, blended revenue per lane hour can reach $90 in modern entertainment formats these regions are adopting. This upside rewards format upgrades. Therefore operators in these markets prioritize integrated venues over standalone lanes.
Key Regions and Countries
North America
- US
- Canada
Europe
- Germany
- France
- The UK
- Spain
- Italy
- Rest of Europe
Asia Pacific
- China
- Japan
- South Korea
- India
- Australia
- Rest of APAC
Latin America
- Brazil
- Mexico
- Rest of Latin America
Middle East and Africa
- GCC
- South Africa
- Rest of MEA
Market Dynamics
Market Opportunity Analysis - Underserved formats, off-peak windows, and emerging regions offer entry points for new operators
Entertainment Bowling stands out as underexploited despite Traditional Centers holding 42.80% of the Center Type segment. This means most existing footprint still runs game-only formats with lower per-visit spend. New entrants building integrated venues capture demand that legacy alleys cannot serve. Therefore first movers in mixed-use conversions face limited direct competition in many local markets.
Weekday and daytime capacity remains widely underused, with peak-season utilization averaging just 55%. This gap signals idle lanes carrying full overhead outside busy hours. Operators targeting Youth and Teenagers, the fastest-growing age cohort, can fill afternoon slots profitably. Consequently youth leagues and school programming convert dead capacity into a defensible revenue stream.
Online Booking Platforms stay minor against Walk-In Customers at 62.40% of bookings. This reliance on spontaneous traffic leaves peak demand poorly managed. Operators adopting digital reservations secure high-value slots before arrival. By contrast, centers ignoring online channels forfeit yield control that competitors increasingly weaponize.
Asia-Pacific, Latin America, and the Middle East and Africa remain underpenetrated against North America’s 44.60% regional lead. This imbalance points to open runway in secondary cities lacking modern lanes. Investors entering these markets early establish brand presence before saturation. As a result, suburban and secondary-city expansion offers the clearest long-term entry opportunity.
Technology and Innovation Landscape - Automation, immersive formats, and connected systems reshape lane economics
Automated pinsetter systems and AI-driven scoring platforms cut per-lane operational downtime across modern centers. This automation directly addresses the 45% annual staff turnover straining service consistency. Operators deploying these systems reduce dependence on scarce technical labor. Therefore centers that automate scoring protect uptime while lowering the cost per labor hour.
Immersive LED cosmic bowling environments pair synchronized lighting with music to lift experiential value. This upgrade supports premium pricing that pushes revenue per lane hour toward the $90 ceiling in top venues. Operators differentiate on atmosphere where price competition intensifies. As a result, sensory-rich formats convert casual visits into higher-margin group outings.
IoT-enabled lane monitoring systems track oil patterns and pinsetter health for predictive maintenance. This capability keeps lanes at competitive league standards while avoiding costly breakdowns. Operators cut unplanned downtime that would otherwise erode utilization. Consequently connected maintenance shifts spending from reactive repairs toward planned efficiency.
Mobile-first booking ecosystems add dynamic lane pricing and membership-based access. This tech targets the reliance on Walk-In Customers by capturing demand digitally before arrival. Operators smooth peak crowding and stabilize off-peak traffic through app-driven offers. Therefore mobile platforms turn scattered demand into managed, higher-yield lane hours.
Drivers
Household recreation spending since 2022 shows out-of-home entertainment growing 3 to 6 percentage points faster per year than total consumer spending. Many bowling chains report weekend lane utilization back at 70 to 90% of capacity during peak hours. This rebound reflects pent-up demand for group social outings. Operators using daypart pricing can lift revenue per lane hour by 10 to 20%.
Higher visit frequency compounds the recovery across active customers. This means a shift from 3 to 4 visits toward 4 to 5 visits per year materially raises throughput. Combined with rising spend per visit, this trend adds roughly +1.8% above the baseline CAGR of 4.5%. Therefore centers restoring full operational throughput capture the strongest near-term growth.
| Driver | (~) % Impact on CAGR Forecast | Geographic Relevance | Impact Timeline |
|---|---|---|---|
| Post-pandemic rebound in out-of-home social and family entertainment | +1.8% | North America, Europe, Asia-Pacific | Short term (≤ 2 years) |
| Conversion of legacy alleys into full-service family entertainment centers | +1.3% | Global | Medium term (2–4 years) |
| Growing corporate events and team-building demand for lane-based venues | +0.9% | North America, Europe | Short term (≤ 2 years) |
| Rising youth-league and school participation in organized bowling | +0.7% | Global | Medium term (2–4 years) |
| Technology upgrades such as automated scoring, dynamic lanes, and immersive lighting | +0.5% | Global | Medium term (2–4 years) |
Restraints
Bowling centers occupy large footprints of 20,000 to 40,000 square feet with energy-intensive equipment and long leases. This structure pushes fixed costs above half of total operating expenses in many markets. Urban rent escalators of 3 to 5% per year plus double-digit utility increases since 2021 have compressed EBITDA margins by several points. Operators face rising overhead they cannot easily cut.
Break-even often needs 50 to 60% lane utilization across a week at current prices. This means any sustained traffic dip from seasonality or economic softness can push sites into losses. Weaker centers defer capital upgrades or close rather than absorb rising overhead. Consequently this pressure subtracts an estimated -1.5% from the baseline CAGR of 4.5%.
| Restraint | (~) % Impact on CAGR Forecast | Geographic Relevance | Impact Timeline |
|---|---|---|---|
| High fixed operating costs for large-format centers (rent, utilities, maintenance) | -1.5% | North America, Europe, urban Asia | Short term (≤ 2 years) |
| Competition from diversified family entertainment formats and at-home digital gaming | -1.2% | Global | Medium term (2–4 years) |
| Zoning, alcohol-licensing, and late-hour operating restrictions in some municipalities | -0.9% | Europe, North America | Medium term (2–4 years) |
| Aging lane and pinsetter infrastructure requiring large upfront refurbishment CapEx | -0.8% | Global | Long term (≥ 4 years) |
| Sensitivity of discretionary entertainment spend to macroeconomic slowdowns | -0.7% | Global | Short term (≤ 2 years) |
Challenges
Bowling centers depend on hourly service staff, bar teams, and technicians for pinsetters and lane conditioning. Industry surveys show labor commonly runs 25 to 35% of revenue while turnover exceeds 50 to 70% annually in some regions. This churn forces constant recruitment and training. Wage inflation since 2021 has raised cost per labor hour by roughly 10 to 20%.
Rising service expectations leave little room to cut staffing without hurting the experience. This structural dependency imposes an estimated friction drag of about -1.4% on maximum growth. Therefore operators over the next 2 years test automated check-in, simplified menus, and cross-training. These moves raise revenue per labor hour instead of adding headcount with every new lane.
| Challenge | (~) % CAGR Friction Drag | Geographic Relevance | Mitigation Horizon |
|---|---|---|---|
| Labor intensity and staffing volatility for front-of-house and technical roles | -1.4% | Global | Short term (≤ 2 years) |
| Maintaining lane conditions and equipment uptime to competitive league standards | -1.1% | Global | Medium term (2–4 years) |
| Underutilization of weekday and daytime capacity | -1.0% | Global | Medium term (2–4 years) |
| Fragmented ownership structure limiting brand-scale marketing efficiency | -0.8% | Global | Long term (≥ 4 years) |
| Data and analytics gaps in pricing, promotions, and lane-yield optimization | -0.7% | Global | Medium term (2–4 years) |
Opportunities
Converting traditional alleys into multiproduct family entertainment centers with arcades, laser tag, and upgraded kitchens raises average spend per visit. This shift moves per-person tickets from $10 to $15 toward total spend of $25 to $40 or more. Food and beverage can climb from under one-third to over half of revenue. Early adopters report EBITDA margins improved by 3 to 5 percentage points.
This mix shift also smooths utilization across dayparts by targeting families, teens, and corporate groups. This means a successful conversion by 15 to 25% of existing centers globally over 2 to 4 years lifts sector economics. The resulting gain adds roughly +1.7% to the baseline CAGR of 4.5%. Therefore operators grow revenue without proportional increases in installed lanes.
| Opportunity | (~) % Potential CAGR Upside | Geographic Relevance | Execution Window |
|---|---|---|---|
| Integrated bowling-anchored family entertainment centers with diversified revenue streams | +1.7% | North America, Europe, Asia-Pacific | Medium term (2–4 years) |
| Dynamic pricing and lane-yield management using real-time demand data | +1.3% | Global | Short term (≤ 2 years) |
| Subscription and membership models offering bundled games, leagues, and F&B perks | +1.0% | Global | Medium term (2–4 years) |
| Esports-style competitive formats and hybrid digital-physical bowling experiences | +0.9% | Global | Long term (≥ 4 years) |
| Expansion into underpenetrated secondary cities and suburban retail parks | +0.8% | Asia-Pacific, Latin America, Middle East&Africa | Long term (≥ 4 years) |
Key Company Insights
The Bowling Centers Market remains structurally fragmented, with independent operators controlling most of the roughly 3,400 U.S. centers cited by maket.us. This fragmentation limits brand-scale marketing efficiency and leaves room for consolidation. Operators that reach multi-site scale gain purchasing power on pinsetters and lane conditioning supplies. As a result, larger chains defend margin more effectively than single-site owners facing rising fixed costs.
Format-focused operators build advantage through diversified entertainment revenue rather than lane volume alone. As per Fly Bowling data, blended revenue per lane hour reaches $90 in high-performing integrated centers. This premium rewards food, beverage, and arcade integration over game-only sites. Therefore operators investing in mixed-use conversions create a durable edge, while those relying on legacy lanes risk margin erosion as overhead climbs.
Key Players
- Bowlero Corporation
- AMF Bowling Centers
- Brunswick Corporation
- Lucky Strike Entertainment
- Main Event Entertainment
- Round1 Bowling & Amusement
- Dave & Buster’s Inc.
- Hollywood Bowl Group
- Ten Entertainment Group
- QubicaAMF Worldwide
- Steltronic
- V1 Entertainment Group
- Bowling Vision
- Strike Ten Entertainment
- Pins Mechanical Co.
Recent Developments
- 2026: U.S. bowling centers operate an average of 90 operating hours per week per facility, signaling high fixed-capacity utilization requirements across the sector.
- 2026: Industry-wide lane utilization averages around 55% during peak seasons, showing meaningful unused capacity even in active periods.
- 2026: Top-tier bowling centers achieve $51,000 per lane per year in high-performance operations, setting a benchmark for modern format economics.
- 2026: Staff turnover in bowling centers reaches 45% annually in workforce reports, pushing operators toward automation and cross-training.
Geopolitical Impact Analysis
According to the WTO, global merchandise trade growth slowed to roughly 2.7% in recent forecasts as tariff tensions widened. Bowling centers depend on imported pinsetters, synthetic lanes, and scoring electronics exposed to these frictions. The IMF projects global growth near 3.2%, pressuring discretionary leisure budgets. This means equipment procurement costs rise while consumer spending tightens, squeezing operators refurbishing aging lanes.
As reported by UNCTAD, container shipping rates spiked over 100% on key routes during recent Red Sea rerouting, adding weeks of transit delay. Bowling operators importing lane machinery face longer lead times and higher landed costs. The IEA notes energy price volatility keeps utility bills elevated for large-footprint venues. Consequently centers absorb both freight and energy inflation, delaying capital upgrades and expansion plans.
Report Scope
| Report Features | Description |
|---|---|
| Market Value (2025) | USD 11.9 Billion |
| Forecast Revenue (2035) | USD 18.5 Billion |
| CAGR (2026-2035) | 4.5% |
| Base Year for Estimation | 2025 |
| Historic Period | 2020-2024 |
| Forecast Period | 2026-2035 |
| Report Coverage | Revenue Forecast, Market Dynamics, Market Opportunity Analysis, Technology and Innovation Landscape, Competitive Landscape, Recent Developments |
| Segments Covered | By Center Type (Traditional Bowling Centers, Entertainment Bowling, Boutique Bowling Lanes, Family Entertainment Centers, Professional/Tournament Bowling Alleys), By Bowling Type (Ten-Pin, Duckpin, Candlepin, Nine-Pin), By Revenue Model (Pay-Per-Game, Hourly Lane Rental, Membership & Subscription, Event-Based Revenue), By End User (Casual Players, Families & Groups, Professional Bowlers, Corporate Clients), By Age Group (Adults 25-44, Youth & Teenagers, Children, Seniors), By Facility Type (Indoor, Outdoor/Hybrid), By Service Offering (Bowling Only, Multi-Entertainment Centers, Sports Training & Coaching), By Technology Integration (Traditional Scoring, Automated Scoring & Digital Displays, AR/VR Enhanced, Mobile App-Based Booking), By Distribution Channel (Walk-In, Online Booking, Corporate Contracts & Event Bookings) |
| Regional Analysis | North America (US and Canada), Europe (Germany, France, The UK, Spain, Italy, and Rest of Europe), Asia Pacific (China, Japan, South Korea, India, Australia, and Rest of APAC), Latin America (Brazil, Mexico, and Rest of Latin America), Middle East and Africa (GCC, South Africa, and Rest of MEA) |
| Competitive Landscape | Traditional Bowling Center Operators, Entertainment Bowling Chains, Boutique Bowling Lounge Operators, Family Entertainment Center Operators, Professional and Tournament Alley Operators |
| Customization Scope | Customization for segments, region / country-level will be provided. Additional customization can be done based on requirements. |
| Purchase Options | We have three licenses to opt for: Single User License | Multi-User License (Up to 5 Users) | Corporate Use License (Unlimited User and Printable PDF) |





































