


Report Overview
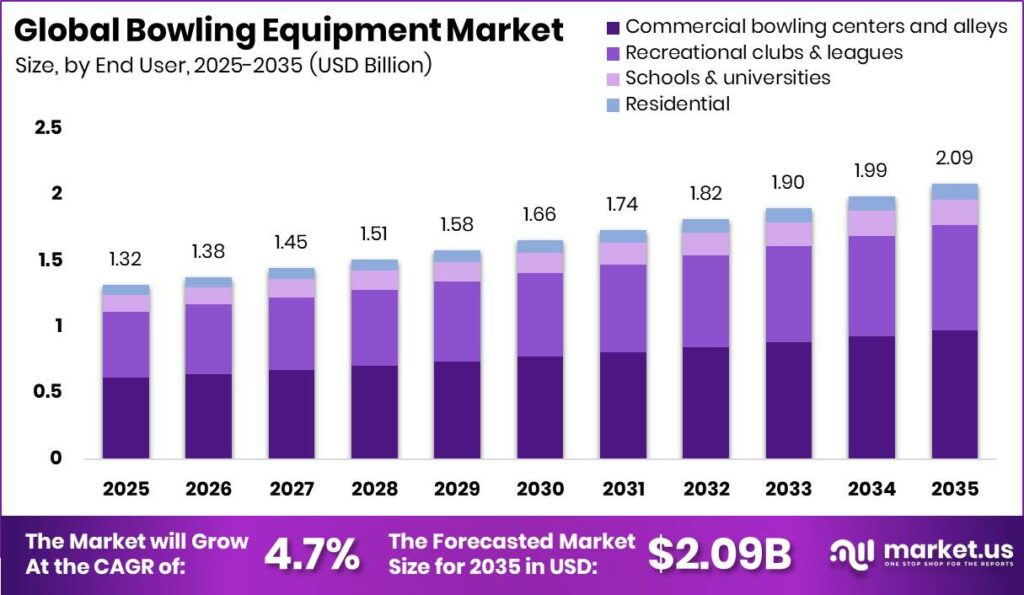
Global Bowling Equipment Market size is expected to be worth around USD 2.09 Billion by 2035 from USD 1.32 Billion in 2025, growing at a CAGR of 4.7% during the forecast period 2026 to 2035. This steady expansion signals reliable capital returns for manufacturers supplying lanes, pinsetters, and performance gear. Investors gain a stable, mid single digit growth market anchored by recurring venue upgrade cycles.
The Bowling Equipment Market covers hardware and consumables that power commercial and recreational bowling. Products span bowling balls, pins, shoes, accessories, and lane and scoring systems. Buyers range from entertainment operators to schools and home users. This structure links equipment demand to venue construction and refurbishment. Therefore, suppliers who serve both new builds and replacement cycles capture the widest revenue base across the value chain.
Key Takeaways
- Global Bowling Equipment Market reaches USD 1.32 Billion in 2025 and USD 2.09 Billion by 2035 at a CAGR of 4.7%.
- Bowling balls lead the By Product segment with a 32.1% share.
- Commercial bowling centers and alleys dominate the By End-user segment with a 46.7% share.
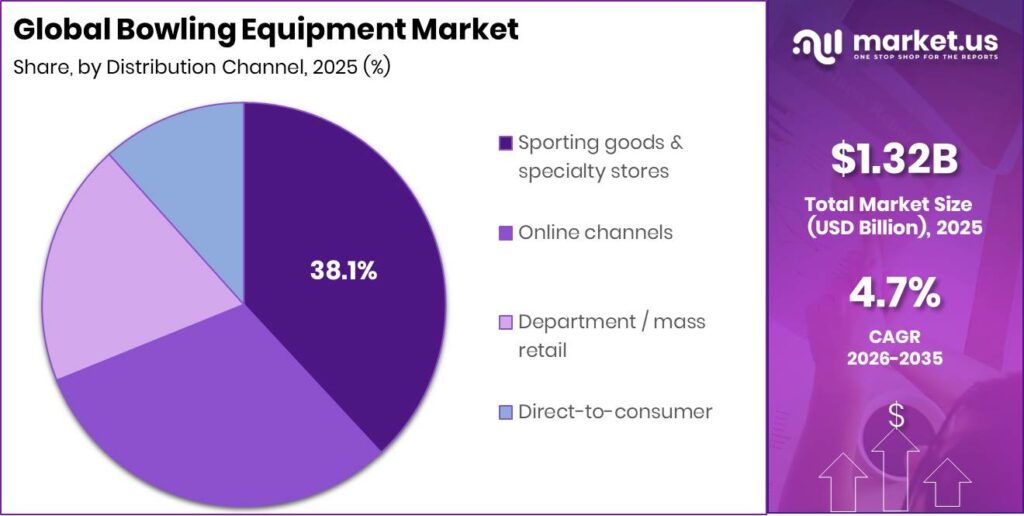
- Sporting goods and specialty stores hold the top By Distribution Channel position with a 38.1% share.
- Pharmaceuticals lead the By End-user Industry segment with a 40.2% share.
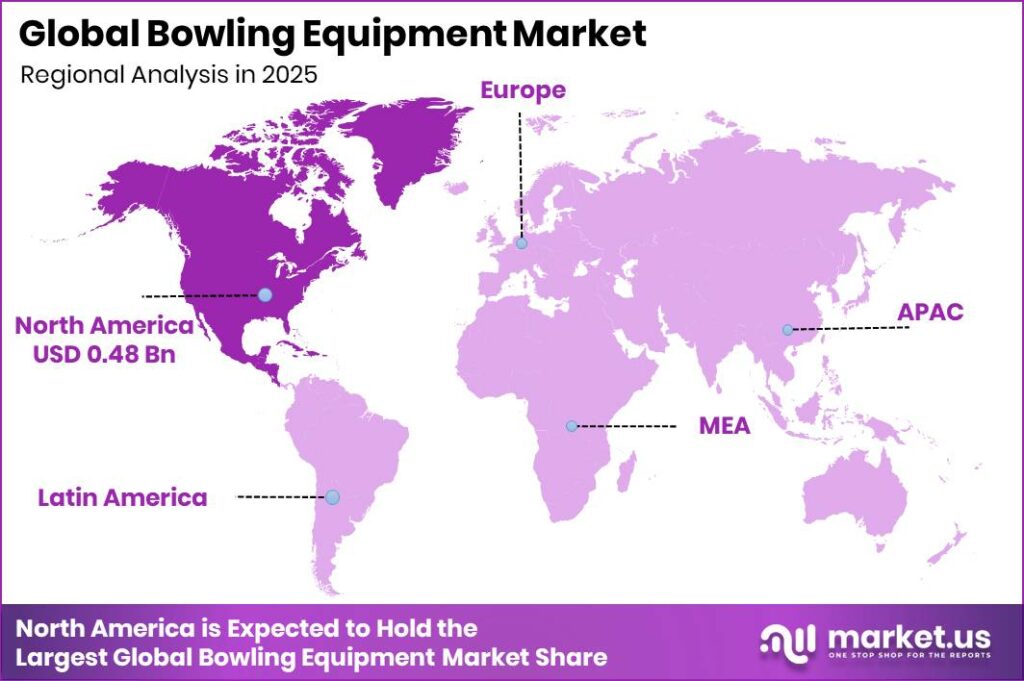
- North America dominates with a 36.7% share, valued at USD 0.48 Billion.
The market sits at an intersection of leisure spending and venue capital investment. Operators upgrade lanes to compete with blended entertainment formats. This creates a durable demand floor for manufacturers. As a result, equipment orders track venue economics more than casual participation swings, giving suppliers steadier order visibility across the decade.
Regulation shapes product design and replacement timing across competitive markets. Beginning with the 2025 to 2026 rules, USBC requires all newly approved bowling balls to meet a minimum hardness of 73D Shore D for competition approval. This forces ball makers to reformulate coverstock chemistry ahead of each season. Manufacturers that certify early protect league sales and defend shelf space against slower rivals.
Modern venues drive higher order values through technology upgrades. As per our research, string pinsetters reset all 10 pins in under 8 seconds using fewer mechanical parts. This reliability reduces peak-hour downtime for operators. Consequently, suppliers bundling low-maintenance pinsetters with scoring systems win larger fit-out contracts and lock in long-term parts and service revenue.
Product Analysis
Bowling balls dominate with 32.1% due to frequent replacement and performance demand.
In 2025, Bowling balls held a dominant market position in the By Product segment of Bowling Equipment Market, with a 32.1% share. Global exports under HS code 950691, which covers sports equipment including bowling gear, run into the hundreds of millions of dollars annually across trade partners. Balls wear and lose reaction over time. This means league bowlers repurchase often, giving manufacturers a recurring, high-frequency revenue stream that stabilizes cash flow.
Lane and scoring equipment anchors the fixed infrastructure of every commercial venue. These systems carry the highest per-unit price in a fit-out. As per our research, a new pinsetter unit ranges from USD 15,000 to USD 35,000 per lane. Operators finance these over long payback windows. Therefore, suppliers with strong installation and service networks defend this capital-intensive category against low-cost entrants.
Bowling shoes and accessories serve steady replacement demand across recreational and league users. Certified bowling members in the United States exceed 1.2 million, sustaining repeat purchases of shoes and grip aids. Bowling pins wear from constant impact and need routine replacement. This creates predictable reorder cycles. Bowling accessories and other specialty or smart equipment hold the remaining share collectively, rounding out a diversified product mix.
End-user Analysis
Commercial centers dominate with 46.7% due to high lane counts and traffic.
In 2025, Commercial bowling centers and alleys held a dominant market position in the By End-user segment of Bowling Equipment Market, with a 46.7% share. The United States operates about 3,305 certified bowling centers and just over 82,000 lanes, according to USBC data. High lane density drives bulk equipment orders. Consequently, manufacturers prioritize this channel for volume contracts and long-term service agreements.
Recreational clubs and leagues buy equipment tied to organized play and membership activity. More than 67 million people bowl in the United States each year, feeding club and league demand. This large base supports steady balls, pins, and shoe reorders. As a result, suppliers who target club procurement gain a resilient mid-volume revenue tier below the commercial center segment.
Schools and universities represent the fastest growing end-user group as institutions add recreation programs. New campus facilities require full lane and scoring fit-outs. Residential buyers form a niche served by compact and mini bowling formats. These two groups hold the remaining share collectively. This means suppliers can test premium home and smart products in low-risk institutional and residential channels.
Distribution Channel Analysis
Specialty stores dominate with 38.1% due to expert fitting and product depth.
In 2025, Sporting goods and specialty stores held a dominant market position in the By Distribution Channel segment of Bowling Equipment Market, with a 38.1% share. Certified league participation above 1.2 million members drives demand for expert ball drilling and fitting. Specialty staff guide performance purchases. Therefore, brands that secure specialty shelf space capture the highest-margin serious bowler segment.
Online channels rank as the fastest growing distribution route as buyers compare specifications and prices digitally. E-commerce widens reach beyond local store catchments. This lowers customer acquisition cost for manufacturers. As a result, direct online listings let brands defend margin while expanding into markets without nearby specialty retail coverage.
Department and mass retail channels serve casual and entry-level buyers seeking value gear. These outlets move high volumes of shoes and starter balls. Direct-to-consumer sales let manufacturers control pricing and capture customer data. Both channels hold the remaining share collectively. This means brands can segment premium fitting through specialty stores while mass channels drive first-time buyer volume.
End-user Industry Analysis
Pharmaceuticals dominate with 40.2% due to strict material and coating standards.
In 2025, Pharmaceuticals held a dominant and fastest growing market position in the By End-user Industry segment of Bowling Equipment Market, with a 40.2% share. Global pharmaceutical output measured by UNIDO manufacturing indices continues to expand across major producing economies. Strict material sourcing standards apply to related equipment coatings. This means suppliers meeting compliance benchmarks defend premium pricing in this segment.
Food and beverage buyers apply hygiene and durability requirements to equipment purchases. Personal care and cosmetics buyers focus on finish quality and material consistency. Both groups sustain steady procurement volumes. Therefore, suppliers offering certified materials gain repeat orders from quality-sensitive industrial accounts.
Chemicals and paints, automotive, and other industry buyers apply performance and coating specifications to their equipment needs. These sectors value durability under heavy use. They hold the remaining share collectively. This creates opportunity for suppliers to cross-sell specialized coatings and materials across multiple industrial end markets.
Key Market Segments
By Product
- Bowling balls
- Bowling pins
- Bowling shoes
- Bowling accessories
- Lane and scoring equipment
- Other specialty/smart equipment
By End-user
- Commercial bowling centers and alleys
- Recreational clubs and leagues
- Schools and universities
- Residential
By Distribution Channel
- Sporting goods and specialty stores
- Online channels
- Department / mass retail
- Direct-to-consumer
By End-user Industry
- Pharmaceuticals
- Food and beverage
- Personal care and cosmetics
- Chemicals and paints
- Automotive
- Others
Regional Analysis
North America Dominates the Bowling Equipment Market with a Market Share of 36.7%, Valued at USD 0.48 Billion
North America leads the Bowling Equipment Market with a 36.7% share, valued at USD 0.48 Billion in 2025. The region hosts about 3,305 certified centers and over 82,000 lanes. This dense installed base drives constant replacement and upgrade orders. As a result, manufacturers treat North America as the anchor market for high-value pinsetter and scoring system revenue.
Asia Pacific ranks as the fastest growing region as new entertainment venues open across major cities. Rising middle-class spending expands first-time venue construction demand. In April 2026, Brunswick Bowling agreed with Sunbridge Co., Ltd. to manage and distribute six Brunswick brands in Japan. This deal deepens regional reach. Therefore, early movers in Asia Pacific capture greenfield fit-out orders before competitors establish distribution.
Key Regions and Countries
North America
- US
- Canada
Europe
- Germany
- France
- The UK
- Spain
- Italy
- Rest of Europe
Asia Pacific
- China
- Japan
- South Korea
- India
- Australia
- Rest of APAC
Latin America
- Brazil
- Mexico
- Rest of Latin America
Middle East and Africa
- GCC
- South Africa
- Rest of MEA
Market Dynamics
Market Opportunity Analysis - Underserved regions and niche end-users open entry points for new equipment suppliers
Asia Pacific remains underexploited despite ranking as the fastest growing region. New venues open faster than local equipment supply networks can serve them. This gap leaves greenfield fit-out orders open to early entrants. Therefore, suppliers who build regional distribution now capture first-mover share before established brands lock in operator relationships.
The schools and universities end-user group stays underserved as the fastest growing institutional segment. Campus recreation programs need full lane and scoring installations. Few suppliers target this channel with tailored financing. Consequently, new entrants offering institution-friendly packages can win a durable, budget-backed customer base with predictable reorder cycles.
Online channels rank as the fastest growing distribution route yet remain thin for performance gear. Serious bowlers still rely on specialty stores for fitting. This means brands that add digital fitting tools and direct online sales reach untapped buyers. As a result, suppliers can expand into markets lacking nearby specialty retail without heavy fixed costs.
Technology and Innovation Landscape - String pinsetters and LED systems redefine energy and maintenance economics
String pinsetter technology reshapes venue operating costs across new installations. As per our research, these systems reset all 10 pins in under 8 seconds using fewer mechanical parts. Advanced units carry a lifespan of 15 to 20 years and over 10,000 hours mean time between failures. This reliability lets operators cut downtime, so suppliers offering string systems win modernization contracts.
Energy efficiency drives adoption of next-generation pinsetters at scale. As per our research, string systems cut combined energy and maintenance costs by roughly 75% versus free-fall units, and Brunswick Boost ST delivers over 70% energy savings. More than 80% of new 2026 centers now adopt string technology. Therefore, manufacturers leading on efficiency capture the fast-growing new-build segment.
LED lighting innovation adds further operating savings for venues. As per our research, US Bowling LED pit lights last 50,000 operating hours versus 7,000 to 10,000 hours for T-12 lamps. Funk Bowling reports up to 80% lower energy use on its latest string systems. This means suppliers bundling LED and low-draw equipment strengthen their value pitch to cost-sensitive operators.
Drivers
Global investment in entertainment and family leisure complexes drives the market forward. Operators install bowling as an anchor activity inside blended eatertainment venues. In the United States, home to roughly 4,700 to 5,000 commercial centers, the shift to boutique and cosmic formats pushed an estimated 18 to 25% of active centers into lane modernization between 2022 and 2025. This creates equipment revenue tied to venue capex rather than participation rates.
New venue construction adds large first-time equipment orders across high-growth regions. The United Arab Emirates and Saudi Arabia added an estimated 80 to 120 new complex lanes yearly through 2023 to 2025. Each lane needs pinsetters priced at USD 15,000 to USD 35,000. Therefore, manufacturers gain higher average order values and faster revenue recognition from greenfield entertainment projects.
| Driver | (~) % Impact on CAGR Forecast | Geographic Relevance | Impact Timeline |
|---|---|---|---|
| Entertainment & Leisure Complex Investment Driving Bowling Centre Infrastructure Modernisation | +1.60% | Asia Pacific, Middle East, United States, Europe | Short term (≤ 2 years) |
| Rising Participation in Recreational & Social Bowling Across Family & Corporate Entertainment Segments | +1.10% | United States, United Kingdom, China, India, GCC | Short term (≤ 2 years) |
| Competitive & League Bowling Resurgence Driving Performance Equipment Demand | +0.85% | United States, Japan, South Korea, Australia, Europe | Medium term (2–4 years) |
| Bowling Alley Renovation & Technology Upgrade Cycles Replacing Ageing Pinsetter & Scoring Systems | +0.65% | United States, Europe, Japan, Canada, Australia | Short term (≤ 2 years) |
| Emerging Market Middle-Class Urbanisation Expanding First-Time Bowling Venue Construction Demand | +0.48% | India, China, Southeast Asia, Latin America, Middle East | Medium term (2–4 years) |
Restraints
High upfront capital cost blocks new independent operators from entering the market. Equipment fit-out costs rose about 18 to 25% in real terms between 2020 and 2025. Steel and plastic inflation plus digital scoring overlays added USD 8,000 to USD 18,000 per lane. This means smaller operators struggle to fund new builds, shrinking the manufacturer order pipeline.
A standard 20-lane center now carries an equipment commitment near USD 1,200,000 to USD 2,800,000. Lending rates of 6 to 9% raise debt service on long payback investments. New independent openings in the United States fell from 80 to 120 yearly in the early 2010s to 30 to 50 through 2023 to 2025. Consequently, manufacturer demand concentrates among fewer large chain accounts.
| Restraint | (~) % Impact on CAGR Forecast | Geographic Relevance | Impact Timeline |
|---|---|---|---|
| High Capital Cost of Full Centre Equipment Fit-Out Constraining New Independent Operator Market Entry | -1.20% | Global — most acute in emerging markets and smaller independent operators | Short term (≤ 2 years) |
| Long-Term Participation Decline in Traditional Ten-Pin League Bowling Reducing Equipment Replacement Demand | -0.85% | United States, Japan, Western Europe | Short term (≤ 2 years) |
| Elevated Commercial Real Estate Costs & Energy Prices Reducing Bowling Centre Operator Profitability | -0.55% | North America, Europe, Japan, Australia | Short term (≤ 2 years) |
| Competition from Home Entertainment & Digital Leisure Alternatives Limiting Bowling Visit Frequency | -0.38% | Global — most acute in North America & Europe among 18–35 age cohort | Medium term (2–4 years) |
Challenges
An aging installed base creates a heavy maintenance burden for operators. Commercial pinsetters reset pins at about 400 to 600 cycles daily in busy centers. An estimated 40 to 55% of roughly 120,000 active U.S. units predate 1990. This forces intensive upkeep to hold uptime above the 95% threshold operators need for viable lane economics.
Legacy equipment drives a costly labor and parts spiral. A 32-lane center with old pinsetters reported annual maintenance of USD 18,000 to USD 35,000 in 2024, versus USD 4,000 to USD 8,000 on modern platforms. This gap opens a revenue stream for retrofit modernization kits priced at USD 2,500 to USD 6,000 per lane. Therefore, manufacturers monetize the aging fleet while bridging operators toward full replacement.
| Challenge | (~) % CAGR Friction Drag | Geographic Relevance | Mitigation Horizon |
|---|---|---|---|
| Ageing Installed Base Pinsetter Maintenance Burden | -0.80% | United States, Japan, Western Europe — mature installed base markets | Long term (≥ 4 years) |
| Spare Parts Supply Chain & Obsolescence Risk | -0.60% | Global — most acute for equipment cohorts from 1980s–1990s | Long term (≥ 4 years) |
| Skilled Technician & Mechanical Maintenance Workforce Deficit | -0.45% | United States, Europe, Japan, Australia | Long term (≥ 4 years) |
| Lane Oil Pattern Standardisation & Performance Equipment Regulation Complexity | -0.30% | United States, Japan, Europe — competitive league markets | Medium term (2–4 years) |
| Sustainability & Energy Consumption Pressure on High-Draw Pinsetter Systems | -0.22% | European Union, United Kingdom, Australia, Canada | Long term (≥ 4 years) |
Opportunities
Connected lane and IoT-enabled predictive maintenance opens fresh recurring revenue. As of 2025 to 2026, most manufacturers still sell one-time hardware with no sensor networks on installed units. Peak-hour downtime on Friday and Saturday evenings drives 40 to 55% of weekly lane revenue. This means sensor platforms that predict failures 3 to 10 days early protect operator income and create supplier stickiness.
IoT retrofit hardware costs about USD 400 to USD 900 per lane against pinsetter values of USD 15,000 to USD 35,000. Annual monitoring subscriptions of USD 600 to USD 1,400 per lane earn gross margins of 65 to 78%. A platform across 5,000 connected lanes could yield USD 3 to USD 7 million in yearly recurring revenue. Therefore, early movers re-rate their revenue quality toward high-margin software.
| Opportunity | (~) % Potential CAGR Upside | Geographic Relevance | Execution Window |
|---|---|---|---|
| Connected Lane & IoT-Enabled Predictive Maintenance Platform as Recurring SaaS Revenue | +1.30% | United States, Europe, Japan, Australia, GCC | Medium term (2–4 years) |
| Asia Pacific & Middle East Greenfield Venue Construction Pipeline | +0.95% | India, China, Saudi Arabia, UAE, Vietnam, Indonesia | Short term (≤ 2 years) |
| Mini & Compact Bowling Format Expansion for Non-Traditional Venue Integration | +0.72% | Global — hotels, cruise ships, entertainment parks, mixed-use retail | Medium term (2–4 years) |
| Equipment-as-a-Service & Lease Financing Model for Independent Operator Segment | +0.55% | United States, Europe, Latin America, Southeast Asia | Long term (≥ 4 years) |
| AR & Gamification Overlay Technology Integration Driving Per-Game Revenue Premium | +0.38% | United States, United Kingdom, South Korea, Japan, GCC | Long term (≥ 4 years) |
Key Company Insights
Brunswick Bowling Products holds a structural advantage through its broad brand portfolio and full equipment range. The 2025 to 2026 USBC rules require balls between 8.500 and 8.595 inches in diameter, and Brunswick certifies across multiple ball brands to meet this standard. Its Boost ST string pinsetter cuts energy use sharply. This wide compliance and hardware reach lets Brunswick defend league sales and commercial fit-out contracts against narrower rivals.
QubicaAMF Worldwide holds a strong position in integrated scoring and center management systems. The company pairs pinsetters with digital scoring and operator software. In February 2026, rival MOTIV Bowling committed an $8.9 million facility expansion, signaling rising capacity competition. QubicaAMF counters by bundling hardware with recurring software services. This integrated approach raises switching costs for operators and locks in long-term revenue across full venue installations.
Key Players
- Brunswick Bowling Products
- QubicaAMF Worldwide
- Murrey International
- US Bowling Corporation
- Storm Products Inc.
- Ebonite International
- MOTIV Bowling
- 900 Global
- KR Strikeforce
- Champion Sports
- E. Parrella Company (EPCO)
- Moxy Bowling Products
- Radical Bowling Technologies
- Roto Grip (Storm brand)
- Funk Bowling
- Others
Recent Developments
- January 2025: Brunswick Bowling launched a new lineup of bowling balls for the 2025 season across the Brunswick, Hammer, Track, Radical, Ebonite, and DV8 portfolios, expanding its high-performance equipment offerings.
- February 2026: Brunswick Bowling announced that its Boost ST string pinsetter received Professional Bowlers Association approval for professional-level competition, strengthening its commercial equipment position.
- March 2026: Brunswick Bowling realigned its bowling ball portfolio by retiring the Columbia 300 brand to focus resources on its remaining performance brands.
Geopolitical Impact Analysis
According to the World Trade Organization, global merchandise trade growth slowed under rising tariff barriers through 2025. Bowling equipment relies on steel and engineered plastics moved across long supply chains. As reported by the IEA, energy price volatility raised industrial input costs by double digits in recent years. This means pinsetter and lane makers face higher production and freight costs, squeezing manufacturer margins on capital equipment.
As reported by UNCTAD, container shipping route disruptions extended transit times and lifted freight rates sharply during recent supply chain reroutings. Heavy bowling equipment such as pinsetters and lane systems depends on ocean freight for cross-border delivery. World Bank data shows commodity price swings above 20% for key metals in recent cycles. Therefore, manufacturers pass higher logistics and material costs to operators, raising fit-out prices in import-dependent markets.
Report Scope
| Report Features | Description |
|---|---|
| Market Value (2025) | USD 1.32 Billion |
| Forecast Revenue (2035) | USD 2.09 Billion |
| CAGR (2026-2035) | 4.7% |
| Base Year for Estimation | 2025 |
| Historic Period | 2020-2024 |
| Forecast Period | 2026-2035 |
| Report Coverage | Revenue Forecast, Market Dynamics, Market Opportunity Analysis, Technology and Innovation Landscape, Competitive Landscape, Recent Developments |
| Segments Covered | By Product (Bowling balls, Bowling pins, Bowling shoes, Bowling accessories, Lane and scoring equipment, Other specialty/smart equipment), By End-user (Commercial bowling centers and alleys, Recreational clubs and leagues, Schools and universities, Residential), By Distribution Channel (Sporting goods and specialty stores, Online channels, Department / mass retail, Direct-to-consumer), By End-user Industry (Pharmaceuticals, Food and beverage, Personal care and cosmetics, Chemicals and paints, Automotive, Others) |
| Regional Analysis | North America (US and Canada), Europe (Germany, France, The UK, Spain, Italy, and Rest of Europe), Asia Pacific (China, Japan, South Korea, India, Australia, and Rest of APAC), Latin America (Brazil, Mexico, and Rest of Latin America), Middle East and Africa (GCC, South Africa, and Rest of MEA) |
| Competitive Landscape | Brunswick Bowling Products, QubicaAMF Worldwide, Murrey International, US Bowling Corporation, Storm Products Inc., Ebonite International, MOTIV Bowling, 900 Global, KR Strikeforce, Champion Sports, E. Parrella Company (EPCO), Moxy Bowling Products, Radical Bowling Technologies, Roto Grip (Storm brand), Funk Bowling, Others |
| Customization Scope | Customization for segments, region / country-level will be provided. Additional customization can be done based on requirements. |
| Purchase Options | We have three licenses to opt for: Single User License | Multi-User License (Up to 5 Users) | Corporate Use License (Unlimited User and Printable PDF) |





































