


Report Overview
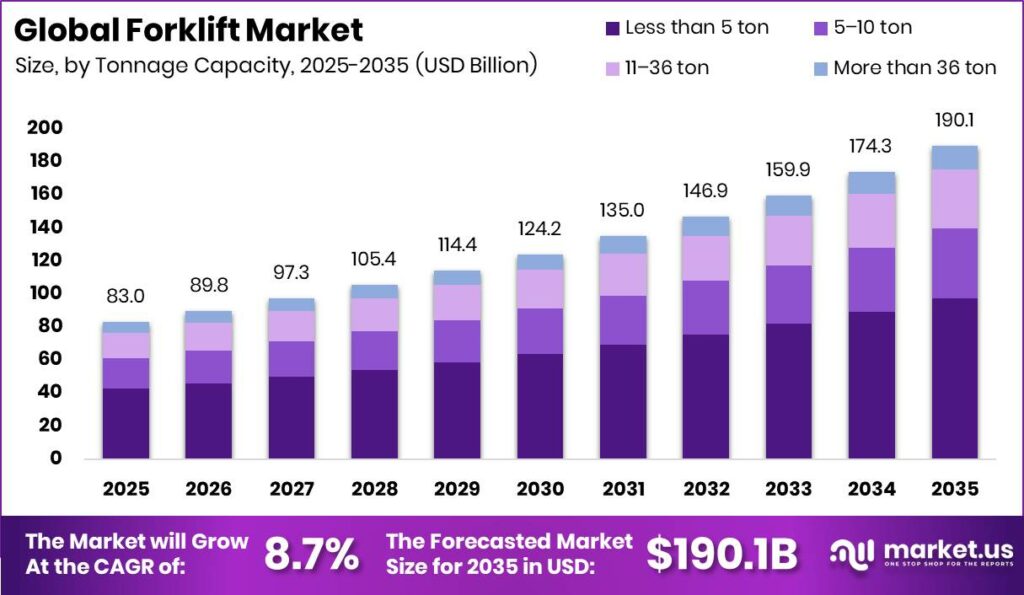
Global Forklift Market size is expected to be worth around USD 190.1 Billion by 2035 from USD 83.0 Billion in 2025, growing at a CAGR of 8.7% during the forecast period 2026 to 2035. This trajectory more than doubles the market value in ten years. Investors gain a decade-long window to back electrification and automation before pricing power consolidates around scaled manufacturers.
The Industrial Trucks Market forklift segment covers powered industrial trucks that lift, move, and stack loads across warehouses, ports, and factories. Vendors structure the market by lift class, tonnage, fuel type, and end use. This layered structure lets buyers match equipment to duty cycles. Therefore manufacturers who segment product lines by application capture demand across both light indoor and heavy outdoor operations.
Key Takeaways
- Global Forklift Market size reached USD 83.0 Billion in 2025 and heads toward USD 190.1 Billion by 2035 at a CAGR of 8.7%.
- Class I forklifts led the class segment with a 41.1% share and ranked as the fastest-growing class.
- Less than 5 ton units dominated tonnage capacity with a 51.3% share.
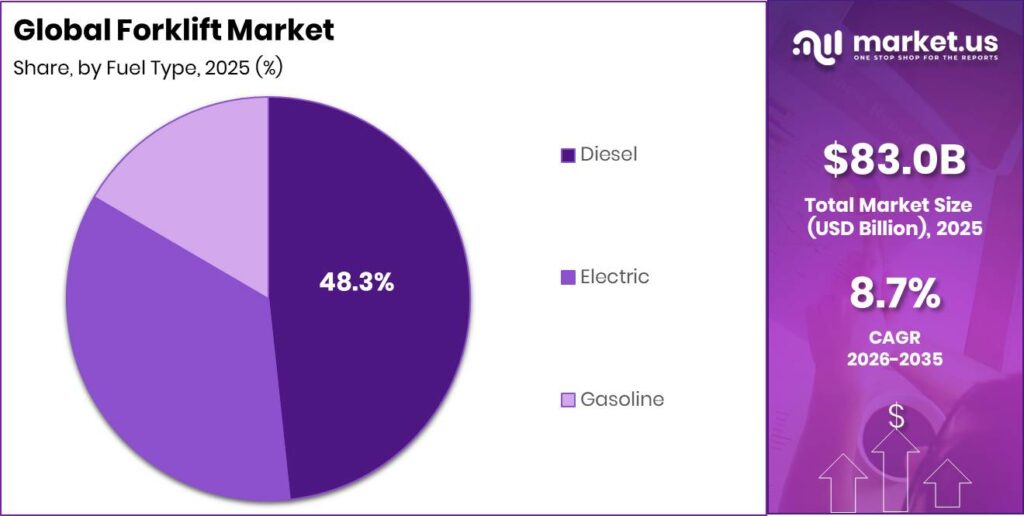
- Diesel led the fuel segment with a 48.3% share, while Electric grew fastest.
- Logistics led end use with a 31.7% share, and Retail and e-commerce grew fastest.
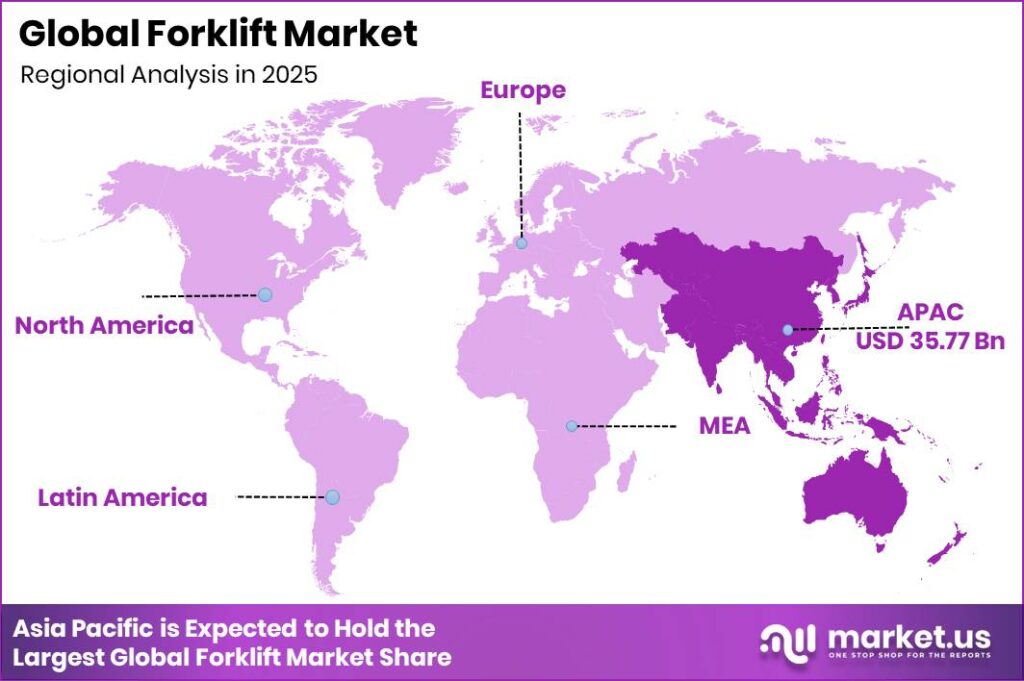
- Asia-Pacific dominated with a 43.1% share, valued at USD 35.77 Billion.
Government action reinforces this outlook across major regions. India advances warehouse buildout under national logistics programs, while emission mandates in Europe and the United States push indoor electric adoption. As a result, forklift buyers face rising compliance pressure that favors cleaner fleets. Manufacturers aligned with these mandates lock in demand before slower rivals react to new rules.
Safety data explains why buyers now weight equipment choices toward monitoring and automation. According to the U.S. Bureau of Labor Statistics, 614 workers died in forklift-related incidents between 2011 and 2017. This record pushes operators toward safer, sensor-equipped fleets. Consequently vendors that embed safety technology convert risk concern directly into premium equipment sales.
Warehouse risk data further sharpens the buying case. As reported by OSHA Online Center, forklift incidents account for roughly 25% of all warehouse injuries. This share links fleet quality to insurance and downtime costs. Therefore buyers increasingly treat advanced forklift safety features as cost control rather than optional spend, expanding the addressable premium segment.
Class Analysis
Class I dominates with 41.1% due to electric indoor warehouse handling suitability.
In 2025, Class I held a dominant market position in the By Class segment of Forklift Market, with a 41.1% share. According to UN Comtrade, global trade in electric-powered trucks under HS code 8427.10 moved millions of units across major logistics hubs annually. This concentration reflects the shift to indoor electric fleets. Therefore vendors scaling Class I output capture the largest and fastest-moving pool of warehouse demand.
Class II order pickers and reach trucks serve narrow-aisle, high-density storage roles. Figures from ITC Trade Map show electric truck exports from Germany exceeded USD 2 Billion in recent trade years. This trade weight signals strong European supply capacity. Consequently buyers seeking narrow-aisle efficiency gain reliable sourcing options that lower storage cost per square meter.
Class III pallet trucks handle low-lift, high-frequency ground transport tasks. Data from the Industrial Truck Association shows powered industrial truck factory shipments in North America surpassed 250,000 units in a single reporting year. This volume confirms deep entry-level demand. As a result, manufacturers use Class III as a low-cost gateway that pulls buyers toward higher-margin equipment later.
Class IV and Class V cover cushion-tire and pneumatic-tire internal combustion trucks for heavier duties. Based on UN Comtrade data, non-electric works truck trade under HS code 8427.20 remained a multi-billion-dollar flow across outdoor and yard applications. Others hold the remaining share collectively. Therefore vendors retain combustion lines to defend outdoor and heavy-load buyers electric models cannot yet fully serve.
Tonnage Capacity Analysis
Less than 5 ton dominates with 51.3% due to compact indoor pallet handling.
In 2025, Less than 5 ton held a dominant market position in the By Tonnage Capacity segment of Forklift Market, with a 51.3% share. According to the World Bank, global containerized trade throughput exceeded 800 million TEU in recent years, feeding warehouse pallet flows. This volume favors compact trucks. Therefore vendors prioritizing sub-5-ton lines align with the highest-frequency material movement worldwide.
The 5 to 10 ton class ranks fastest-growing by serving mid-weight industrial and yard loads. Figures from UNIDO show global manufacturing value added surpassed USD 16 Trillion, expanding demand for heavier plant handling. This growth lifts mid-range trucks. Consequently manufacturers investing here capture factories upgrading from light to medium load capacity.
The 11 to 36 ton range supports container yards, steel, and construction material handling. As reported by the IEA, global freight activity continues rising with industrial energy use, sustaining heavy-lift needs. This demand anchors specialized reach stackers. As a result, vendors with heavy-duty portfolios defend port and terminal contracts that light trucks cannot fulfill.
The More than 36 ton class handles the heaviest port and intermodal container tasks. Data from UNCTAD shows global port container handling grew steadily across major terminals. This scale sustains ultra-heavy equipment niches. Therefore manufacturers holding this specialized capacity secure high-value, low-volume contracts with strong pricing power.
Fuel Analysis
Diesel dominates with 48.3% due to outdoor heavy-duty power reliability.
In 2025, Diesel held a dominant market position in the By Fuel segment of Forklift Market, with a 48.3% share. According to the IEA, diesel remained the leading fuel across global freight and off-road machinery for years. This entrenched base sustains combustion forklift demand. Therefore vendors keep diesel lines to serve outdoor and heavy-load buyers who need sustained runtime.
Electric forklifts rank fastest-growing as emission rules tighten indoor operations. Figures from the IEA show global electric vehicle stock passed 40 million units, signaling battery supply maturity. This scale lowers forklift battery costs. Consequently manufacturers accelerating electric output ride the strongest structural shift in the market.
Gasoline forklifts hold the remaining share, serving intermittent and low-hour applications. Based on national statistical office data, small-business material handling relies on lower-cost combustion units in many regions. This role keeps gasoline relevant for light operators. As a result, vendors retain gasoline models to capture price-sensitive buyers not yet ready to electrify.
End Use Analysis
Logistics dominates with 31.7% due to high-throughput warehouse pallet movement.
In 2025, Logistics held a dominant market position in the By End Use segment of Forklift Market, with a 31.7% share. According to the World Bank, logistics performance indicators show freight volumes expanding across trade-intensive economies. This growth drives fleet procurement. Therefore vendors targeting third-party logistics operators capture the largest and most consistent buyer group.
Retail and e-commerce ranks fastest-growing as direct-to-consumer fulfillment scales rapidly. Figures from UNCTAD show global e-commerce sales reached trillions of dollars annually. This surge builds new fulfillment centers. Consequently manufacturers signing fleet framework deals with online retailers lock in multi-year recurring revenue.
Chemical and Food and beverages end uses demand specialized and hygienic forklift configurations. As reported by the FAO, global food production volumes continue rising to meet population growth. This output expands cold-chain handling. As a result, vendors offering food-grade and explosion-proof trucks defend regulated, higher-margin niches.
Industrial and Others hold the remaining share collectively across manufacturing and mixed operations. Based on UNIDO data, industrial output growth sustains plant-floor material handling worldwide. This breadth keeps demand diversified. Therefore manufacturers with flexible product lines reduce dependence on any single end-use cycle.
Key Market Segments
By Class
- Class I
- Class II
- Class III
- Class IV
- Class V
- Others
By Tonnage Capacity
- Less than 5 ton
- 5–10 ton
- 11–36 ton
- More than 36 ton
By Fuel
- Diesel
- Electric
- Gasoline
By End Use
- Chemical
- Food & beverages
- Industrial
- Logistics
- Retail & e-commerce
- Others
Regional Analysis
Asia Pacific Dominates the Forklift Market with a Market Share of 43.1%, Valued at USD 35.77 Billion
Asia Pacific led the Forklift Market with a 43.1% share, valued at USD 35.77 Billion in 2025. Regional manufacturing scale and rapid warehouse construction drive this lead. This concentration reflects dense production in China, Japan, and India. Therefore manufacturers with strong Asia Pacific footprints capture the largest volume base and lowest-cost supply position in the market.
India stands out as a fast-growing market as logistics parks expand under national policy. Government warehouse programs push first-time mechanized fleet deployment across new facilities. This buildout creates fresh forklift demand. As a result, early entrants in India secure share before the market matures and competition intensifies.
North America faces cost pressure that reshapes regional supply strategy. Hyster-Yale reported in a March 2026 filing that roughly USD 40 Million in tariff-related costs hit its lift truck division, prompting a shift toward lighter-duty segments. This pressure alters product mix. Consequently manufacturers rebalance North American portfolios to protect margins against trade-driven cost shifts.
Key Regions and Countries
North America
- US
- Canada
Europe
- Germany
- France
- The UK
- Spain
- Italy
- Rest of Europe
Asia Pacific
- China
- Japan
- South Korea
- India
- Australia
- Rest of APAC
Latin America
- Brazil
- Mexico
- Rest of Latin America
Middle East and Africa
- GCC
- South Africa
- Rest of MEA
Market Dynamics
Market Opportunity Analysis - Underserved fuel, region, and end-use segments open clear entry points for new players
Electric fuel remains underexploited despite its fastest-growing status against Diesel’s 48.3% lead. Most emerging-market fleets still run combustion units by default. This lag leaves a wide conversion runway. Therefore new entrants offering affordable electric models capture buyers before incumbents extend their diesel dominance into electrification.
Retail and e-commerce end use sits underserved even as it grows faster than the 31.7% Logistics leader. Fulfillment operators need tailored fleet configurations few vendors package fully. This gap rewards specialization. As a result, focused entrants win framework deals with online retailers ahead of generalist competitors.
India presents an underexploited regional opening within Asia Pacific’s 43.1% share. Many warehouses still rely on manual handling rather than powered fleets. This low mechanization signals first-mover space. Consequently early vendors establish brand and service networks before the market consolidates around scaled players.
The 5 to 10 ton tonnage class stays underserved against the 51.3% Less than 5 ton majority. Mid-weight industrial buyers upgrading capacity find limited tailored options. This mismatch creates room to differentiate. Therefore manufacturers targeting mid-range loads capture factories transitioning from light to heavier handling.
Technology and Innovation Landscape - Telematics, AI safety systems, and faster mast control reshape competitive advantage
Telematics adoption reshapes fleet economics for buyers and vendors alike. As per our research, integrated telematics on modern forklifts can lift fleet operational efficiency by up to 20% in 2026. This gain lowers cost per pallet move. Therefore manufacturers bundling telematics turn connectivity into measurable buyer savings and recurring software revenue.
AI safety systems deliver strong accident reductions that buyers now demand. As per our research, AI camera and sensor monitoring on lift trucks reduces warehouse accidents by up to 35% in 2026. This drop cuts downtime and insurance cost. As a result, vendors embedding AI monitoring convert safety performance directly into premium pricing power.
Technology-integrated safety programs outperform traditional training by a wide margin. As per our research, such programs improve operational safety margins by 30% to 40% versus 10% to 15% from conventional training. This gap favors connected fleets. Consequently manufacturers pairing hardware with digital safety platforms strengthen long-term customer retention.
Faster mast control innovation raises throughput in high-density operations. As per our research, Crown Equipment’s Xpress Lower technology lowers stockpicker masts up to 2.5 times faster than competing systems. This speed cuts throughput times. However, roughly 30% of operators report needing added training for advanced digital forklift technology, so vendors must fund adoption support.
Drivers
The primary driver is the global buildout of dedicated e-commerce fulfillment centers, which run forklifts at far higher intensity than traditional retail warehouses. A single 100,000 m² hyperscale center needs 200 to 500 powered industrial trucks, representing new fleet spend of USD 8,000,000 to USD 25,000,000 per facility. This scale converts warehouse growth directly into large forklift orders. Therefore vendors win multi-year fleet contracts.
Warehouse construction reinforces this pull across major regions. Publicly disclosed leasing data documented new U.S. industrial floor take-up above 400 million square feet cumulatively over 2022 to 2024, adding roughly 1 forklift per 500 to 800 m² of new space. This ratio ties construction directly to procurement. As a result, manufacturers gain multi-year revenue visibility through Warehouse Automation Market framework supply agreements.
| Driver | (~) % Impact on CAGR Forecast | Geographic Relevance | Impact Timeline |
|---|---|---|---|
| E-Commerce & Warehouse Fulfilment Infrastructure Expansion Driving Intensive Forklift Fleet Procurement | +2.80% | United States, China, Europe, India, Southeast Asia, Latin America, Australia | Short term (≤ 2 years) |
| Electric Forklift Transition Accelerated by Indoor Emission Mandates & Total Cost of Ownership Advantage | +1.90% | European Union, United States, China, Japan, South Korea, Australia | Short term (≤ 2 years) |
| Manufacturing Reshoring & Nearshoring Capacity Buildout Driving Greenfield Warehouse & Plant Forklift Demand | +1.20% | United States, Mexico, India, Vietnam, Poland, Czech Republic, Morocco | Medium term (2–4 years) |
| Cold Chain & Pharmaceutical Logistics Infrastructure Growth Requiring Specialised Forklift Configurations | +0.85% | United States, Europe, India, China, Southeast Asia, Latin America | Medium term (2–4 years) |
| Port & Intermodal Terminal Capacity Expansion Driving Heavy-Duty Reach Stacker & Container Handler Demand | +0.62% | China, United States, Southeast Asia, Middle East, Africa, Latin America | Medium term (2–4 years) |
| India Warehouse & Logistics Park Development Under PM Gati Shakti & National Logistics Policy Driving First-Time Fleet Deployment | +0.48% | India | Short term (≤ 2 years) |
Restraints
The root restraint is the 30% to 55% price premium of lithium-ion electric forklifts over equivalent diesel or LPG units. At the 3-tonne level, electric trucks cost USD 38,000 to USD 58,000 versus USD 22,000 to USD 35,000 for combustion. This gap deters small operators. Therefore vendors lose emerging-market upgrade demand without financing support.
Financing constraints deepen this drag in price-sensitive regions. Small operators in India and Southeast Asia access only 36 to 48 month loans at rates of 12% to 18%, blocking single-cycle electric purchases. This limit keeps fleets combustion-heavy. As a result, manufacturers must deploy Electric Forklift Market leasing models to unlock stalled small-business adoption.
| Restraint | (~) % Impact on CAGR Forecast | Geographic Relevance | Impact Timeline |
|---|---|---|---|
| High Capital Cost of Electric & Lithium-Ion Forklifts Suppressing SME Fleet Upgrade Decisions | -1.40% | India, Southeast Asia, Latin America, Eastern Europe, Sub-Saharan Africa | Short term (≤ 2 years) |
| Semiconductor & Electronic Component Supply Constraints Extending Electric Forklift Delivery Lead Times | -0.85% | Global — most acute for European & North American operators awaiting electric fleet delivery | Short term (≤ 2 years) |
| Elevated Interest Rates & Tight Credit Conditions Suppressing Forklift Finance & Leasing Take-Up | -0.65% | United States, Europe, Australia, Brazil, India — finance-dependent SME operators | Short term (≤ 2 years) |
| China Domestic Overcapacity & Export Price Dumping Pressure Compressing Margins for Western OEMs | -0.48% | Southeast Asia, Latin America, Middle East, Africa — Chinese export markets | Medium term (2–4 years) |
Challenges
The core challenge is the mismatch between fast electric forklift adoption and weak warehouse charging infrastructure. A 50-unit lithium-ion fleet on two shifts needs 500 to 800 kW of peak charging power. This gap forces electrical upgrades many buyers did not budget. Therefore fleet electrification projects stall during facility assessment.
Upgrade costs turn this gap into a real revenue opening. Facilities need switchgear and cabling investments of USD 150,000 to USD 550,000 each, delaying deployment by 4 to 12 months. This delay opens a services market. As a result, manufacturers offering turnkey Logistics Automation Market infrastructure support defend contracts and add high-margin project revenue.
| Challenge | (~) % CAGR Friction Drag | Geographic Relevance | Mitigation Horizon |
|---|---|---|---|
| Warehouse Charging Infrastructure Readiness Gap for Electric Fleet Scale-Up | -0.90% | Global — most acute in India, Southeast Asia, Latin America, Eastern Europe | Medium term (2–4 years) |
| Skilled Forklift Operator Shortage & Safety Certification Gaps | -0.72% | United States, Europe, Australia, Canada — tight labour markets | Long term (≥ 4 years) |
| Li-Ion Battery Second-Life & End-of-Life Recycling Infrastructure Deficit | -0.55% | Global — most acute in markets without formal battery recycling legislation | Long term (≥ 4 years) |
| Aftermarket Parts & Service Network Gaps in Rapid-Growth Emerging Markets | -0.42% | Sub-Saharan Africa, South Asia, Latin America, Southeast Asia | Long term (≥ 4 years) |
| Cybersecurity & Telematics Data Integrity Risk in Connected Fleet Platforms | -0.25% | Europe, United States, Japan — advanced fleet management markets | Long term (≥ 4 years) |
Opportunities
The largest opportunity is autonomous forklift deployment in high-throughput warehouses. As of 2025 to 2026, AMR and AGV forklifts made up fewer than 3% to 5% of global unit shipments. This low base leaves wide white space. Therefore early movers claim a fast-expanding category before incumbents scale their platforms.
Labor economics make the payback compelling for buyers. A U.S. operator costs USD 50,000 to USD 73,000 yearly, while an autonomous unit runs at USD 28,000 to USD 45,000, paying back in 2.5 to 4 years. This gap drives adoption. As a result, manufacturers investing in Warehouse Equipment Market autonomy capture software margins of 52% to 65%.
| Opportunity | (~) % Potential CAGR Upside | Geographic Relevance | Execution Window |
|---|---|---|---|
| Autonomous & Semi-Autonomous Forklift Deployment in High-Throughput Fulfilment & Manufacturing Environments | +2.10% | United States, Germany, Japan, South Korea, China, Netherlands, Australia | Medium term (2–4 years) |
| Forklift-as-a-Service (FaaS) & Fleet Management Subscription Monetisation of Installed Base | +1.20% | United States, Europe, Japan, Australia, India, Southeast Asia | Short term (≤ 2 years) |
| Hydrogen Fuel Cell Forklift Deployment in Multi-Shift High-Utilisation Operations | +0.85% | United States, Germany, South Korea, Japan, France, Netherlands | Long term (≥ 4 years) |
| Emerging Market Fleet Formalisation — India, Southeast Asia & Africa Transitioning from Manual to Mechanised Handling | +0.65% | India, Indonesia, Vietnam, Nigeria, Kenya, Ethiopia, Bangladesh | Short term (≤ 2 years) |
| Cold Storage Forklift Specialisation for Pharmaceutical & Food Cold Chain Growth | +0.42% | United States, Europe, India, China, Southeast Asia, Latin America | Medium term (2–4 years) |
Key Company Insights
Anhui HELI Co. Limited anchors its position on high-volume, cost-competitive manufacturing that serves price-sensitive buyers across Asia and emerging markets. According to the U.S. Bureau of Labor Statistics, the country recorded 5,283 workplace fatalities in 2023, raising buyer focus on safer equipment. This shift pressures low-cost lines to add safety features. Therefore HELI must upgrade specifications to defend share against safety-led competition.
Clark Material Handling Company builds its advantage on a long service heritage and broad combustion and electric range across industrial buyers. As reported by the U.S. Bureau of Labor Statistics, the fatal injury rate held at 3.5 per 100,000 workers in 2023, sustaining demand for reliable fleets. This steady risk supports aftermarket revenue. Consequently Clark protects margins through parts and service rather than price alone.
Key Players
- Anhui HELI Co. Limited
- Clark Material Handling Company
- Combilift
- Crown Equipment Corporation
- Doosan Industrial Vehicle America Corp.
- Hangcha Group Co. Ltd.
- Hyster-Yale Materials Handling Inc.
- Hyundai Heavy Industries
- Jungheinrich AG
- KION Group AG
- Komatsu Ltd.
- Lonking Holdings Limited
- Mitsubishi Nichiyu Forklift Co. Ltd.
- Toyota Industries Corporation
- UniCarriers Americas
Recent Developments
- September 2025: Jungheinrich launched the entry-level brand AntOn by Jungheinrich, targeting cost-efficient warehouse operations with lithium-ion forklifts (CBH 2.5, CBH 3.0) and pallet trucks to expand its low-cost portfolio.
- January 2025: Toyota Material Handling expanded its portfolio with new integrated mid and large electric pneumatic forklifts and a refreshed Core Electric Forklift series, focusing on higher efficiency and lower emissions across warehouse operations.
Geopolitical Impact Analysis
Trade tensions now directly raise forklift manufacturing and pricing costs. As reported by the WTO, average applied tariffs climbed as new duties hit machinery imports, while U.S. Section 301 measures added rates up to 25% on many Chinese components. This burden lifts input costs for forklift assembly. Therefore manufacturers reroute sourcing to protect margins on electric and combustion lines.
Supply chain rerouting and energy volatility further pressure distribution. According to UNCTAD, Red Sea disruruptions cut Suez Canal transits sharply and pushed container shipping rates up by over 150% at peak. This surge raises delivery costs for imported forklift parts and finished units. Consequently vendors build regional inventory buffers to shield buyers from extended lead times.
Report Scope
| Report Features | Description |
|---|---|
| Market Value (2025) | USD 83.0 Billion |
| Forecast Revenue (2035) | USD 190.1 Billion |
| CAGR (2026-2035) | 8.7% |
| Base Year for Estimation | 2025 |
| Historic Period | 2020-2024 |
| Forecast Period | 2026-2035 |
| Report Coverage | Revenue Forecast, Market Dynamics, Market Opportunity Analysis, Technology and Innovation Landscape, Competitive Landscape, Recent Developments |
| Segments Covered | By Class (Class I, Class II, Class III, Class IV, Class V, Others), By Tonnage Capacity (Less than 5 ton, 5–10 ton, 11–36 ton, More than 36 ton), By Fuel (Diesel, Electric, Gasoline), By End Use (Chemical, Food & beverages, Industrial, Logistics, Retail & e-commerce, Others) |
| Regional Analysis | North America (US and Canada), Europe (Germany, France, The UK, Spain, Italy, and Rest of Europe), Asia Pacific (China, Japan, South Korea, India, Australia, and Rest of APAC), Latin America (Brazil, Mexico, and Rest of Latin America), Middle East and Africa (GCC, South Africa, and Rest of MEA) |
| Competitive Landscape | Anhui HELI Co. Limited, Clark Material Handling Company, Combilift, Crown Equipment Corporation, Doosan Industrial Vehicle America Corp., Hangcha Group Co. Ltd., Hyster-Yale Materials Handling Inc., Hyundai Heavy Industries, Jungheinrich AG, KION Group AG, Komatsu Ltd., Lonking Holdings Limited, Mitsubishi Nichiyu Forklift Co. Ltd., Toyota Industries Corporation, UniCarriers Americas |
| Customization Scope | Customization for segments, region / country-level will be provided. Additional customization can be done based on requirements. |
| Purchase Options | We have three licenses to opt for: Single User License | Multi-User License (Up to 5 Users) | Corporate Use License (Unlimited User and Printable PDF) |





































