


Report Overview
Global Fantasy Football Market size is expected to be worth around USD 12.2 Billion by 2035 from USD 3.9 Billion in 2025, growing at a CAGR of 12.1% during the forecast period 2026 to 2035.
The fantasy football market encompasses digital platforms where participants build virtual squads, earn points based on real-player performances, and compete across season-long, daily, and weekly contest formats. Revenue flows through entry fees, paid subscriptions, advertising, and white-label licensing agreements. This market spans both association football and American football formats globally.
Key Takeaways
- The global Fantasy Football Market is valued at USD 3.9 Billion in 2025 and is forecast to reach USD 12.2 Billion by 2035.
- The market grows at a CAGR of 12.1% during the forecast period 2026 to 2035.
- By Product Type, Betting Integrations dominates with 67.45% market share in 2025.
- By Platform, Mobile Application holds 62.11% of the market in 2025.
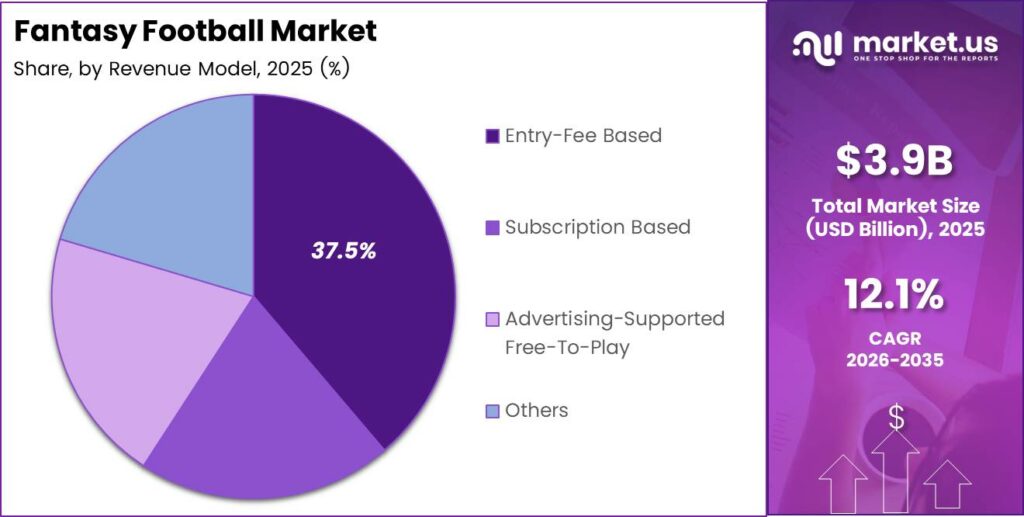
- By Revenue Model, Entry-Fee Based leads with 37.56% market share in 2025.
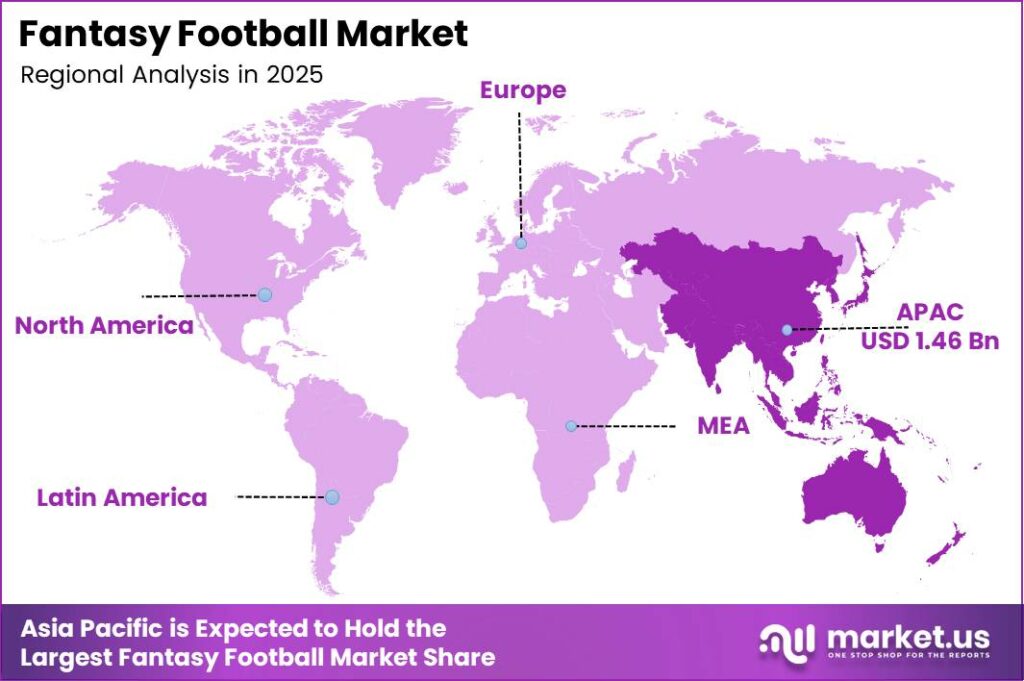
- Asia-Pacific is the dominant region with 37.56% market share, valued at USD 1.46 Billion in 2025.
- North America is the fastest-growing region during the forecast period.
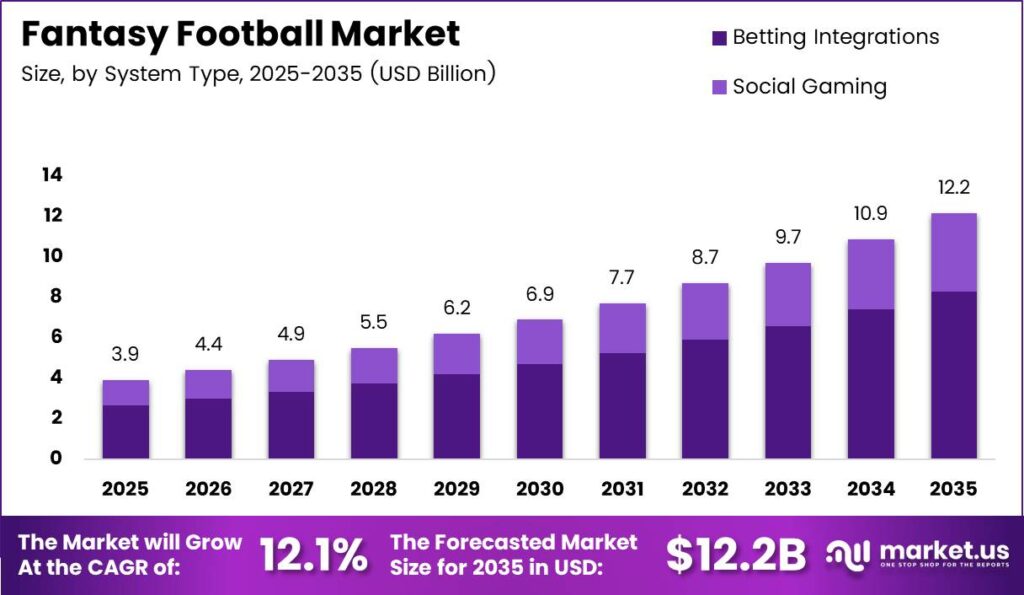
As per our research, the World Bank’s June 2026 forecast projected global economic growth of 2.5% in 2026, down from 2.9% in 2025. This softer macro environment compresses discretionary budgets for entry-fee contest spending. Operators relying on paid-contest revenue must diversify into subscription and advertising models to sustain revenue growth.
The World Bank’s June 2026 outlook projected global inflation of 4.0% in 2026, compared with 3.3% in 2025. Higher inflation reduces household spending power in price-sensitive fantasy markets. Subscription tiers priced below USD 40 annually, such as Yahoo’s Fantasy Plus offering, are better positioned to retain cost-conscious users than premium-priced alternatives.
According to ESPN, its fantasy-game portfolio served more than 20 million players annually across multiple sports as of September 2025. This scale confirms that audience aggregation, not monetization depth, remains the dominant competitive strategy among legacy platform operators. As per our research, ITU estimated that 2.2 billion people remained offline in 2025, representing a structural ceiling on near-term addressable market expansion.
On December 1, 2025, FanDuel launched its mobile sportsbook in Missouri, becoming its 25th state or territory offering mobile sports betting, while DraftKings announced plans on November 24, 2025 to launch in Missouri as its 29th U.S. state for sports wagering, underscoring the pace of geographic expansion by leading operators.
Product Type Analysis
Betting Integrations dominates with 67.45% due to convergence of wagering and fantasy engagement.
In 2025, Betting Integrations held a dominant market position in the By Product Type segment of the Fantasy Football Market, with a 67.45% share. Operators that embed sportsbook functionality within fantasy platforms eliminate the switching cost between wagering and squad-management activities. DraftKings’ NFL Best Ball contest listed a $25 entry fee with a maximum of 150 entries per participant and a $3 million top prize, illustrating the high-value prize structures that sustain user acquisition spend in betting-integrated formats.
Social Gaming represents the remaining share within the Product Type segment. Fantasy Premier League’s 2025/26 game allowed managers to create and join up to 30 private leagues with friends, embedding social competition loops that retain users without direct monetary stakes. This social-retention mechanic lowers churn among free-to-play participants and creates an audience pool for upselling paid contest features.
On December 9, 2025, Premier League topped up free-transfer balances to a maximum of 5 immediately after the Gameweek 15 deadline, demonstrating how product rule adjustments actively protect engagement during player-absence periods. By contrast, Flutter completed its acquisition of Snaitech for a cash consideration based on an enterprise value of €2.3 billion on April 30, 2025, expanding its European gaming footprint and signaling consolidation pressure that favors large integrated platforms over standalone social gaming products.
Platform Analysis
Mobile Application dominates with 62.11% due to on-the-go lineup management before match deadlines.
In 2025, Mobile Application held a dominant market position in the By Platform segment of the Fantasy Football Market, with a 62.11% share. As reported by GSMA, 4.7 billion people, representing 58% of the global population, used mobile internet at the end of 2024. This connectivity base makes mobile the default access point for deadline-sensitive fantasy actions. Platforms that optimize transfer windows, captain picks, and score tracking for mobile interfaces capture the highest share of recurring user activity.
Website-based access holds the remaining platform share within the segment. Desktop users tend to engage in deeper analytical workflows, including season-long squad planning and statistical comparisons, that benefit from larger screen formats. This behavioral difference gives website platforms a role in retaining high-engagement users who consume premium data products. Consequently, platform operators that maintain parallel web experiences alongside mobile apps retain users across multiple engagement modes rather than concentrating risk in a single access channel.
Revenue Model Analysis
Entry-Fee Based dominates with 37.56% due to direct monetization of competitive contest participation.
In 2025, Entry-Fee Based held a dominant market position in the By Revenue Model segment of the Fantasy Football Market, with a 37.56% share. Entry fees convert user engagement directly into revenue per contest, creating a transactional monetization model that scales with contest volume. Fantasy Premier League’s official website reported more than 11 million free-to-play participants, demonstrating that free-entry products generate scale, while paid-entry formats generate the margin that funds platform investment.
Subscription-Based is the fastest-growing revenue model within the segment. As reported by Yahoo, its Fantasy Plus tier is priced at $39.99 annually and Fantasy Ultra at $79.99 annually, with monthly loyalty point rewards of 300 and 600 points respectively. These tiered structures allow operators to segment users by willingness to pay while delivering predictable recurring revenue. This creates a more stable cash flow base than entry-fee models that fluctuate with contest participation cycles.
Advertising-Supported Free-To-Play and other revenue models hold the remaining share collectively. These models monetize audience attention rather than direct contest participation, making them dependent on advertiser demand and user volume. They serve as acquisition tools that convert passive audiences into paying users over time rather than generating immediate transaction revenue.
Key Market Segments
By Product Type
- Betting Integrations
- Social Gaming
By Platform
- Mobile Application
- Website
By Revenue Model
- Entry-Fee Based
- Subscription Based
- Advertising-Supported Free-To-Play
- Others
Regional Analysis
Asia-Pacific Dominates the Fantasy Football Market with a Market Share of 37.56%, Valued at USD 1.46 Billion
Asia-Pacific holds the largest regional share of the Fantasy Football Market at 37.56%, valued at USD 1.46 Billion in 2025. As reported by GSMA, mobile technologies and services contributed $950 billion to Asia-Pacific’s economy in 2024, underpinning the digital infrastructure that supports large-scale fantasy platform adoption. This economic contribution signals that regional operators benefit from a mature mobile ecosystem rather than building on nascent connectivity foundations.
North America is the fastest-growing region during the forecast period. On July 10, 2025, Flutter announced an agreement to acquire Boyd Gaming’s 5% FanDuel stake for approximately $1.55 billion, moving toward full ownership of the market’s leading North American sportsbook platform. This consolidation signals that capital is concentrating in the region ahead of forecast growth, creating structural barriers for new entrants competing against fully integrated operators. On May 14, 2025, Flutter completed its acquisition of an initial 56% stake in NSX Group for approximately $350 million, expanding its Latin American presence and signaling cross-regional diversification beyond North America’s primary growth corridor.
Key Regions and Countries
North America
- US
- Canada
Europe
- Germany
- France
- The UK
- Spain
- Italy
- Rest of Europe
Asia Pacific
- China
- Japan
- South Korea
- India
- Australia
- Rest of APAC
Latin America
- Brazil
- Mexico
- Rest of Latin America
Middle East and Africa
- GCC
- South Africa
- Rest of MEA
Drivers
Official competitions aggregate football audiences within trusted league ecosystems, giving fantasy operators a lower-friction acquisition channel than standalone paid advertising. Fantasy Premier League attracted more than 11.5 million participants in 2024/25, a record across its 23-year history. That participation milestone supports advertising, sponsorship, and ancillary-service monetization, though participation must not be equated with paying customers.
An illustrative operating case where league-originated traffic supplies 20 to 30% of registrations at an acquisition cost 15 to 25% below paid-media traffic reduces blended acquisition expenditure by approximately 3 to 7.5%. This supports a modeled +0.8 percentage-point contribution to the baseline CAGR. Operators that secure official-league distribution agreements ahead of competitors reduce their cost base while growing their registered user pool simultaneously.
| Driver | (~) % Impact on CAGR Forecast | Geographic Relevance | Impact Timeline |
|---|---|---|---|
| Official-league audience acquisition | +0.8% | Global; association football markets | Short term (≤ 2 years) |
| International American-football expansion | +0.5% | Europe; Brazil; North America | Medium term (2–4 years) |
| Private-league social retention | +0.4% | Global; established fantasy markets | Short term (≤ 2 years) |
| Mobile-first participation convenience | +0.3% | Global; mobile-led markets | Short term (≤ 2 years) |
| Recurring paid analytics subscriptions | +0.2% | North America; Europe | Medium term (2–4 years) |
Restraints
India’s Promotion and Regulation of Online Gaming Act received presidential assent on August 22, 2025, establishing a prohibition on online money games rather than a routine licensing obligation. The government’s 2026 rules framework reinforces the distinction between prohibited money games and permitted social gaming or e-sports. Sections 5 and 6 prohibit offering and advertising covered money games, removing the commercial pathway for affected paid fantasy-football contests entirely.
The modeled global CAGR deduction of 0.7 percentage points applies to the India-facing paid-contest segment, not all fantasy football and not free-entry participation. Operators must withdraw prohibited products and reassess recoverability of acquisition and technology spending. Any migration to non-money social formats requires a different monetization model rather than preservation of the previous entry-fee economics.
| Restraint | (~) % Impact on CAGR Forecast | Geographic Relevance | Impact Timeline |
|---|---|---|---|
| India’s online-money-game prohibition | −0.7% | India; cross-border India-facing operators | Short term (≤ 2 years) |
| Paid-contest licensing prerequisites | −0.4% | Great Britain; licensed-contest jurisdictions | Short term (≤ 2 years) |
| Premium statistical-feed access costs | −0.3% | Global; smaller commercial operators | Medium term (2–4 years) |
| Household discretionary-spending limits | −0.2% | Price-sensitive consumer markets | Short term (≤ 2 years) |
| Restricted access to growth capital | −0.2% | Early-stage platforms; emerging markets | Medium term (2–4 years) |
Challenges
Fantasy platforms face synchronized transaction demand because users make transfers, captain selections, and lineup changes near fixed deadlines rather than distributing activity evenly. Fantasy Premier League organizes its season into 38 gameweeks and closes changes 90 minutes before the opening fixture of each gameweek. Concentrating 25% of daily lineup writes into the final 15 minutes produces an average write rate approximately 24 times the full-day average, generating infrastructure failure risk that directly damages user retention.
This operational vulnerability supports a modeled −0.5 percentage-point growth friction through failed actions, support demand, and retention losses. Sustainable mitigation requires pre-deadline autoscaling, idempotent transaction handling, queue isolation, and separately budgeted peak-load testing. Reserving an illustrative 10 to 15% of engineering capacity for resilience work protects long-term customer value at the expense of near-term feature velocity.
| Challenge | (~) % CAGR Friction Drag | Geographic Relevance | Mitigation Horizon |
|---|---|---|---|
| Deadline-driven infrastructure load spikes | −0.5% | Global; large live competitions | Short term (≤ 2 years) |
| Multi-account contest integrity risks | −0.3% | Paid-contest markets | Medium term (2–4 years) |
| Off-season engagement continuity gaps | −0.3% | Global; season-long products | Medium term (2–4 years) |
| Cross-league scoring reconciliation complexity | −0.2% | Multi-league and international platforms | Medium term (2–4 years) |
| Specialist sports engineering shortages | −0.1% | Global; scaling platform teams | Long term (≥ 4 years) |
Opportunities
White-label licensing creates a separate contractual revenue stream by supplying reusable platform infrastructure to regional media organizations, sports clubs, and broadcasters that lack the engineering capacity to build their own products. The official Fantasy Premier League product operates free to play, demonstrating that large participant bases alone do not generate direct consumer-payment demand. Licensing a proven platform to business buyers bypasses this monetization limitation entirely.
An illustrative execution case targets reuse of 70 to 80% of core code and a 20 to 30% reduction in onboarding engineering hours after initial deployments. Repeat deployments that raise delivery utilization while keeping data-rights and customization costs controlled could improve contribution margin by an estimated 4 to 6 percentage points, supporting conditional CAGR upside of +0.6 percentage points. Early movers that sign and renew business contracts before the medium-term execution window closes establish recurring revenue advantages that later entrants cannot replicate through open-market competition alone.
| Opportunity | (~) % Potential CAGR Upside | Geographic Relevance | Execution Window |
|---|---|---|---|
| White-label business licensing | +0.6% | Global; regional media and clubs | Medium term (2–4 years) |
| Women’s football fantasy formats | +0.4% | Europe; North America; Australia | Medium term (2–4 years) |
| Accessible multilingual product localization | +0.3% | Underserved language communities | Medium term (2–4 years) |
| Employer-funded engagement competitions | +0.3% | Global; enterprise customers | Short term (≤ 2 years) |
| Specialist-tool acquisition roll-ups | +0.2% | North America; Europe | Long term (≥ 4 years) |
Key Company Insights
DraftKings reported consolidated fourth-quarter 2025 revenue of $1.989 billion, a 43% increase from $1.393 billion in Q4 2024. On March 2, 2026, DraftKings unveiled plans for a Sports and Casino Super App integrating 4 products through one account and wallet. This convergence strategy positions DraftKings to monetize users across sportsbook, predictions, casino, and lottery within a single session rather than competing for share across siloed platforms.
FanDuel held approximately 41% of online sports-betting market share in the states where its sportsbook operated during fiscal 2025, while its Flutter parent reported approximately $7.0 billion in U.S. division revenue across sports betting, iGaming, daily fantasy sports, and racing wagering. FanDuel held a separate 27% iGaming gross gaming revenue share in states where its casino operated.
On August 5, 2025, ESPN and the NFL announced an agreement under which ESPN would acquire the NFL’s fantasy product alongside NFL Network and linear RedZone rights, while the NFL receives a 10% equity stake in ESPN. This deal consolidates official NFL fantasy distribution under ESPN’s direct-to-consumer platform, which launched on August 21, 2025 at $29.99 monthly with integrated real-time fantasy statistics, applying direct competitive pressure on FanDuel and DraftKings for NFL audience share.
Key Players
- DraftKings
- FanDuel
- ESPN Fantasy Sports
- Yahoo Fantasy Sports
- Premier League Digital
- SoccerX
- FanTeam
- Dream11
- Superbru
- Bet365
- Other Key Players
Recent Developments
- August 25, 2026 – DraftKings closed a $700 million senior secured term loan B facility and a $750 million revolving credit facility, with the term loan maturing in August 2033 and the revolving facility maturing in August 2031.
- July 31, 2026 – Premier League announced real-time league rankings and projected bonus points for Fantasy Premier League 2026/27, with projected bonus points added to players’ scores after 20 minutes of each match.
- June 4, 2026 – FanDuel launched PokerStars exclusively on FanDuel in Ontario, with its accompanying update reporting more than 28 million poker hands dealt during the first 9 weeks of the earlier U.S. launch.
- April 1, 2026 – FanDuel launched PokerStars exclusively on FanDuel in Michigan, New Jersey, and Pennsylvania, combining player liquidity across 3 states and offering two $500,000 guaranteed Sunday Million tournaments.
- March 2, 2026 – DraftKings announced plans for its Sports and Casino Super App to integrate 4 products through one account and wallet, covering Sportsbook, Predictions, Casino, and Lottery in a planned rollout.
- December 19, 2025 – DraftKings launched DraftKings Predictions, a standalone mobile app and web product offering event contracts across 38 states.
- February 15, 2024 – DraftKings announced an agreement to acquire Jackpocket for approximately $750 million, with approximately 55% of consideration payable in cash and 45% in stock.
Report Scope
| Report Features | Description |
|---|---|
| Market Value (2025) | USD 3.9 Billion |
| Forecast Revenue (2035) | USD 12.2 Billion |
| CAGR (2026-2035) | 12.1% |
| Base Year for Estimation | 2025 |
| Historic Period | 2020-2024 |
| Forecast Period | 2026-2035 |
| Report Coverage | Revenue Forecast, Market Dynamics, Market Opportunity Analysis, Technology and Innovation Landscape, Competitive Landscape, Recent Developments |
| Segments Covered | By Product Type (Betting Integrations, Social Gaming), By Platform (Mobile Application, Website), By Revenue Model (Entry-Fee Based, Subscription Based, Advertising-Supported Free-To-Play, Others) |
| Regional Analysis | North America (US and Canada), Europe (Germany, France, The UK, Spain, Italy, and Rest of Europe), Asia Pacific (China, Japan, South Korea, India, Australia, and Rest of APAC), Latin America (Brazil, Mexico, and Rest of Latin America), Middle East and Africa (GCC, South Africa, and Rest of MEA) |
| Competitive Landscape | DraftKings, FanDuel, ESPN Fantasy Sports, Yahoo Fantasy Sports, Premier League Digital, SoccerX, FanTeam, Dream11, Superbru, Bet365, Other Key Players |
| Customization Scope | Customization for segments, region/country-level will be provided. Additional customization can be done based on requirements. |
| Purchase Options | We have three licenses to opt for: Single User License, Multi-User License (Up to 5 Users), Corporate Use License (Unlimited User and Printable PDF) |





































