


Report Overview
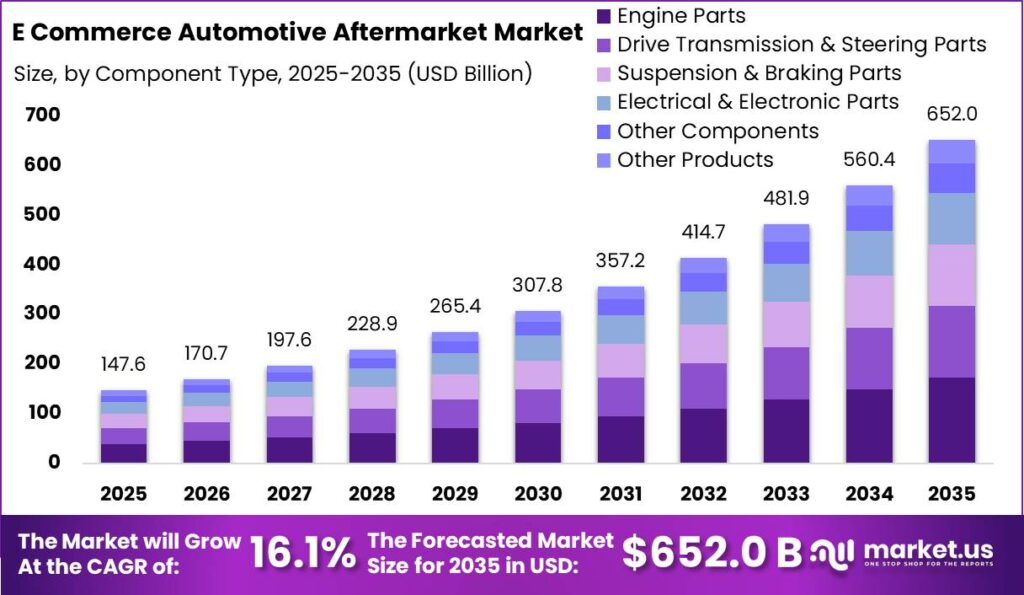
Global E-Commerce Automotive Aftermarket size is expected to be worth around USD 652.0 Billion by 2035 from USD 147.6 Billion in 2025, growing at a CAGR of 16.1% during the forecast period 2026 to 2035. This trajectory places the online channel among the fastest expanding segments of the broader automotive parts economy. Investors gain a decade long runway with compounding order volume.
The market covers online sale of replacement parts, accessories, and maintenance components for in use vehicles through digital channels. Platforms range from global marketplaces to specialist parts retailers and direct manufacturer sites. This structure spans consumer buyers and professional workshops. Therefore vendors must serve both price led shoppers and high frequency trade accounts across distinct fulfillment models.
Key Takeaways
- Global market size reaches USD 652.0 Billion by 2035 from USD 147.6 Billion in 2025 at a CAGR of 16.1%.
- Engine Parts led the By Component Type segment with a 26.7% share in 2025.
- B2C led the By Consumer Type segment with a 65.1% share in 2025.
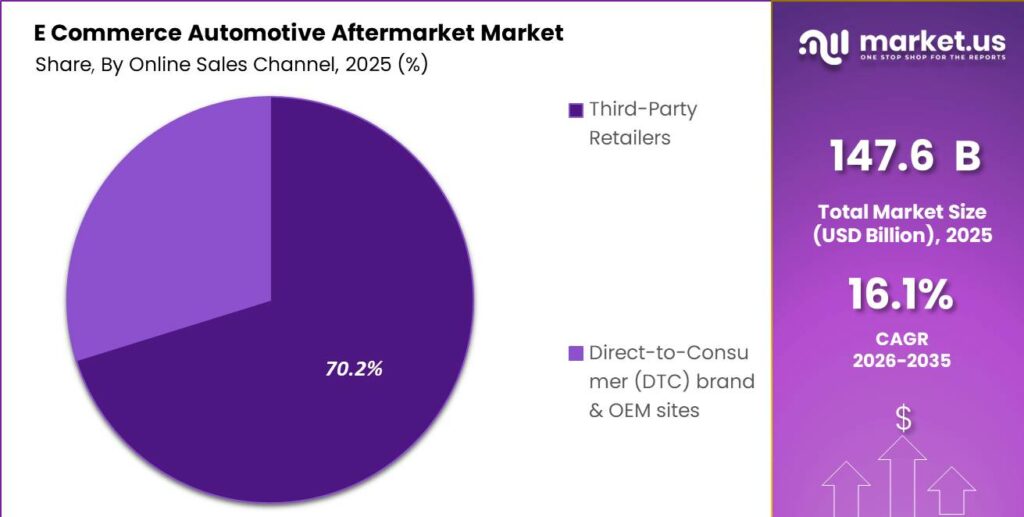
- Third Party Retailers led the By Online Sales Channel segment with a 70.2% share in 2025.
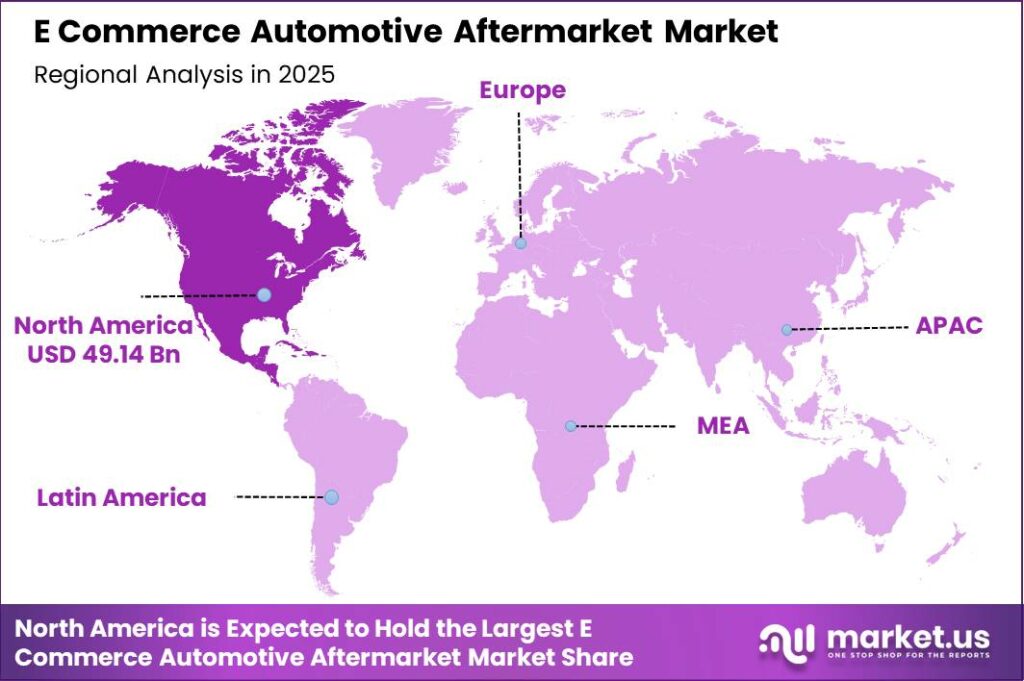
- North America dominated with a 33.3% share, valued at USD 49.14 Billion in 2025.
Government policy continues to shape online parts commerce through consumer protection, product safety, and cross border trade rules. Regulators in major markets now press marketplaces to verify parts authenticity and seller identity. This pressure raises compliance cost for platforms. However it also protects trusted sellers from counterfeit competition, rewarding vendors that invest early in verified supplier networks and traceable inventory systems.
As reported by the Auto Care Association, U.S. e-commerce automotive aftermarket sales are expected to grow 4.6% in 2025 excluding marketplaces. This steady domestic pace reflects a maturing base rather than a slowdown. Sponsorship signals reinforce the shift, as O’Reilly Auto Parts became title sponsor of NASCAR’s second tier series from January 2026. Consequently established retailers now spend on brand reach to defend digital demand.
Data from the Auto Care Association shows online aftermarket sales including marketplaces will grow above 5% annually through 2030. Rising vehicle age lifts repair frequency, which pushes owners toward online parts sourcing. This means platforms with deep catalogues capture more repeat purchases. Early investment in fitment accuracy converts that demand into durable customer lifetime value across both retail and trade segments.
Component Type Analysis
Engine Parts dominates with 26.7% due to frequent wear replacement across aging fleets.
In 2025, Engine Parts held a dominant market position in the By Component Type segment of E Commerce Automotive Aftermarket Market, with a 26.7% share. Data from the U.S. Census Bureau shows retail e-commerce grew 9.8% year over year in Q1 2026, far above the 3.9% pace of total retail. This gap steers component buyers online. Therefore engine parts sellers gain the largest addressable pool of price comparing shoppers.
Drive Transmission and Steering Parts serve buyers replacing high stress mechanical components on older vehicles. As reported by Eurostat, 77% of European Union internet users purchased goods or services online in 2024, up from 59% in 2014. This adoption curve widens the buyer base for complex parts. Consequently vendors that add clear fitment tools convert more of these searches into completed drivetrain orders.
Suspension and Braking Parts attract safety driven buyers who prioritize verified quality over lowest price. These heavy categories carry high return sensitivity when fitment fails. This creates margin risk for platforms without VIN matching. Sellers that guarantee correct fit reduce costly reverse logistics and build repeat trust among workshop and DIY customers alike.
Electrical and Electronic Parts rank as the fastest growing component category as vehicles add sensors and modules. Other Components and Other Products fill the remaining share collectively, covering filtration, fluids, and accessory lines. This breadth lets platforms bundle high margin add ons with core repairs. As a result average order value rises without added acquisition spend.
Consumer Type Analysis
B2C dominates with 65.1% due to direct DIY and consumer repair purchasing.
In 2025, B2C held a dominant market position in the By Consumer Type segment of E Commerce Automotive Aftermarket Market, with a 65.1% share. According to the Auto Care Association, U.S. online aftermarket parts sales excluding marketplaces are forecast at about USD 23 Billion in 2025. This scale confirms consumer led demand. Therefore platforms should optimize checkout speed and fitment clarity to convert individual buyers efficiently.
B2B ranks as the fastest growing consumer type as independent workshops digitize procurement. Professional accounts place frequent, high value orders under negotiated pricing and credit terms. This behavior lifts platform revenue per account far above consumer levels. Consequently vendors that build trade portals with stock visibility capture a concentrated, high frequency buyer base ahead of slower rivals.
Both segments increasingly overlap as DIY consumers migrate toward semi professional repair on aging vehicles. This blending pushes platforms to unify catalogues while separating pricing tiers. Sellers that segment offers by buyer type protect consumer margin while rewarding trade loyalty. As a result they defend share across the full ownership and repair spectrum.
Online Sales Channel Analysis
Third Party Retailers dominates with 70.2% due to broad marketplace reach and trust.
In 2025, Third Party Retailers held a dominant market position in the By Online Sales Channel segment of E Commerce Automotive Aftermarket Market, with a 70.2% share. Based on Auto Care Association data, U.S. online aftermarket parts sales including marketplaces reach USD 44.6 Billion in 2025. This concentration favors scaled platforms. Therefore smaller sellers must join marketplaces to access buyer traffic they cannot build alone.
Direct to Consumer brand and OEM sites rank as the fastest growing channel as manufacturers court buyers directly. CarParts.com reported net sales of USD 151.9 Million in Q2 2025, a 5% year over year rise through its online platform. This growth shows specialist sites can scale. Consequently OEMs that own the customer relationship capture data and margin lost to intermediaries.
Marketplace dependence exposes sellers to fee pressure and thin differentiation on shared listings. Direct channels reduce that exposure but demand heavy traffic investment. This tradeoff shapes channel strategy. Vendors that balance marketplace reach with owned site loyalty programs stabilize acquisition cost while protecting long term brand equity.
Key Market Segments
By Component Type
- Engine Parts
- Drive Transmission & Steering Parts
- Suspension & Braking Parts
- Electrical & Electronic Parts
- Other Components
- Other Products
By Consumer Type
- B2C (Business to Consumer)
- B2B (Business to Business)
By Online Sales Channel
- Third Party Retailers
- Direct to Consumer (DTC) brand & OEM sites
Regional Analysis
North America Dominates the E Commerce Automotive Aftermarket Market with a Market Share of 33.3%, Valued at USD 49.14 Billion
North America led the market in 2025 with a 33.3% share, valued at USD 49.14 Billion. High vehicle ownership, mature logistics, and strong DIY culture anchor this position. As per our research, dense warehouse networks enable fast delivery that consumers now expect. Therefore platforms operating here defend share through fulfillment speed rather than price alone.
Asia Pacific ranks as the fastest growing region as vehicle ownership and digital payments expand across India and Southeast Asia. Rising middle class demand pushes more repair spend online. This shift opens early mover advantage in underpenetrated cities. Consequently platforms that localize catalogues and payment options capture share before entrenched competitors arrive.
Key Regions and Countries
North America
- US
- Canada
Europe
- Germany
- France
- The UK
- Spain
- Italy
- Rest of Europe
Asia Pacific
- China
- Japan
- South Korea
- India
- Australia
- Rest of APAC
Latin America
- Brazil
- Mexico
- Rest of Latin America
Middle East and Africa
- GCC
- South Africa
- Rest of MEA
Market Dynamics
Market Opportunity Analysis - Underserved trade buyers, emerging Asian cities, and the fast growing electronics category offer entry points for new players
The B2B professional channel remains the deepest underexploited pool for new entrants. Independent workshops buy the majority of parts by value, yet under 25% of that spend runs through digital platforms. This gap persists because legacy phone and fax ordering still dominates trade procurement. Therefore new platforms that digitize account pricing and credit terms convert a captive, high frequency buyer base quickly.
Asia Pacific stands out as the fastest growing region and the widest geographic opening. Rising vehicle ownership across India and Southeast Asia meets low current online penetration. This mismatch leaves tier two and tier three cities largely uncontested. Consequently entrants that localize catalogues and payment options establish brand loyalty before global platforms scale locally.
Within components, Electrical and Electronic Parts is the fastest growing category and a prime niche target. Modern vehicles add sensors and control modules that fail and need replacement. This trend expands a high value catalogue segment. Instead of competing on commodity engine parts, new sellers can specialize in electronics to win margin rich, technically demanding orders.
Technology and Innovation Landscape - Fitment verification, mobile commerce, and connected vehicle data reshape competitive advantage
AI powered fitment verification and VIN based parts catalogues form the core technology battleground. These tools cut costly return rates by matching parts to exact vehicle variants. This capability directly protects margin in a category where returns destroy profit. Therefore platforms investing in accurate fitment data gain a defensible edge over price only competitors.
Mobile commerce and app based ordering expand reach among younger vehicle owners. App driven purchase lowers friction and captures impulse and urgent repair demand. This shift favors platforms with strong mobile interfaces in emerging markets. As a result vendors that optimize for smartphone buyers convert a rising share of first time online parts customers.
Telematics integrated predictive ordering links connected vehicle data to parts demand. Sensors flag wear before failure, prompting timely replacement orders. This model shifts platforms from reactive selling to proactive supply. Consequently firms that build OEM data partnerships lock in recurring, predictable demand that rivals without vehicle data cannot easily match.
Drivers
The Automotive Aftermarket gains its strongest push from an expanding and aging global vehicle fleet. The global vehicle parc exceeded 1.5 billion units by 2025, while the average U.S. passenger vehicle reached 12.6 years and the European Union neared 12.1 years. High new car prices near USD 48,000 to USD 50,000 delayed fleet turnover. Therefore owners keep older vehicles longer, lifting paid repair demand online.
Vehicles aged 8 to 15 years generate annual parts spend of USD 700 to USD 1,200, far above USD 200 to USD 400 for newer cars. Price sensitive owners drive online comparison, with 65% to 75% of purchases for older vehicles starting online. This means the aging parc converts directly into e-commerce volume, rewarding platforms with deep catalogues and accurate fitment.
| Driver | (~) % Impact on CAGR Forecast | Geographic Relevance | Impact Timeline |
|---|---|---|---|
| Expanding Global Vehicle Parc & Rising Average Vehicle Age Increasing Aftermarket Parts Demand | +4.50% | Global — North America, Europe, Asia Pacific, Latin America | Short term (≤ 2 years) |
| Consumer Shift to Online Parts Sourcing Driven by Price Transparency & Next-Day Delivery Expectations | +3.80% | United States, Europe, China, India, Southeast Asia | Short term (≤ 2 years) |
| DIY Repair Culture & Independent Workshop Digital Procurement Adoption Accelerating Channel Migration | +2.60% | United States, Germany, United Kingdom, Australia, India | Short term (≤ 2 years) |
| AI-Powered Fitment Verification & VIN-Based Parts Catalogue Technology Reducing Return Rates | +2.10% | North America, Europe, China | Medium term (2–4 years) |
| Mobile Commerce & App-Based Parts Ordering Penetration Among Younger Vehicle Owners | +1.55% | India, Southeast Asia, China, Latin America, Middle East | Short term (≤ 2 years) |
| OEM & Tier-1 Supplier Direct-to-Consumer Online Parts Channel Expansion | +0.95% | North America, Europe, Japan, South Korea | Medium term (2–4 years) |
Restraints
High parts return rates from fitment errors erode platform margins. A single part number may fit one variant but fail an adjacent one, creating over 900,000 unique SKUs in major catalogues. U.S. online parts return rates reach 15% to 22%, roughly 3 to 5 times general e-commerce. This means platforms without VIN decoding absorb steep reverse logistics cost.
Reverse logistics costs run USD 12 to 40 for small parts and USD 35 to 90 for medium components. A 20% return rate can cut category gross margin from 27% to near 10% to 13%. This compresses EBITDA below the 5% to 8% profitability threshold. Consequently sellers must fix fitment accuracy before scaling paid acquisition.
| Restraint | (~) % Impact on CAGR Forecast | Geographic Relevance | Impact Timeline |
|---|---|---|---|
| High Parts Return Rates Due to Fitment Errors Generating Logistics Cost & Margin Destruction | -2.80% | Global — most acute in fragmented multi-make aftermarket markets | Short term (≤ 2 years) |
| Counterfeit & Substandard Parts Proliferation Undermining Consumer Trust in Online Channels | -1.90% | India, Southeast Asia, Latin America, Middle East, Africa | Short term (≤ 2 years) |
| Fragmented SKU Catalogue Complexity & Parts Data Standardisation Deficit Blocking Catalogue Completeness | -1.20% | India, Southeast Asia, Latin America, Middle East | Short term (≤ 2 years) |
| Last-Mile Delivery Logistics Costs for Heavy & Bulky Automotive Parts Compressing Platform Margins | -0.85% | Global — most acute for suspension, exhaust & body parts categories | Short term (≤ 2 years) |
| Traditional Trade Channel Resistance & OEM Dealer Network Active Opposition to Online Parts Sales | -0.52% | Europe, Japan, South Korea, GCC | Medium term (2–4 years) |
Challenges
The EV parts catalogue gap creates a widening challenge as early battery electric fleets from 2018 to 2021 exit warranty. Standardized systems catalogue fewer than 35% to 45% of relevant BEV service parts, versus over 85% for equivalent combustion categories. This gap defaults owners to dealer channels at price premiums of 40% to 80%. Therefore platforms lose a fast emerging revenue pool.
Closing this gap opens a fresh revenue stream for early movers. Platforms must invest USD 15 to 40 Million in EV data partnerships and inventory over 2 to 4 years to reach 70% to 80% catalogue coverage. This means firms building BEV fitment data now capture out of warranty demand first. As a result they lock in loyalty before rivals respond.
| Challenge | (~) % CAGR Friction Drag | Geographic Relevance | Mitigation Horizon |
|---|---|---|---|
| EV Parts Catalogue & Inventory Readiness Gap | -1.60% | China, Europe, North America | Medium term (2–4 years) |
| Warehouse Network Density & Same-Day Fulfilment Scalability | -1.30% | India, Southeast Asia, Latin America, Middle East, Africa | Long term (≥ 4 years) |
| Pricing Transparency & Margin Compression from Aggregator Competition | -1.00% | North America, Europe, China, Australia | Long term (≥ 4 years) |
| Cross-Border Customs & Import Duty Complexity for International Parts Sourcing | -0.75% | Southeast Asia, Latin America, Africa, Middle East | Medium term (2–4 years) |
| Digital Literacy & Online Payment Infrastructure Gaps in Tier-3 Markets | -0.52% | India, Sub-Saharan Africa, Southeast Asia, Latin America | Long term (≥ 4 years) |
Opportunities
B2B digital procurement for independent workshops and fleets marks the clearest white space. Europe holds 450,000 to 550,000 independent repair shops and North America over 200,000, buying 55% to 65% of parts by value. Yet under 25% of that spend runs through digital B2B platforms. Therefore early movers can capture a concentrated, high frequency buyer base.
The unit economics favor B2B heavily. A workshop generates annual platform value of USD 50,000 to 220,000, versus USD 300 to 700 for a consumer, with margins of 28% to 38%. This gap yields LTV to CAC ratios up to 180 times. Consequently platforms investing USD 20 to 60 Million in trade infrastructure secure durable regional advantage.
| Opportunity | (~) % Potential CAGR Upside | Geographic Relevance | Execution Window |
|---|---|---|---|
| B2B Digital Procurement Platform for Independent Workshop & Fleet Operator Segments | +2.80% | North America, Europe, India, Southeast Asia, GCC | Medium term (2–4 years) |
| Subscription-Based Maintenance & Predictive Replacement Programme Monetisation | +2.00% | North America, Europe, GCC, Australia | Long term (≥ 4 years) |
| India & Southeast Asia Tier-2 & Tier-3 City Online Parts Market Penetration | +1.55% | India, Indonesia, Vietnam, Philippines, Bangladesh | Short term (≤ 2 years) |
| Remanufactured & Circular Economy Parts Online Channel Development | +1.10% | Europe, North America, Japan, Australia | Medium term (2–4 years) |
| Telematics-Integrated Predictive Parts Ordering via Connected Vehicle Data | +0.75% | North America, Europe, China, South Korea | Long term (≥ 4 years) |
Key Company Insights
Amazon.com, Inc. leverages unmatched fulfillment scale to lead online parts distribution across regions. Worldwide net sales rose 9% to USD 638.0 Billion in 2024, reinforcing its retail reach. This scale lets Amazon undercut delivery times rivals cannot match. However thin parts fitment data raises return risk, leaving room for specialists that verify compatibility more accurately.
Alibaba Group Holding Limited anchors online parts commerce across Asia Pacific through vast marketplace supplier networks. E-commerce reached 16.9% of U.S. retail in Q1 2026, signaling how far online channels can climb in developing regions Alibaba serves. This positioning captures early demand in fast growing markets. However counterfeit exposure on open marketplaces threatens buyer trust and long term loyalty.
Key Players
- Amazon.com, Inc.
- Alibaba Group Holding Limited
- eBay Inc.
- Advance Auto Parts, Inc.
- AutoZone, Inc.
- O’Reilly Auto Parts
- NAPA Auto Parts
- RockAuto, LLC
- CarParts.com, Inc.
- Pep Boys – Manny, Moe & Jack
- Denso Corporation
- Robert Bosch GmbH
- Flipkart Private Limited
- Delticom AG
- LKQ Corporation
- Others
Geopolitical Impact Analysis
According to the WTO, rising tariffs on Chinese origin goods reshape aftermarket parts sourcing and pricing. U.S. Section 301 tariffs on many Chinese auto components reach 25%, while broader 2025 duties pushed some parts rates above 50%. Many aftermarket parts still originate in China. Therefore platforms face higher landed costs that squeeze margins or lift consumer prices.
As reported by UNCTAD, Red Sea shipping disruption rerouted vessels around Africa, adding 10 to 14 days of transit and lifting container rates over 150% at peak. Heavy, bulky parts depend on ocean freight. This means longer lead times strain inventory planning. Consequently platforms diversify suppliers toward Mexico and Southeast Asia to shorten supply chains and protect delivery promises.
Recent Developments
- February 2026: Genuine Parts Company announced a plan to separate its automotive parts business, including NAPA, and its industrial parts business into two independent publicly traded companies.
- January 2026: LKQ Corporation announced a strategic alternatives review, including a possible sale of the company, while continuing efforts to sell Keystone Automotive Operations.
- November 2025: LKQ Corporation was reported to be preparing a sale of Keystone Automotive Industries, its specialty automotive parts division, as part of portfolio streamlining.
Report Scope
| Report Features | Description |
|---|---|
| Market Value (2025) | USD 147.6 Billion |
| Forecast Revenue (2035) | USD 652.0 Billion |
| CAGR (2026-2035) | 16.1% |
| Base Year for Estimation | 2025 |
| Historic Period | 2020-2024 |
| Forecast Period | 2026-2035 |
| Report Coverage | Revenue Forecast, Market Dynamics, Market Opportunity Analysis, Technology and Innovation Landscape, Competitive Landscape, Recent Developments |
| Segments Covered | By Component Type (Engine Parts, Drive Transmission & Steering Parts, Suspension & Braking Parts, Electrical & Electronic Parts, Other Components, Other Products), By Consumer Type (B2C, B2B), By Online Sales Channel (Third Party Retailers, Direct to Consumer brand & OEM sites) |
| Regional Analysis | North America (US and Canada), Europe (Germany, France, The UK, Spain, Italy, and Rest of Europe), Asia Pacific (China, Japan, South Korea, India, Australia, and Rest of APAC), Latin America (Brazil, Mexico, and Rest of Latin America), Middle East and Africa (GCC, South Africa, and Rest of MEA) |
| Competitive Landscape | Amazon.com Inc., Alibaba Group Holding Limited, eBay Inc., Advance Auto Parts Inc., AutoZone Inc., O’Reilly Auto Parts, NAPA Auto Parts, RockAuto LLC, CarParts.com Inc., Pep Boys, Denso Corporation, Robert Bosch GmbH, Flipkart Private Limited, Delticom AG, LKQ Corporation, Others |
| Customization Scope | Customization for segments, region / country-level will be provided. Additional customization can be done based on requirements. |
| Purchase Options | We have three licenses to opt for: Single User License | Multi-User License (Up to 5 Users) | Corporate Use License (Unlimited User and Printable PDF) |





































