


Report Overview
Global Dropshipping Market size is expected to be worth around USD 6,105.3 Billion by 2035 from USD 439.7 Billion in 2025, growing at a CAGR of 30.2% during the forecast period 2026 to 2035. This trajectory signals one of the fastest expansion rates in modern retail. Investors gain a rare window to enter before margins compress at scale.
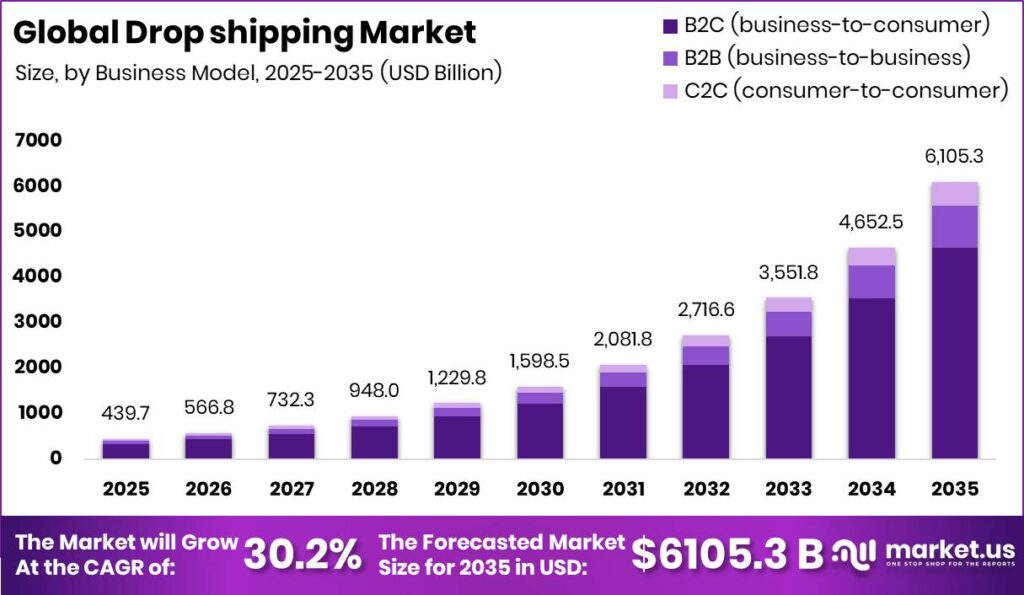
The E-Commerce dropshipping model lets retailers sell goods without holding stock, while third party suppliers ship orders directly to buyers. This structure removes warehousing and upfront inventory costs. As a result, the market splits across product type, business model, sales channel, and destination type, giving operators multiple entry formats and lowering the capital needed to launch a functional online store.
Key Takeaways
- Global Dropshipping Market will reach USD 6,105.3 Billion by 2035, up from USD 439.7 Billion in 2025.
- The market is growing at a CAGR of 30.2% across the 2026 to 2035 forecast period.
- Fashion & Apparel leads By Product Type with a 35.5% share.
- B2C dominates By Business Model with a 76.3% share.
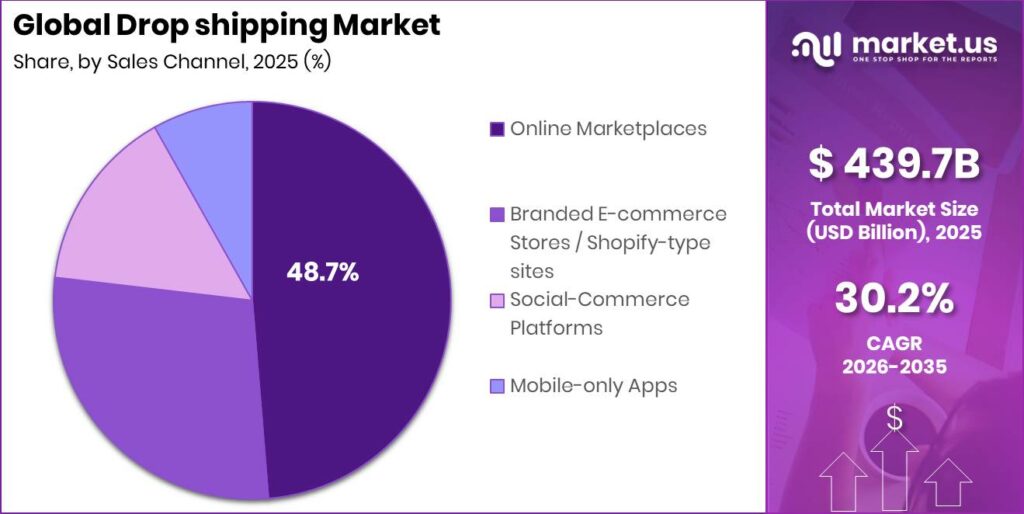
- Online Marketplaces lead By Sales Channel with a 48.7% share.
- Cross-border Dropshipping leads By Destination Type with a 55.7% share.
- Asia Pacific dominates the market with a 35.5% share, valued at USD 156.08 Billion.
Government trade policy now shapes market direction more than any single technology. Data from DHL shows 71% of dropshipping businesses sell through online marketplaces, which concentrates operator dependence on a few platform rules. This means a policy shift on one marketplace can strand thousands of stores overnight. Operators who diversify channels early protect revenue against sudden platform enforcement.
Platform infrastructure keeps lowering the technical barrier for new merchants. In January 2026, Shopify and Google launched the Universal Commerce Protocol, an open standard that lets AI agents discover products and complete purchases across merchants. This reflects a structural push toward agent driven buying. Consequently, dropshipping stores that adopt machine readable product feeds early will capture discovery traffic before competitors adjust their catalogs.
Product Type Analysis
Fashion & Apparel dominates with 35.5% due to high repeat purchase frequency online.
In 2025, Fashion & Apparel held a dominant market position in the By Product Type segment of Dropshipping Market, with a 35.5% share. Fashion e-commerce revenue reached over USD 920 Billion globally in 2025, according to sector tracking. This large base gives dropshippers deep product variety to test. Operators who rotate trend driven apparel fast will outpace slower catalog based sellers.
Electronics & Media serves buyers who compare specifications and price before ordering. UNCTAD estimates global e-commerce sales reached USD 27 Trillion in 2022, a base heavily weighted toward standardized electronics. This means margin pressure runs high on identical goods sold across many stores. Sellers who bundle accessories or warranties will defend margin better than pure price competitors in this segment.
Home, Furniture & Appliances attracts buyers seeking bulky items they prefer not to transport. Retail e-commerce sales reached roughly USD 5,858 Billion globally in 2023, giving this category a vast demand pool. Shipping cost and damage risk stay elevated here. Operators who partner with regional suppliers cut delivery times and reduce return rates that erode profit.
Health, Beauty & Personal Care ranks as the fastest-growing product type on strong reorder behavior. Toys, Hobby & DIY and Other Products, including auto parts and pet supplies, hold the remaining share collectively. These niches reward focused targeting. Sellers who build category authority in one narrow niche win loyalty that broad generalist stores rarely achieve.
Business Model Analysis
B2C dominates with 76.3% due to direct consumer reach through storefronts.
In 2025, B2C held a dominant market position in the By Business Model segment of Dropshipping Market, with a 76.3% share. UNCTAD data shows global e-commerce sales exceeded USD 27 Trillion, with B2C flows forming a major slice. This scale rewards operators who reach individual buyers directly. Stores that own the customer relationship keep pricing power that resellers lack.
B2B dropshipping serves resellers and small retailers who reorder in volume. DHL surveyed 4,050 e-commerce businesses across 19 countries for its 2025 report, confirming a large commercial buyer base. This means recurring bulk orders stabilize revenue. Operators serving B2B clients gain predictable cash flow that consumer facing stores struggle to match.
C2C dropshipping links individual sellers to individual buyers through open platforms. Cross-border consumer flows covered 31,000 shoppers across 37 countries in the IPC 2024 survey, showing wide peer to peer participation. This creates low barrier entry for casual sellers. Platforms that simplify listing and payment will capture the long tail of these micro merchants.
Sales Channel Analysis
Online Marketplaces dominate with 48.7% due to built-in shopper traffic and trust.
In 2025, Online Marketplaces held a dominant market position in the By Sales Channel segment of Dropshipping Market, with a 48.7% share. DHL found that 71% of dropshipping businesses sell through online marketplaces. This concentration shows where buyers already gather. Operators who list on established marketplaces skip the high cost of building traffic from zero.
Branded E-commerce Stores let operators control design, pricing, and customer data on their own domain. DHL reported 87% of e-commerce businesses keep an active social media presence to drive this traffic. This means owned stores depend heavily on external promotion. Sellers who master social funnels convert followers into direct buyers without marketplace fees.
Social-Commerce Platforms turn discovery and checkout into one flow inside apps. DHL surveyed 24,000 online shoppers across 24 countries, confirming broad appetite for in app buying. This shortens the path from interest to purchase. Mobile-only Apps hold the remaining share, serving buyers who shop entirely on handsets and reward fast loading storefronts.
Destination Type Analysis
Cross-border Dropshipping dominates with 55.7% due to wide low-cost supplier sourcing.
In 2025, Cross-border Dropshipping held a dominant market position in the By Destination Type segment of Dropshipping Market, with a 55.7% share. IPC found that only 10% of cross-border packages took more than 15 days in transit in 2024, down from 17% in 2023. This means faster delivery now supports the international model. Operators tapping overseas suppliers access product variety that domestic only sellers cannot match.
Domestic Dropshipping serves buyers who value fast delivery and easy returns within one country. TopDawg’s platform offered more than 500,000 U.S. shipped products during 2025, showing deep domestic supplier scale. This means shorter transit times and lower dispute rates. Operators who shift to domestic sourcing protect conversion when cross-border shipping delays rise.
Key Market Segments
By Product Type
- Fashion & Apparel
- Electronics & Media
- Home, Furniture & Appliances
- Health, Beauty & Personal Care
- Toys, Hobby & DIY
- Other Products (auto parts, pet supplies, niche)
By Business Model
- B2C (business-to-consumer)
- B2B (business-to-business)
- C2C (consumer-to-consumer)
By Sales Channel
- Online Marketplaces
- Branded E-commerce Stores / Shopify-type sites
- Social-Commerce Platforms
- Mobile-only Apps
By Destination Type
- Cross-border / International Dropshipping
- Domestic Dropshipping
Regional Analysis
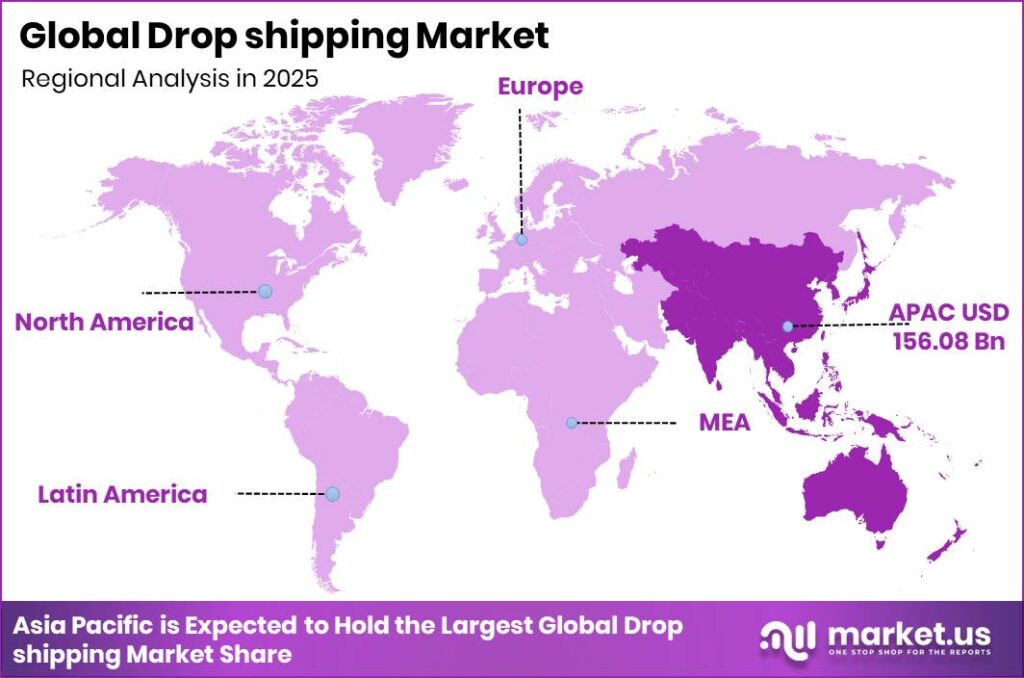
Asia Pacific Dominates the Dropshipping Market with a Market Share of 35.5%, Valued at USD 156.08 Billion
As per our research, Asia Pacific led the Dropshipping Market with a 35.5% share, valued at USD 156.08 Billion. The region hosts dense supplier networks and low product costs through Cross-Border E-Commerce routes. This gives regional operators a sourcing edge. Companies basing supply chains here cut landed costs that Western only sellers cannot reach.
North America stands out for high average order values and mature payment rails. This means each conversion returns more revenue per buyer. However, rising advertising costs squeeze margins here. Operators who invest in customer retention will defend profit better than those chasing only new buyer acquisition through paid channels.
Key Regions and Countries
North America
- US
- Canada
Europe
- Germany
- France
- The UK
- Spain
- Italy
- Rest of Europe
Asia Pacific
- China
- Japan
- South Korea
- India
- Australia
- Rest of APAC
Latin America
- Brazil
- Mexico
- Rest of Latin America
Middle East and Africa
- GCC
- South Africa
- Rest of MEA
Market Dyamics
Market Opportunity Analysis - Underserved regions and premium destination models offer entry points for new operators
omestic Dropshipping stays underexploited despite Cross-border holding 55.7% of the destination market. Domestic sourcing cuts transit time and dispute rates that erode cross-border margins. This means faster delivery becomes a defensible edge. New entrants who build domestic supplier networks in Asia Pacific capture buyers frustrated by long international shipping windows.
The C2C business model remains thin next to B2C at 76.3% share. Peer to peer selling attracts casual merchants who need low barrier tools. This creates room for platforms serving the long tail of micro sellers. Investors backing simple listing and payment infrastructure can capture demand that large B2C stores overlook entirely.
Health, Beauty & Personal Care ranks as the fastest-growing product type yet trails Fashion & Apparel at 35.5%. Strong reorder behavior in this category supports recurring revenue. Instead of one time sales, operators build repeat purchase flows here. Early movers who lock in category authority gain customer loyalty before the niche saturates with competitors.
Technology and Innovation Landscape - AI search and open commerce protocols reshape merchant discovery
Shopify’s acquisition of Vantage Discovery embeds AI powered search into its platform serving millions of merchants. Better product discovery raises conversion for dropshipping stores buried in large catalogs. This means AI ranking directly lifts revenue per visitor. Merchants who optimize product data for these engines will surface ahead of competitors relying on manual listings.
Shop Pay demonstrates how checkout technology lifts performance, raising checkout to order conversion by up to 50% versus guest checkout. Faster payment completion recovers buyers who abandon slow forms. This reflects the margin value of frictionless payment rails. Operators who adopt one click checkout convert more of their existing traffic without extra ad spend.
NetSuite notes that dropshipping separates selling from fulfillment, holding 0 units of inventory at the retailer while suppliers ship orders directly. This model eliminates warehouse cost entirely. As a result, capital shifts from stock to marketing and technology. Operators who reinvest freed capital into automation scale faster than inventory bound rivals.
Drivers
The foundational driver is compounding growth in global e-commerce volume. Retail e-commerce reached about USD 6.3 Trillion in 2024, while active smartphone connections passed 6.9 Billion by year end. This expands the reachable buyer base to nearly every connected adult across 190+ countries. Operators launch payment enabled stores without any physical retail, warehousing, or logistics footprint.
The core mechanism is a collapse in launch cost. A functional dropshipping store now needs USD 200 to 800 in startup capital, versus USD 15,000 to 80,000 for an inventory holding business. This 20 to 100x capital advantage made dropshipping the preferred entry format for the estimated 40 to 60 Million new micro merchants who joined e-commerce through 2022 to 2025. Low friction pulls fresh operators into the market fast.
| Driver | (~) % Impact on CAGR Forecast | Geographic Relevance | Impact Timeline |
|---|---|---|---|
| Global E-Commerce Volume Expansion & Mobile Commerce Proliferation Lowering Store Launch Barriers | +8.50% | Global — led by North America, Europe, Asia Pacific, Latin America | Short term (≤ 2 years) |
| AI-Powered Product Research, Ad Creative & Store Automation Tools Accelerating Operator Scaling | +6.80% | Global — North America, Europe, Southeast Asia, India | Short term (≤ 2 years) |
| Social Commerce & Influencer-Driven Product Discovery Reducing Paid Customer Acquisition Costs | +5.20% | Global — TikTok Shop markets, Instagram-heavy North America & Europe | Short term (≤ 2 years) |
| Zero-Inventory Business Model Attracting Entrepreneurship & Side-Income Seekers Post-Pandemic | +4.10% | North America, Europe, India, Southeast Asia, Latin America | Short term (≤ 2 years) |
| Expanding Cross-Border E-Commerce Infrastructure & Supplier Platform Maturity | +3.40% | Global — China-origin supply chains serving North America, Europe, MENA | Medium term (2–4 years) |
| SaaS E-Commerce Platform Ecosystem Lowering Technical & Operational Setup Friction | +2.20% | Global — highest adoption in North America, Europe, Australia | Short term (≤ 2 years) |
Restraints
The root cause is the U.S. reversal on the Section 321 de minimis exemption, which had let parcels below USD 800 enter duty free. Executive actions in February 2025 suspended this for China and Hong Kong goods, imposing a duty of 30% of value or USD 25 per item, rising to USD 50 per item from June 2025. This erased the landed cost edge behind China sourced dropshipping.
The impact runs deep on unit economics. A product with a supplier cost of USD 8 to 15 and a retail price of USD 25 to 45 once earned 45 to 65% gross margin. New duties now add USD 25 to 50 per parcel, turning profit into a per order loss of USD 5 to 25. This forces operators to raise prices, switch suppliers, or exit the U.S. market entirely.
| Restraint | (~) % Impact on CAGR Forecast | Geographic Relevance | Impact Timeline |
|---|---|---|---|
| US De Minimis Threshold Reduction & Tariff Policy on Low-Value China-Origin Parcels | -5.80% | United States — demand signal effects globally via supply chain disruption | Short term (≤ 2 years) |
| Digital Advertising Platform Cost Inflation Compressing Dropshipping Margin Envelopes | -3.50% | Global — most acute in North America & Western Europe | Short term (≤ 2 years) |
| Consumer Protection & Product Liability Regulation Tightening in EU & UK Markets | -2.10% | European Union, United Kingdom | Short term (≤ 2 years) |
| Payment Processor & Platform Account Suspension Risk Disrupting Active Revenue Operations | -1.40% | Global — most acute for cross-border USD-denominated stores | Short term (≤ 2 years) |
| Marketplace Platform Policy Restrictions on Dropshipping Listings & Fulfillment Compliance | -0.90% | United States, Europe, Australia — eBay, Amazon, Etsy-dependent operators | Short term (≤ 2 years) |
Challenges
The structural weakness is a principal agent gap between operators and suppliers. Operators own the customer relationship and bear refund liability, while suppliers control quality, packaging, and timing with no downstream exposure. Platform dispute resolution takes 15 to 45 days and needs 3 to 5 consumer complaints before arbitration opens. This delay leaves operators absorbing losses they cannot quickly recover.
The cost cascade is severe. Quality failure rates on general merchandise run 8 to 15% of orders, and chargeback rates above 2.0% trigger processor account suspension within 30 to 60 days. Each incident costs USD 25 to 80, cutting affected margins from 30 to 45% down to 10 to 20%. Operators must diversify suppliers and inspect samples to survive at scale.
| Challenge | (~) % CAGR Friction Drag | Geographic Relevance | Mitigation Horizon |
|---|---|---|---|
| Supplier Reliability & Quality Consistency Failures | -3.80% | Global — China-origin supply chains most acute | Long term (≥ 4 years) |
| Extended Shipping Lead Times Driving Chargeback Rates | -2.90% | Global — cross-border routes to North America, Europe, Oceania | Medium term (2–4 years) |
| Market Saturation & Niche Replication Speed | -2.20% | Global — concentrated in high-volume consumer product niches | Long term (≥ 4 years) |
| Brand Building & Customer Retention Economics | -1.60% | Global — most acute for independent DTC dropshipping stores | Long term (≥ 4 years) |
| Counterfeit & IP Infringement Exposure | -1.10% | Global — highest risk in fashion, electronics, and branded goods | Medium term (2–4 years) |
Opportunities
The untapped white space is the transition from commodity arbitrage to private label brands. The dominant model in 2025 to 2026 resells unbranded goods at 8 to 18% net margin, with repeat purchase rates near 3 to 8% and exit multiples of just 0.5 to 1.5x revenue. This leaves zero brand equity. Operators who own a brand escape the price war that commodity sellers cannot.
The unit economics reward the shift. A validated product moving from USD 28 retail at 35 to 42% margin to a private label at USD 38 to 48 earns 48 to 58% margin and 18 to 28% repeat rates, a 2.5 to 4x revenue per customer gain. A USD 2,000 to 8,000 production run over 6 to 12 months builds an asset selling at 3 to 5x revenue. Early movers capture durable value.
| Opportunity | (~) % Potential CAGR Upside | Geographic Relevance | Execution Window |
|---|---|---|---|
| Private Label & Brand-Building Hybrid Model Transitioning from Commodity Dropshipping | +4.50% | North America, Europe, Australia, GCC | Medium term (2–4 years) |
| Southeast Asia & Latin America Domestic Dropshipping Platform Expansion | +3.20% | Indonesia, Vietnam, Philippines, Brazil, Mexico, Colombia | Short term (≤ 2 years) |
| B2B & Wholesale Dropshipping for SME Retail & Reseller Channels | +2.40% | North America, Europe, India, Southeast Asia | Medium term (2–4 years) |
| Niche Digital Product & Print-on-Demand Dropshipping Scaling via AI Personalisation | +1.80% | Global — North America, Europe, Latin America | Short term (≤ 2 years) |
| Subscription Box & Curated Recurring-Revenue Dropshipping Models | +1.20% | North America, Europe, Australia | Long term (≥ 4 years) |
Geopolitical Impact Analysis
According to WTO analysis, tariff escalation on low value parcels is rerouting dropshipping supply chains away from direct China to consumer flows. New U.S. duties reaching 30% of value or USD 50 per item raise landed costs on China origin goods sharply. This forces operators toward alternative sourcing hubs. Merchants who diversify suppliers across Southeast Asia protect margins against single country tariff shocks.
Data from UNCTAD shows global e-commerce sales exceeded USD 27 Trillion, yet shipping disruptions now delay cross-border parcels by days on rerouted lanes. Red Sea rerouting and port congestion extend transit times and raise freight costs on Asia to Europe routes. This lengthens delivery windows that trigger chargebacks. Operators who shift to regional fulfillment reduce exposure to these logistics bottlenecks and protect conversion.
Key Company Insights
Shopify Inc. anchors its advantage in platform scale, serving millions of merchants including dropshipping operators. Shopify states Shop Pay lifts checkout to order conversion by up to 50% versus guest checkout. This higher completion rate directly raises merchant revenue per visitor. However, deep dependence on one platform exposes stores to sudden policy changes that can disrupt active operations without warning.
AliExpress builds its position on a vast catalog of low cost supplier products routed through cross-border channels. DHL surveyed 4,050 businesses and found 87% maintain active social media presence to promote such goods. This wide sourcing base fuels fast product testing. However, extended shipping times from origin markets raise chargeback risk and pressure operators to seek faster fulfillment alternatives.
Key Players
- Shopify Inc.
- AliExpress
- Alibaba.com
- CJ Dropshipping
- Spocket Inc.
- Printful Inc.
- Printify Inc.
- SaleHoo Group Limited
- Doba Inc.
- Modalyst Inc.
- Wholesale2B LLC
- Megagoods Inc.
- Inventory Source LLC
- Zendrop
- GreenDropShip
- Others
Recent Developments
- March 2025: Shopify acquired Vantage Discovery, an AI powered search startup, to strengthen product discovery and shopping search across its platform used by millions of merchants, including dropshipping businesses.
- February 2026: Shopify announced a US$2 Billion share repurchase program alongside record 2025 financial results, reflecting continued investment in its commerce ecosystem that supports dropshipping merchants.
Report Scope
| Report Features | Description |
|---|---|
| Market Value (2025) | USD 439.7 Billion |
| Forecast Revenue (2035) | USD 6,105.3 Billion |
| CAGR (2026-2035) | 30.2% |
| Base Year for Estimation | 2025 |
| Historic Period | 2020-2024 |
| Forecast Period | 2026-2035 |
| Report Coverage | Revenue Forecast, Market Dynamics, Market Opportunity Analysis, Technology and Innovation Landscape, Competitive Landscape, Recent Developments |
| Segments Covered | By Product Type (Fashion & Apparel, Electronics & Media, Home, Furniture & Appliances, Health, Beauty & Personal Care, Toys, Hobby & DIY, Other Products), By Business Model (B2C, B2B, C2C), By Sales Channel (Online Marketplaces, Branded E-commerce Stores, Social-Commerce Platforms, Mobile-only Apps), By Destination Type (Cross-border Dropshipping, Domestic Dropshipping) |
| Regional Analysis | North America (US and Canada), Europe (Germany, France, The UK, Spain, Italy, and Rest of Europe), Asia Pacific (China, Japan, South Korea, India, Australia, and Rest of APAC), Latin America (Brazil, Mexico, and Rest of Latin America), Middle East and Africa (GCC, South Africa, and Rest of MEA) |
| Competitive Landscape | Shopify Inc., AliExpress, Alibaba.com, CJ Dropshipping, Spocket Inc., Printful Inc., Printify Inc., SaleHoo Group Limited, Doba Inc., Modalyst Inc., Wholesale2B LLC, Megagoods Inc., Inventory Source LLC, Zendrop, GreenDropShip, Others |
| Customization Scope | Customization for segments, region / country-level will be provided. Additional customization can be done based on requirements. |
| Purchase Options | We have three licenses to opt for: Single User License | Multi-User License (Up to 5 Users) | Corporate Use License (Unlimited User and Printable PDF) |





































