


Report Overview
The Global Creator Economy Market size is expected to be worth around USD 1,072.8 Billion By 2034, from USD 149.4 billion in 2024, growing at a CAGR of 21.8% during the forecast period from 2025 to 2034. In 2024, North America held a dominant market position, capturing more than a 37.4% share. Within this region, the U.S. Creator Economy market stood out, recording a significant valuation of USD 50.9 billion.
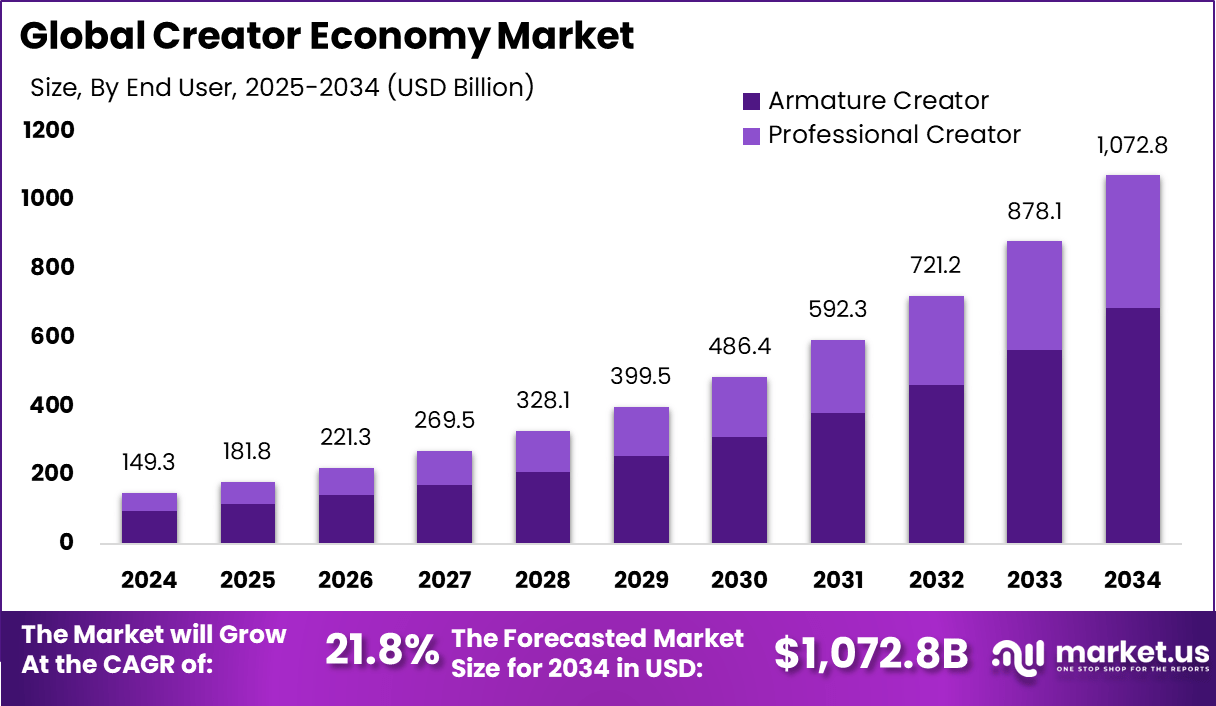
The Creator Economy refers to an ecosystem in which individuals – such as social media influencers, podcasters, YouTubers, artists, writers, and independent professionals – produce and distribute digital content directly to audiences via social platforms, monetizing through advertising, sponsorships, crowdfunding, subscriptions, and product sales. It is characterized by software-driven platforms enabling content creation, distribution, monetization tools, data analytics, and e-commerce integration.
The Creator Economy Market encompasses the global economic value generated by creator-driven platforms, tools, services, and monetization models. It includes content production, analytics platforms, creator tools, and supporting infrastructure. The market’s expansion is primarily driven by widespread social media adoption, rising content consumption, mobile internet proliferation, and expanding digital ad expenditures.
Demand is spurred by consumer preferences for authentic, relatable, and niche content. With over 400 million creators estimated globally by 2024 and significant growth in creator employment – U.S. full-time “digital creator” jobs rising from 200,000 in 2020 to 1.5 million in 2024 – the ecosystem evidences sustained expansion
According to Exploding Topics, the global creator economy is currently valued at $191.55 billion, reflecting its significant impact on industries worldwide. Within this ecosystem, merchandise companies alone generate over $500 million in annual revenue. Shopify stands out as a leader in supporting creators, with an impressive $5.2 billion in revenue, solidifying its position as a top player in the space.
A substantial proportion of creators – 68.8%, or roughly 7 in 10 – depend primarily on brand deals as their main source of income. In comparison, only 7.3% of creators cite ad revenue as their top earner. However, the landscape is evolving, with notable growth in income streams such as affiliate marketing (up 9%), advertising (up 15%), and merchandise sales (up 4%).
Technology adoption has been central to market growth. Generative AI tools are now used by approximately 59% of creators to streamline content ideation and production. Augmented reality (AR), virtual reality (VR), and immersive formats are gaining traction. Analytics, performance dashboards, and real‑time insights tools are enabling creators to optimize content and monetization outcomes.
Based on data from Internet News Times, only 4% to 10% of creators earn more than USD 100K annually, indicating that high-income creators remain a small segment even as the ecosystem grows. Platform performance continues to shape creator earnings, with YouTube, Instagram, and TikTok offering the strongest returns for brand campaigns.
The ecosystem is further transformed by rapid AI adoption, as more than 91% of creators now use generative AI to increase output. Participation in the passion economy has reached nearly 500 million people, driven by flexible work models and growing digital monetization opportunities. Demographic patterns show that 52% of creators are men and 46.7% work full-time, although only 13% belong to Gen Z.
Key Takeaways
- Social Media Platforms lead with a 27.8% share, showing they are the most preferred base for creators to build and engage audiences.
- Video Streaming Platforms hold the second-highest platform share at 24.5%, driven by growing demand for long-form and high-quality content.
- Video content dominates in format type with a 23.8% share, reflecting strong consumer preference for visual storytelling.
- Music content follows at 18.3%, boosted by short-form audio, independent artists, and streaming growth.
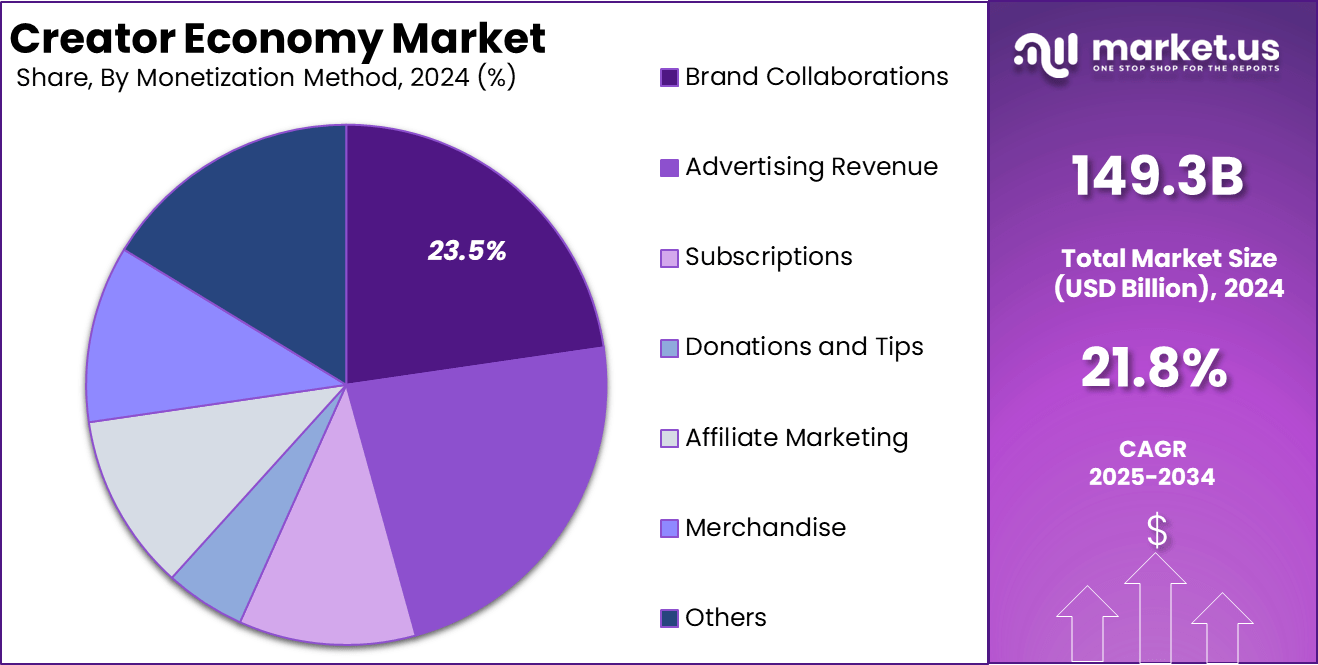
- Brand Collaborations are the top monetization method with 23.5%, as brands increasingly partner with creators for authentic reach.
- Advertising Revenue stands at 20.9%, still vital but slightly behind direct brand deals.
- Armature Creators form the majority at 64.1%, reflecting low entry barriers and rising side-hustle culture.
- Professional Creators account for 35.9%, indicating a structured and full-time content creation segment.
- The U.S. Creator Economy is valued at USD 50.9 billion with a strong CAGR of 19.3%, highlighting significant market momentum.
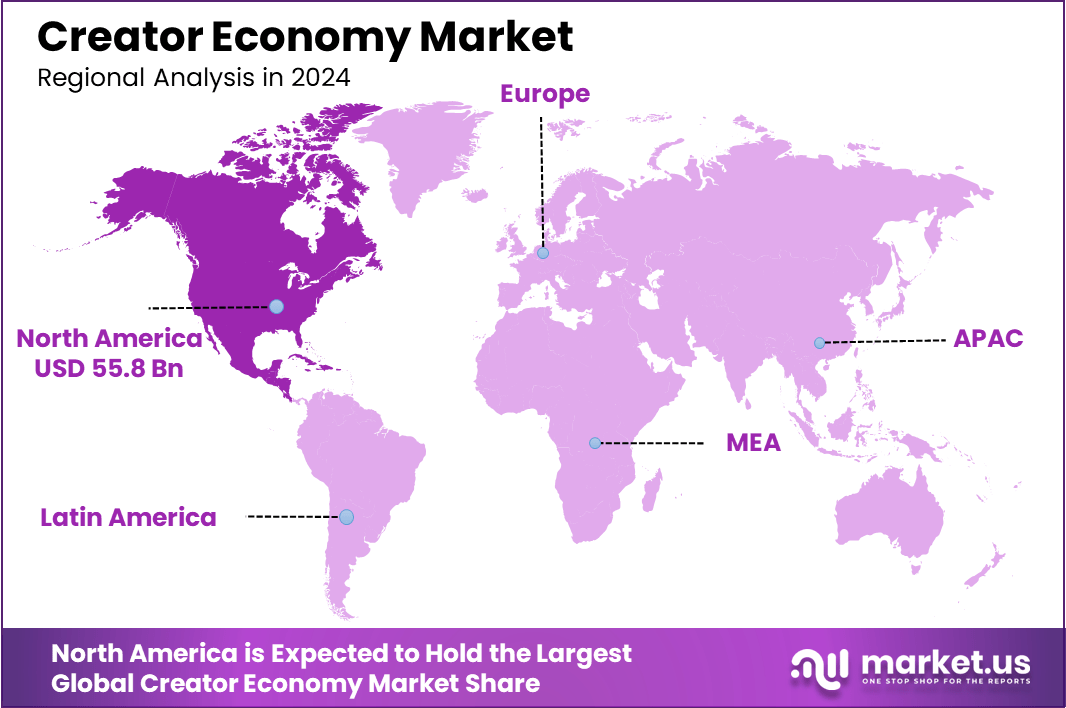
- North America holds a dominant 37.4% share, led by established platforms, monetization tools, and mature digital infrastructure.
Creator Economy Statistics
- Based on data from The Leap, there are over 200 million creators worldwide, highlighting the scale of the global creator economy.
- The ecosystem is fueled by 4.2 billion social media users, providing creators with massive reach.
- Around 500 million people are engaged in the passion economy, turning hobbies and skills into income streams.
- By demographics, 52% of creators are men, while Gen Z makes up only 13% of total creators, showing stronger participation from Millennials and older groups.
- Audience size remains modest for most, with 67% of creators having 1,000-10,000 followers, emphasizing a large base of micro-influencers.
- Nearly one in four people today identifies as a content creator, reflecting mainstream adoption.
- In monetization, 68.8% of creators depend on brand deals as their primary revenue stream.
- By exploding topics, Merchandise is a lucrative area, with merch companies generating over $500 million annually.
- Shopify leads the creator support ecosystem with $5.2 billion in revenue, showcasing its dominance in powering creator-led businesses.
Role of Generative AI
Generative AI has emerged as the backbone of creativity and efficiency in the creator economy, with an impressive 91% of creators in the U.S. and UK now using AI tools to support content production, idea generation, and workflow automation.
Across all segments, generative AI is driving massive transformation by enabling creators to produce videos, scripts, and art on-demand, with some creators collaborating directly with AI assistants and chatbots as creative partners rather than seeing them as competition.
The technology also helps brands scale influencer campaigns and vet audience authenticity, with 63% of brands planning to include AI in their marketing efforts in 2025. The combination of human creativity and generative automation is setting the pace for speed, scale, and innovation in content creation for creators worldwide.
Regional Analysis
In 2024, North America held a dominant market position, capturing more than a 37.4% share, holding USD 55.8 billion in revenue in the global creator economy market. This leadership was driven by a mature digital infrastructure, widespread smartphone usage, and a highly engaged social media population.
The presence of top-tier platforms such as YouTube, Instagram, TikTok (US operations), Twitch, and Patreon created a favorable environment for creators to monetize through brand sponsorships, direct fan contributions, and advertising revenues. Furthermore, the United States remains home to a large portion of the world’s most-followed content creators and influencer marketing agencies, which has made the region an innovation hub for monetization strategies.
Creator Economy Market Share by Region (%), 2019-2024
| Country | 2019 | 2020 | 2021 | 2022 | 2023 | 2024 |
|---|---|---|---|---|---|---|
| The US | 92.2% | 92.0% | 91.8% | 91.6% | 91.4% | 91.2% |
| Canada | 7.8% | 8.0% | 8.2% | 8.4% | 8.6% | 8.8% |
The leadership of North America can also be attributed to robust investor interest and the integration of emerging technologies like AI-driven content optimization and NFTs for digital ownership. Increasing partnerships between creators and brands, the adoption of micro-influencer strategies, and the rise in creator-led ventures such as e-commerce or personal media brands further accelerated revenue generation.
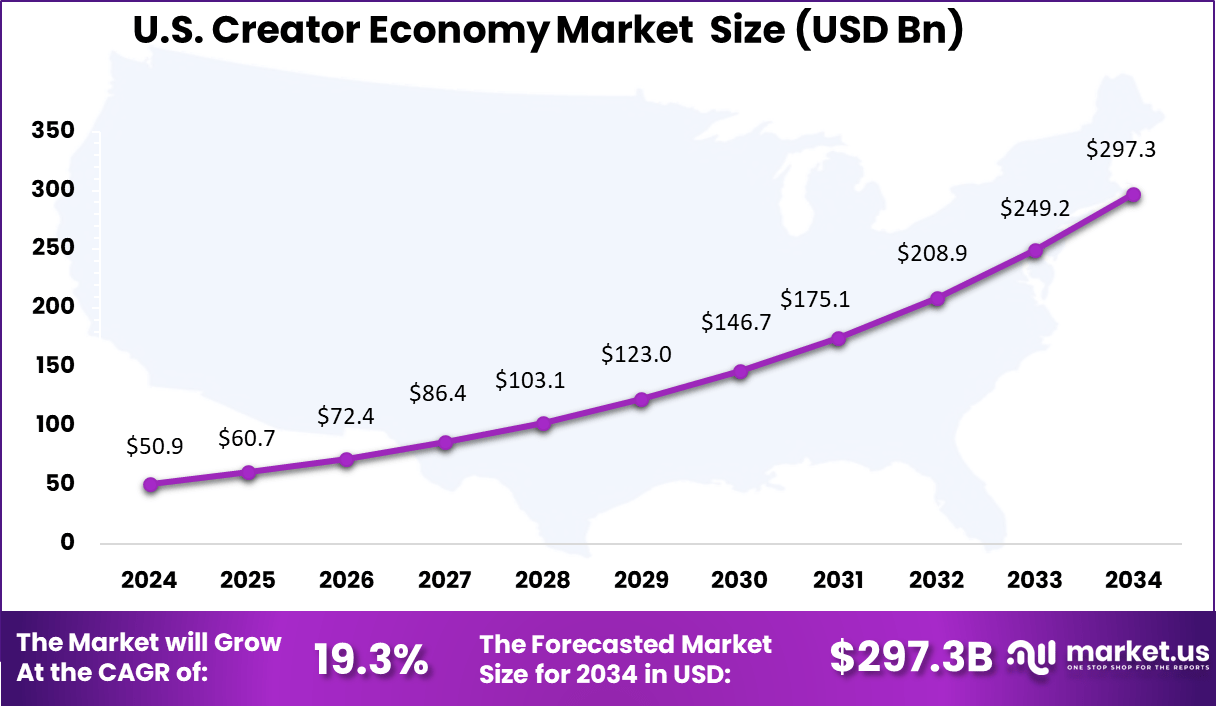
US Creator Economy Market Size
The US Creator Economy Market is valued at approximately USD 50.9 Billion in 2024 and is predicted to increase from USD 123 Billion in 2029 to approximately USD 297.3 Billion by 2034, projected at a CAGR of 19.3% from 2025 to 2034.
Key Regions and Countries
North America
- US
- Canada
Europe
- Germany
- France
- The UK
- Spain
- Italy
- Rest of Europe
Asia Pacific
- China
- Japan
- South Korea
- India
- Australia
- Singapore
- Rest of Asia Pacific
Latin America
- Brazil
- Mexico
- Rest of Latin America
Middle East & Africa
- South Africa
- Saudi Arabia
- UAE
- Rest of MEA
Platform Analysis
In 2024, the Social Media Platforms segment held a dominant market position, capturing more than a 27.8% share of the global Creator Economy, a trend supported by North American data showing social media commanding roughly 29% of platform-based value in that region. This leadership can be attributed to several reinforcing factors.
High engagement levels resulting from optimized recommendation systems have facilitated content virality and fast community growth. Creators benefit from integrated monetization tools – such as advertisements, brand partnerships, affiliate marketing, tipping, and e‑commerce – further supported by platform enhancements that simplify checkout and fund transfer.
Creator Economy Market Share by Platform Analysis (%), 2019-2024
| Platform | 2019 | 2020 | 2021 | 2022 | 2023 | 2024 |
|---|---|---|---|---|---|---|
| Social Media Platforms | 31.7% | 31.2% | 30.6% | 30.1% | 29.2% | 29.0% |
| Content-Sharing Platforms | 15.3% | 15.2% | 15.2% | 15.1% | 15.1% | 15.0% |
| Video Streaming Platforms | 22.2% | 22.6% | 22.9% | 23.2% | 23.8% | 23.9% |
| Audio Platforms | 12.0% | 12.1% | 12.2% | 12.4% | 12.5% | 12.6% |
| Gaming Platforms | 10.9% | 11.2% | 11.5% | 11.9% | 12.3% | 12.5% |
| Others (E-commerce Platforms, etc.) | 7.9% | 7.7% | 7.5% | 7.3% | 7.1% | 7.0% |
As mobile penetration continues to rise, visual and interactive content formats (stories, reels, live streams) have driven deeper, more spontaneous audience interaction. Consequently, large-scale visibility and diversified revenue sources ensure steady growth and premium return potential, reinforcing social media’s structural dominance in the Creator Economy.
Content Type Analysis
In 2024, Video held a dominant market position in the Content Type Segment of the Creator Economy Market and captured more than a 23.8% share. This leadership was strongly driven by the rising demand for short-form and long-form visual content across platforms such as YouTube, TikTok, and Instagram Reels.
Video content has become the most effective way to engage audiences due to its visual appeal, storytelling capability, and high shareability. The format also supports monetization models like ads, brand sponsorships, and fan-based contributions more efficiently than other content types. The dominance of video can also be linked to increased smartphone penetration, better mobile internet speeds, and the availability of easy-to-use editing tools.
Creator Economy Market Share by Content Type Analysis (%), 2019-2024
| Content Type | 2019 | 2020 | 2021 | 2022 | 2023 | 2024 |
|---|---|---|---|---|---|---|
| Video | 21.9% | 22.5% | 23.0% | 23.5% | 24.3% | 24.4% |
| Written | 9.9% | 9.7% | 9.4% | 9.2% | 8.9% | 8.7% |
| Gaming | 17.2% | 17.2% | 17.2% | 17.2% | 17.1% | 17.2% |
| Music | 19.6% | 19.4% | 19.3% | 19.2% | 18.9% | 19.0% |
| Photography, Art, and Memes | 11.2% | 11.0% | 10.9% | 10.7% | 10.6% | 10.4% |
| Audio | 13.3% | 13.4% | 13.6% | 13.7% | 13.9% | 14.0% |
| Others (Educational, etc.) | 6.9% | 6.8% | 6.6% | 6.5% | 6.3% | 6.2% |
These factors have empowered individual creators and influencers to produce high-quality content consistently. As viewers continue to prefer visual-first formats, video remains the cornerstone of the creator economy, shaping both consumer attention and creator revenues globally.
Monetization Method Analysis
In 2024, the Brand Collaborations segment held a dominant market position in the Monetization Method Segment of the Creator Economy Market, capturing more than a 23.5 % share. This leadership can be attributed to a strategic shift by brands toward influencers and creators, underscored by:
Brand collaborations deliver authentic audience engagement and measurable impact, making them a preferred marketing strategy. Creators and brands benefit from flexible formats – from macro-influencer sponsorships to nano-influencer campaigns – across platforms such as TikTok, Instagram, and YouTube. Such partnerships are reinforced by advances in creator‑brand marketplaces that streamline campaign planning and execution.
Creator Economy Market Share by Monetization Method Analysis (%), 2019-2024
| Monetization Method | 2019 | 2020 | 2021 | 2022 | 2023 | 2024 |
|---|---|---|---|---|---|---|
| Advertising Revenue | 24.8% | 24.3% | 23.8% | 23.3% | 22.4% | 22.1% |
| Subscriptions | 17.1% | 17.7% | 18.3% | 18.9% | 19.8% | 20.0% |
| Donations and Tips | 7.5% | 7.2% | 7.0% | 6.7% | 6.5% | 6.3% |
| Affiliate Marketing | 12.2% | 12.3% | 12.3% | 12.4% | 12.4% | 12.5% |
| Brand Collaborations | 21.0% | 21.3% | 21.7% | 22.1% | 22.6% | 22.7% |
| Merchandise | 11.6% | 11.6% | 11.5% | 11.5% | 11.3% | 11.4% |
| Others | 5.8% | 5.6% | 5.4% | 5.2% | 5.0% | 4.9% |
The growth in Brand Collaborations has been supported by consumer preference for trustworthy recommendations: about 92% of consumers trust influencer endorsements more than traditional ads, driving brands to allocate a growing share of marketing budgets to creators. Platforms and tools facilitating these collaborations – such as Pearpop and creator marketplaces – enable efficient, performance‑based campaigns that align creator incentives with brand outcomes.
End User Analysis
In 2024, the Amateur Creator segment held a dominant market position in the End-User Segment of the Creator Economy Market, capturing more than a 64.1% share. This dominance was largely driven by the explosive rise in individuals creating content for passion, personal branding, or supplemental income rather than as a full-time profession.
The ease of access to smartphones, intuitive video editing apps, and plug-and-play monetization tools on platforms like TikTok, YouTube, and Instagram has made it simple for everyday users to become creators without professional setups or training. The amateur segment’s growth also reflects changing cultural attitudes toward self-expression and digital side incomes.
Creator Economy Market Share by End User Analysis (%), 2019-2024
| End User | 2019 | 2020 | 2021 | 2022 | 2023 | 2024 |
|---|---|---|---|---|---|---|
| Professional Creator | 65.4% | 65.0% | 64.5% | 64.1% | 63.5% | 63.3% |
| Armature Creator | 34.6% | 35.0% | 35.5% | 35.9% | 36.5% | 36.7% |
Millions of users are now casually creating content around lifestyle, hobbies, humor, education, or gaming, often with a strong local or niche community appeal. While not all of them earn large sums, the sheer volume of these creators has made them an essential pillar of the creator economy. Their contribution not only fuels content diversity but also drives platform engagement, making them highly valuable from both a user-retention and platform monetization standpoint.
Key Market Segments
By Platform
- Social Media Platforms
- Content-Sharing Platforms
- Video Streaming Platforms
- Audio Platforms
- Gaming Platforms
- Others (E-commerce Platforms, etc.)
By Content Type
- Video
- Written
- Gaming
- Music
- Photography, Art, and Memes
- Audio
- Others (Educational, etc.)
By Monetization Method
- Advertising Revenue
- Subscriptions
- Donations and Tips
- Affiliate Marketing
- Brand Collaborations
- Merchandise
- Others
By End User
- Professional Creator
- Armature Creator
Market Dynamics
Drivers
| Driver | (~) % CAGR | Geographic Relevance | Impact Timeline |
|---|---|---|---|
| Scale of multi-platform creator monetization | +4.0% | North America, Europe, Asia-Pacific | Short term (2 years or less) |
| Short-form vertical video consumption boom | +3.0% | Global urban & peri-urban | Short term (2 years or less) |
| Direct-to-fan subscription & tipping models | +2.8% | Global, skew to OECD markets | Medium term (2 to 4 years) |
| Brand & performance marketing shift to creators | +2.3% | Global advertising markets | Medium term (2 to 4 years) |
| Creator tooling, AI-assisted production & analytics | +1.7% | Global, platform-centric hubs | Medium term (2 to 4 years) |
Scale of multi-platform creator monetization
Multi-platform monetization is the strongest market driver, supporting the baseline creator economy CAGR of 21.8% and contributing an additional +4.0% through higher revenue per active creator. Leading creator platforms generate annual creator earnings in the low-to-mid single-digit billions. One major creator platform recorded gross site volume above 7 billion in 2024, revenue exceeding 1.4 billion, and pre-tax margins close to 50%, while distributing most transaction value to millions of creators worldwide.
TikTok creators generated an estimated 4.1 billion in 2024, with earnings projected to reach approximately 5.7 billion in 2025. Subscription platforms also provide average monthly creator earnings in the low hundreds of dollars, supported by tips, memberships, sponsorships, advertising, and commerce. Monetization requirements, including 100,000 followers and minimum engagement within 28-day periods, are encouraging professional operations, multi-platform audience development, and higher lifetime value per creator account.
Restraints
| Restraint | (~) % CAGR | Geographic Relevance | Impact Timeline |
|---|---|---|---|
| Platform policy volatility & revenue-share uncertainty | -3.2% | Global, concentrated on major social platforms | Short term (2 years or less) |
| Regulatory scrutiny of content & payments | -2.6% | North America, EU, selected Asia-Pacific | Medium term (2 to 4 years) |
| High dependency on few dominant platforms | -2.4% | Global creator base | Medium term (2 to 4 years) |
| Monetization eligibility thresholds excluding small creators | -1.9% | Global, especially emerging markets | Short term (2 years or less) |
| Payment infrastructure gaps & payout friction | -1.5% | Africa, South & Southeast Asia, LATAM | Medium term (2 to 4 years) |
Platform policy volatility & revenue-share uncertainty
Policy volatility and revenue-sharing uncertainty on major creator platforms represent the largest market restraint, reducing the baseline CAGR by an estimated -3.2%. TikTok creator programs have reported payouts of approximately 0.50 to 2.0 per 1,000 views, while experimental programs increased payouts by nearly 48%. However, repeated changes during the last 2 years have created monthly income volatility and forced creators to shift between short-form content, live streaming, and commerce formats.
Average creator earnings remain around 350 per month on some membership platforms and below 200 per month on others. Transaction fees in the low-to-mid single-digit percentage range, along with payment processing charges, further reduce margins. Changes in advertising policies, brand-safety requirements, and moderation standards can also lower creator revenue shares by several percentage points, delaying investment in production, staffing, and new content formats.
Challenges
| Challenge | (~) % CAGR | Geographic Relevance | Mitigation Horizon |
|---|---|---|---|
| Creator income inequality & churn | -2.9% | Global creator base | Long term (4 years or more) |
| Algorithm dependence & discovery volatility | -2.5% | Global, especially large video platforms | Medium term (2 to 4 years) |
| Content burnout & mental health risks | -2.2% | Global, skew to full-time creators | Long term (4 years or more) |
| Brand safety & measurement complexity | -2.0% | Global advertising & agency ecosystem | Medium term (2 to 4 years) |
| Limited financial literacy & business formalization | -1.6% | Global, especially emerging markets | Long term (4 years or more) |
Creator income inequality & churn
Structural income inequality and high creator churn represent the largest market restraint, reducing potential CAGR by approximately -2.9%. On some video platforms, the top 1% to 5% of creators receive more than 50% of total creator fund payments and sponsorship income. Meanwhile, the median creator may earn less than 500 per month, even after reaching 100,000 followers or publishing more than 3 videos within 28 days.
Annual churn among small creators can exceed 20% to 30% due to unstable revenue per thousand impressions, rising production expenses, and limited business support. This income imbalance encourages brands to focus spending on a small group of established creators, reducing opportunities for mid-tier and niche profiles. Platforms offering financial planning tools, multi-platform analytics, and creator cooperatives may require a 4-plus-year investment period to reduce earnings volatility, lower churn, and support sustainable market growth.
Opportunities
| Opportunity | (~) % CAGR | Geographic Relevance | Execution Window |
|---|---|---|---|
| Integrated creator-led commerce & SaaS tooling | +3.5% | Global, with strong emergence in Asia-Pacific & North America | Medium term (2 to 4 years) |
| Enterprise B2B creator partnerships & co-creation | +2.7% | Global corporate marketing & product teams | Medium term (2 to 4 years) |
| Localized creator ecosystems in emerging markets | +2.4% | India, Southeast Asia, Africa, LATAM | Long term (4 years or more) |
| Creator IP licensing, merchandising & franchising | +2.2% | Global, skew to high-fan-density regions | Long term (4 years or more) |
| Verticalized platforms for niche professional creators | +1.8% | Global, sector-specific (education, health, gaming, finance) | Medium term (2 to 4 years) |
Integrated creator-led commerce & SaaS tooling
Integrated creator-led commerce and SaaS tools represent a major growth opportunity, with the potential to add approximately +3.5% to market CAGR. Affiliate and live-shopping commissions generally range from 5% to 10% of product value, while integrated storefronts and merchandise placements can increase creator earnings by nearly 18%. This model enables creators to operate as micro-enterprises with owned storefronts, customer data, subscriptions, and blended gross margins in the mid-to-high teens.
Platforms offering subscriber data access, CRM tools, membership management, and automated tax and compliance services can reduce creators’ administrative costs by low double-digit percentages. These solutions may also improve net margins on digital products and services by 5 to 10 percentage points. Growth patterns recorded between 2024 and 2026 indicate further potential for creator-led commerce in emerging markets, particularly across beauty, fashion, local services, and digital education.
Key Player Analysis
Alphabet, Meta, ByteDance, and Amazon operate as leading creator economy platforms across video, live streaming, advertising, and commerce. YouTube generated more than USD 60 billion in 2025 from advertising and subscriptions. Compared with a global market value of USD 250 billion to USD 300 billion, the platform may account for more than 15% to 20% of total value capture.
Meta generated USD 200.97 billion in annual revenue, while Reels exceeded a revenue run rate of USD 50 billion. ByteDance recorded nearly USD 186 billion, compared with USD 155 billion in the previous year. Advertising contributed around USD 140 billion, while international revenue rose by 63% to USD 39 billion and represented more than 30% of group revenue. These major companies may collectively control around 45% to 55% of creator economy monetization.
Smaller specialized platforms maintain strong positions in music, premium video, and camera-first social media. Spotify reported quarterly revenue of EUR 4.3 billion and distributed more than USD 11 billion to music rights holders and artists. More than 13,800 artists generated at least USD 100,000 each from the platform. Netflix also generates tens of billions of dollars annually and invests double-digit billions in professional content.
Snap generated USD 1.34 billion in quarterly revenue, reflecting year-over-year growth of 8.7%, while daily active users reached 469 million. A later quarterly disclosure reported 946 million monthly active users and revenue of USD 1.72 billion. Snap Stars expanded by 145% in North America, while Spotify, Netflix, and Snap may collectively represent around 10% to 15% of global creator economy value capture.
Top Key Players in the Market
- Alphabet Inc.
- Company Overview
- Product Portfolio
- Financial Performance
- Recent Developments/Updates
- Strategic Overview
- SWOT Analysis
- Note (*): Similar analysis will be provided for other companies as well.
- Amazon.com, Inc.
- ByteDance
- Meta Platforms
- Spotify AB
- Netflix Inc.
- Snap Inc.
- Pinterest, Inc.
- X Corp.
- Canva
- Roblox Corporation
- Etsy, Inc.
- Patreon, Inc.
- Discord Inc.
- Substack Inc.
Recent Developments
- In March 2026, Meta Platforms launched the Creator Fast Track program on Facebook, combining guaranteed pay, accelerated reach, and immediate access to Facebook Content Monetization for eligible creators; the company disclosed that Facebook paid content creators nearly 3 billion dollars through monetization programs in 2025, representing a 35% year‑on‑year increase and its highest annual payout to date, underscoring Meta’s escalating financial commitment to the creator ecosystem.
- In January 2026, YouTube (Alphabet Inc.) outlined its 2026 roadmap, committing to expanded monetization surfaces including AI‑enabled Shorts creation, in‑app shopping with full checkout, and scaled brand‑deal infrastructure; the platform reported that more than 500,000 creators already use YouTube Shopping.
- In January 2025, ByteDance, owner of TikTok, announced plans to invest over 12 billion dollars in artificial intelligence infrastructure in 2025, including approximately 5.5 billion dollars (RMB 40 billion) earmarked for AI chip procurement in China and around 6.8 billion dollars allocated internationally to expand model‑training capacity, materially scaling the compute backbone that underpins TikTok’s recommendation algorithms and creator discovery.
Report Scope
| Report Features | Description |
|---|---|
| Market Value (2024) | USD 149.3 Bn |
| Forecast Revenue (2034) | USD 1,072.8 Bn |
| CAGR (2025-2034) | 21.8% |
| Base Year for Estimation | 2024 |
| Historic Period | 2020-2023 |
| Forecast Period | 2025-2034 |
| Report Coverage | Revenue Forecast, Market Dynamics, COVID-19 Impact, Competitive Landscape, Recent Developments |
| Segments Covered | By Platform (Social Media Platforms, Content-Sharing Platforms, Video Streaming Platforms, Audio Platforms, Gaming Platforms, Others (E-commerce Platforms, etc.)), By Content Type (Video, Written, Gaming, Music, Photography, Art, and Memes, Audio, Others (Educational, etc.), By Monetization Method (Advertising Revenue, Subscriptions, Donations and Tips, Affiliate Marketing, Brand Collaborations, Merchandise, Others), By End User (Professional Creator, Armature Creator) |
| Regional Analysis | North America – US, Canada; Europe – Germany, France, The UK, Spain, Italy, Russia, Netherlands, Rest of Europe; Asia Pacific – China, Japan, South Korea, India, New Zealand, Singapore, Thailand, Vietnam, Rest of APAC; Latin America – Brazil, Mexico, Rest of Latin America; Middle East & Africa – South Africa, Saudi Arabia, UAE, Rest of MEA |
| Competitive Landscape | Alphabet Inc., Amazon.com, Inc., ByteDance, Meta Platforms, Spotify AB, Netflix Inc., Snap Inc., Pinterest, Inc., X Corp., Canva, Roblox Corporation, Etsy, Inc., Patreon, Inc., Discord Inc., Substack Inc. |
| Customization Scope | Customization for segments, region/country-level will be provided. Moreover, additional customization can be done based on the requirements. |
| Purchase Options | We have three licenses to opt for: Single User License, Multi-User License (Up to 5 Users), Corporate Use License (Unlimited Users and Printable PDF) |





























