


Report Overview
In 2025, the Global Subscription E-Commerce Market was valued at USD 11.9 billion. The market is projected to grow at a CAGR of 11.0% during 2026–2035, reaching approximately USD 33.7 billion by 2035. North America dominated the global market in 2025, accounting for more than 41.8% of the total market share and generating approximately USD 4.9 billion in revenue.
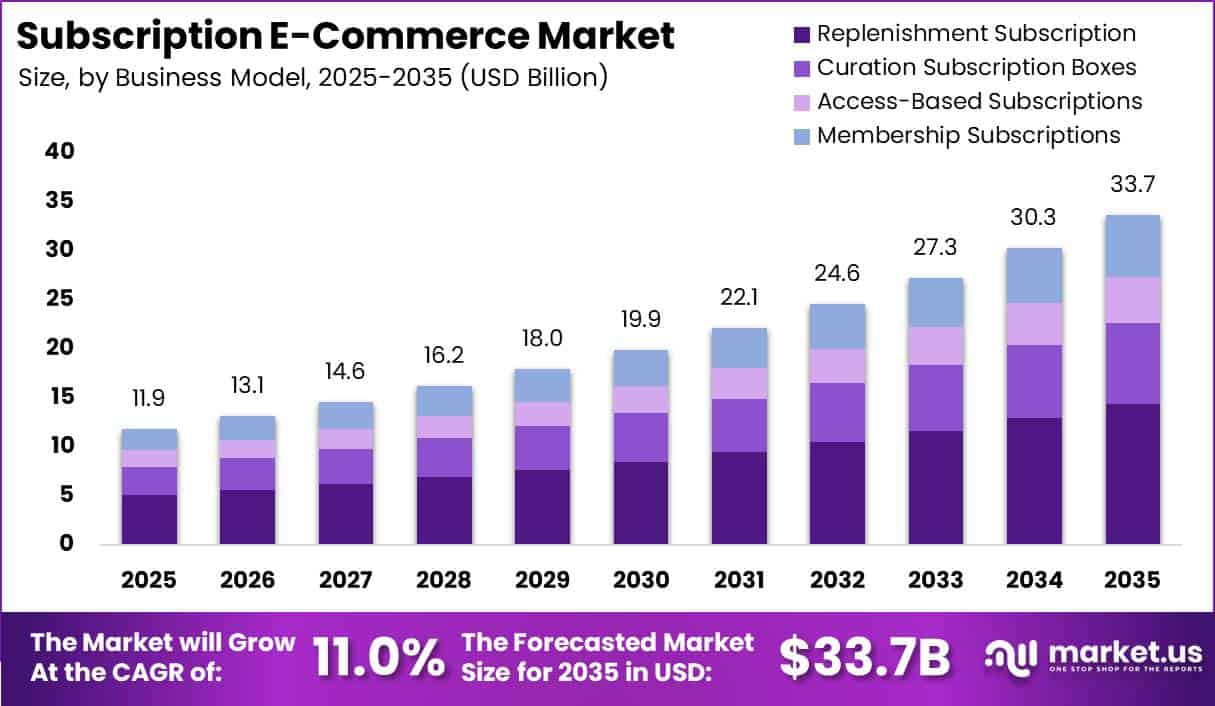
This growth is supported by the wider shift toward online shopping, digital payments, and recurring purchasing models. According to UNCTAD, business e-commerce sales across major economies reached nearly USD 28 trillion in 2024. Online retail represented around 15% of total retail sales in the United States and approximately 25–30% in highly digital markets such as China, the United Kingdom, and the Republic of Korea.
As consumers increasingly purchase daily-use products, software, entertainment, and digital services online, subscription-based ordering is becoming more common. The segment remains small compared with the overall e-commerce industry, but its limited base of USD 11.9 billion creates strong room for expansion. A gradual rise in subscriptions from about 1% to 2% of total online spending over ten years could mathematically support an 11.0% compound annual growth rate.
North American region benefits from advanced online retail, digital media adoption, and recurring payment systems. Online retail penetration in the United States is around 15%, creating a large spending base for subscribe-and-save services, curated boxes, and auto-renew plans. In addition, the North American video-on-demand market is projected to reach nearly USD 109.5 billion by 2027, further supporting recurring subscription spending across streaming, gaming, software, and physical products.
Key Takeaway
- The Subscription E-Commerce Market was valued at USD 11.9 billion in 2025 and is projected to reach USD 33.7 billion by 2035, growing at a CAGR of 11.0%.
- Replenishment subscriptions dominated the business model with a 42.6% share, while curation subscription boxes were the fastest-growing segment.
- Beauty and personal care led the product category with a 31.4% share, while fashion and apparel boxes were the fastest-growing category.
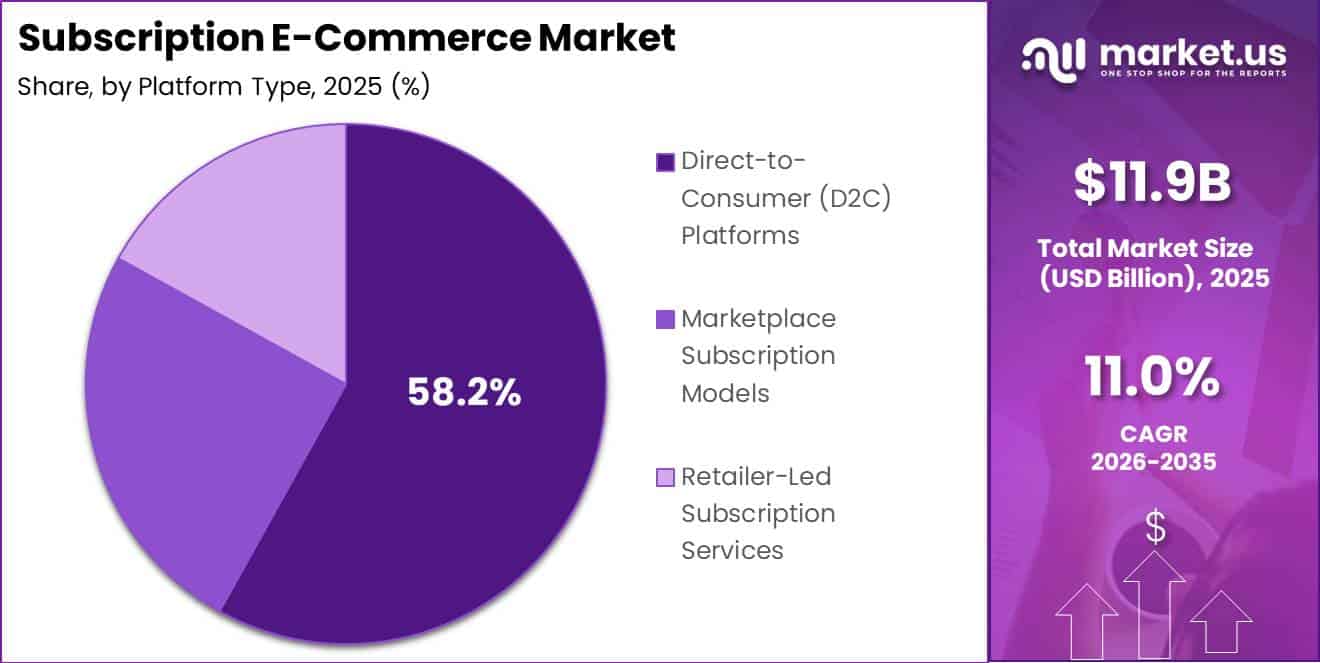
- Direct-to-consumer platforms held a 58.2% share by platform type, while marketplace subscription models were the fastest-growing.
- Subscription management software led the technology segment with a 36.8% share.
- Monthly subscription plans dominated payment models with a 61.5% share.
- Individual consumers accounted for 74.3% of the market by customer type.
- Centralized warehousing led fulfillment models with a 45.9% share.
- Urban consumers held a 52.7% share by end-user segment.
- North America led the market in 2025 with a 41.8% share, worth USD 4.9 billion.
By Business Model
Replenishment subscription services held a dominant position in the subscription e-commerce market, accounting for a 42.6% share. Their leadership is supported by regular demand for frequently purchased products, including food, household supplies, personal care items, pet food, baby products, cleaning products, and grooming essentials.
According to the USDA Economic Research Service, total food spending in the United States reached approximately USD 2.57 trillion in 2023, equal to USD 7,672 per person. Nearly 58.5% of this amount was spent on food away from home, while the remaining share was directed toward food consumed at home. Many household products require weekly or monthly replacement, making automatic delivery plans a practical option.
By Product Category
Beauty and personal care held a leading position in the subscription e-commerce market, accounting for a 31.4% share. The segment benefits from the large size of the consumer market and the frequent replacement of skincare, haircare, grooming, and personal hygiene products.
According to the U.S. Census Bureau, health and personal care store sales reached USD 38.0 billion in a single month during late 2024, representing a 3.4% year-over-year increase. Most products in this category are used within four to eight weeks, creating suitable conditions for automatic replenishment plans. Subscription services allow customers to receive products before they run out.
By Platform Type
Direct-to-consumer platforms held a leading position in the subscription e-commerce market, accounting for a 58.2% share. Their dominance is supported by strong recurring spending across digital media, software, gaming, and consumer goods. In the United States, subscription-based services reach an estimated 150 million consumers, while total subscription revenue exceeds USD 350 billion.
D2C platforms allow companies to manage customer accounts, pricing, payments, and service delivery without paying marketplace commissions. This improves profit margins and gives brands greater control over customer data. Direct access to purchasing behaviour also helps companies offer personalized plans, loyalty rewards, and flexible subscription options.
By Technology
Subscription management software held a leading position in the subscription e-commerce technology segment, accounting for a 36.8% share. Its dominance comes from its role as the main operating system for subscription-based businesses. As digitally ordered trade continues to generate trillions of dollars in global transactions, companies need reliable platforms to manage recurring payments and large subscriber bases.
These systems support plan creation, invoicing, tax calculation, renewals, upgrades, downgrades, failed-payment recovery, trial periods, and regulatory record-keeping. Businesses serving thousands or millions of subscribers depend on automated software to reduce billing errors, improve payment collection, and lower customer churn.
By Payment Model
Monthly subscription plans held a leading position in the subscription e-commerce market, accounting for a 61.5% share. Their dominance is mainly supported by the way consumers and businesses manage regular spending. In North America, the broader subscription market is projected to increase from USD 162.5 billion in 2025 to USD 312.8 billion by 2032, showing strong demand across streaming services, software platforms, and curated product boxes.
Most subscription services use monthly billing because it matches common salary, household budget, and business cash-flow cycles. Customers can also start, pause, change, or cancel a monthly plan without making a long-term financial commitment. This flexibility reduces the entry barrier for new users and helps companies attract customers more quickly.
By Customer Type
Individual consumers held a dominant position in the subscription e-commerce market, accounting for a 74.3% share. Their leadership is supported by strong household demand for digital media, software, gaming, and frequently used consumer products. Digital Content Next estimated that nearly 923 million digital subscriptions were active in Q1 2025 across video, audio, news, and other content services, with most subscriptions purchased by individuals and households rather than enterprises.
North America’s subscription market is also projected to expand from USD 162.5 billion in 2025 to USD 312.8 billion by 2032. Much of this growth is expected to come from consumer spending on streaming platforms, curated product boxes, gaming services, and personal software tools. These services usually involve low-value but frequent recurring payments, making them suitable for individual users.
By Fulfillment Model
Centralized warehousing held a leading position in the subscription e-commerce fulfillment segment, accounting for a 45.9% share. Its dominance is supported by the need to manage high volumes of recurring deliveries with consistent quality and controlled shipping costs. The North American subscription box market is expected to expand at a CAGR of 16.8% between 2025 and 2034, increasing shipment volumes across beauty, food, pet care, and hobby products.
Centralized distribution centers allow companies to store inventory in one location, monitor stock levels, and maintain uniform packing standards. Operators can also purchase products in bulk, automate packaging activities, and plan delivery routes more efficiently. These benefits help lower the cost per shipment and support dependable delivery schedules for weekly or monthly subscription plans.
By End User Segment
Urban consumers held a leading position in the subscription e-commerce market, accounting for a 52.7% share. Their dominance is supported by better internet access, developed delivery networks, higher digital spending, and strong demand for convenient shopping services. According to the United Nations, nearly 56% of the global population lived in urban areas in 2023, and this proportion is expected to reach about 60% by 2030.
The continued growth of cities is expanding the number of consumers with access to broadband services, digital payments, and reliable last-mile delivery. Urban households also use more streaming, news, audio, food delivery, and personal care subscriptions. Digital Content Next estimated that approximately 923 million digital subscriptions were active worldwide in Q1 2025, with adoption generally stronger among connected and higher-income urban consumers.
Millennials and Gen Z represent the fastest-growing consumer group due to their strong use of mobile devices and digital services. Since a large share of these consumers lives in cities, their rising adoption further supports the dominant 52.7% share of urban end users.
Key Market Segments
By Business Model
- Replenishment Subscription
- Curation Subscription Boxes
- Access-Based Subscriptions
- Membership Subscriptions
By Product Category
- Beauty & Personal Care
- Fashion & Apparel
- Food & Beverage
- Health & Wellness
- Pet Products
- Household Essentials
By Platform Type
- Direct-to-Consumer (D2C) Platforms
- Marketplace Subscription Models
- Retailer-Led Subscription Services
By Technology
- Subscription Management Software
- AI-Powered Personalization Engines
- Payment & Billing Automation
- Customer Retention Analytics
By Payment Model
- Monthly Subscription
- Annual Subscription
- Pay-as-you-go Hybrid Models
By Customer Type
- Individual Consumers
- Enterprise Customers
By Fulfillment Model
- Centralized Warehousing
- Dropshipping Subscription Models
- Hybrid Fulfillment Networks
By End User Segment
- Urban Consumers
- Millennials & Gen Z
- Premium/Luxury Consumers
Geopolitical Impact Analysis
Global geopolitical tensions are increasing costs and reducing supply chain reliability across the subscription e-commerce market. According to the World Economic Forum, tariff increases between major economies reshaped more than USD 400 billion in global trade flows during 2025. More than 3,000 new trade and industrial policy measures were also introduced in a single year, representing over three times the level recorded a decade earlier.
Tariffs on selected U.S. imports have risen to nearly six times their 2017 levels, affecting consumer electronics, textiles, packaged goods, beauty products, apparel, and household essentials. These products form an important part of subscription boxes and automatic replenishment services. Higher import duties increase landed costs, forcing operators to raise subscription prices, reduce product quantities, or accept lower profit margins.
Shipping disruptions are adding further pressure. Container freight rates have increased by about 40% year over year, while vessels avoiding conflict-affected routes such as the Red Sea face an additional 10–15 days of transit time between Asia and Europe. These delays create challenges for weekly meal kits, monthly beauty boxes, and scheduled household deliveries. Operators must maintain larger safety stocks and invest more working capital in inventory.
Energy price volatility also affects fulfillment expenses. The International Energy Agency reported that crude oil prices have moved within a range of nearly USD 30 per barrel in recent years, contributing to double-digit changes in marine fuel and last-mile delivery costs. As a result, multi-sourcing, regional warehouses, supplier diversification, and flexible pricing are becoming essential for maintaining reliable subscription services.
Regional Analysis
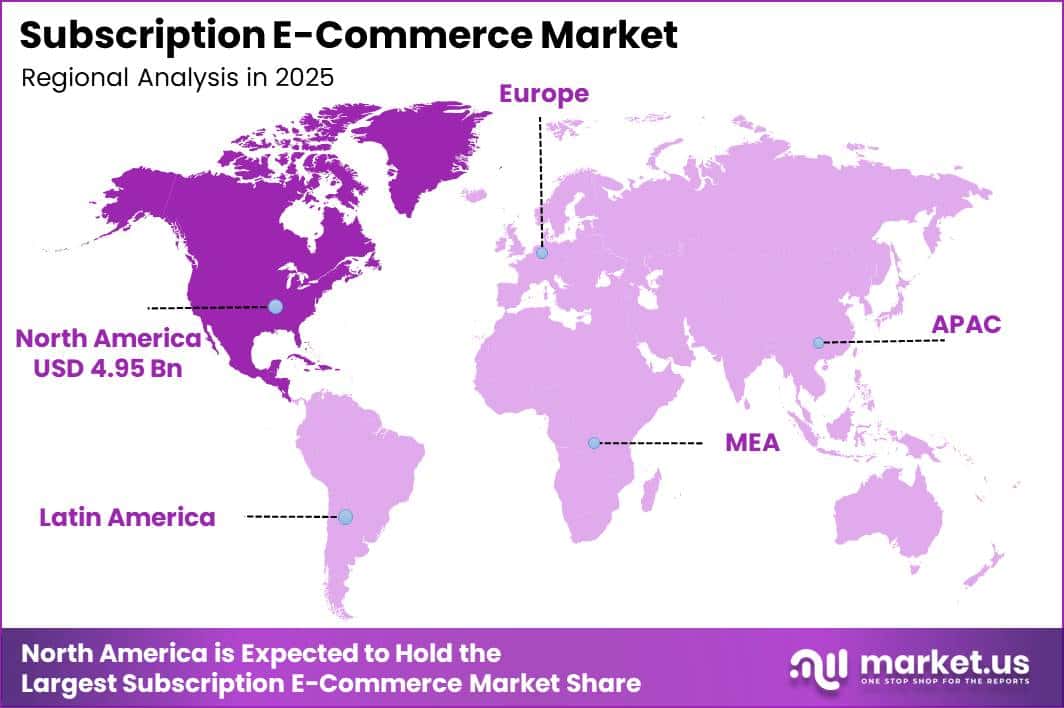
North America held a dominant position in the subscription e-commerce market, accounting for 41.8% of global revenue and reaching an estimated value of USD 4.9 billion in 2025. The region benefits from strong online retail activity, widespread use of digital payments, and high adoption of subscription services across streaming media, software-as-a-service, beauty products, food boxes, and other consumer goods.
Asia-Pacific is the fastest-growing regional market, supported by expanding e-commerce activity, rising middle-class income, growing urban populations, and increasing smartphone use. Subscription e-commerce platforms in the region were valued at around USD 12.2 billion in 2024 and are expected to expand at high single-digit to low double-digit CAGRs over the next decade.
Large mobile-first consumer groups in China, India, Southeast Asia, and South Korea are supporting this growth. App-based payment systems and super-app platforms make it easier for companies to add subscription services to shopping, entertainment, food delivery, and other digital activities. However, Asia-Pacific’s faster growth indicates that future subscription demand will increasingly shift toward highly populated and rapidly digitizing markets.
Key Regions and Countries
North America
- US
- Canada
Europe
- Germany
- France
- The UK
- Spain
- Italy
- Rest of Europe
Asia Pacific
- China
- Japan
- South Korea
- India
- Australia
- Rest of APAC
Latin America
- Brazil
- Mexico
- Rest of Latin America
Middle East & Africa
- GCC
- South Africa
- Rest of MEA
Market Dynamics
Drivers
| Driver | (~) % CAGR | Geographic Relevance | Impact Timeline |
|---|---|---|---|
| Shift to recurring consumer spend | +3.0% | North America, Europe, Asia-Pacific | Short term (≤ 2 years) |
| Payment and billing stack maturity | +2.0% | Global | Short term (≤ 2 years) |
| High smartphone and broadband penetration | +1.5% | Global (urban-heavy) | Medium term (2–4 years) |
| DTC brands pivoting to subscriptions | +1.2% | North America, Europe | Short term (≤ 2 years) |
| Data-driven personalization and upsell | +1.0% | Global | Medium term (2–4 years) |
| Expansion of subscription in emerging markets | +0.8% | Asia-Pacific, Latin America, Middle East | Long term (≥ 4 years) |
Shift to recurring consumer spend
Between 2024 and 2026, household spending shifted further toward recurring digital and physical subscriptions, often representing more than 10–15% of monthly card spending in mature markets. This change converted many one-time online purchases into predictable recurring revenue and could add around +3.0% to the baseline subscription e-commerce CAGR of 11.0%.
Stored cards and digital wallets have supported this shift. More than 50% of online transactions in North America and parts of Europe now use saved payment details, reducing checkout friction and improving conversion rates by around 5–10 percentage points compared with guest checkout.
Subscription brands in personal care, pet products, and curated boxes have recorded monthly churn below approximately 5%, while average order values are often 20–30% higher than those of non-subscription customers. These economics can support customer acquisition payback periods of less than 12 months, even when acquisition costs represent 20–25% of first-year revenue per subscriber.
More predictable demand also allows companies to make inventory commitments for 3–6 months, reducing procurement and logistics costs by around 5–8%. For leading subscription-focused brands, more than 60% of revenue may come from auto-renewing contracts, improving earnings stability and supporting stronger long-term growth planning.
Restraints
| Restraint | (~) % CAGR | Geographic Relevance | Impact Timeline |
|---|---|---|---|
| Rising regulatory scrutiny of auto-renewals | -2.5% | UK, EU, North America | Short term (≤ 2 years) |
| High customer churn and subscription fatigue | -2.0% | Global (mature markets) | Short term (≤ 2 years) |
| Elevated digital marketing and CAC costs | -1.8% | Global | Short term (≤ 2 years) |
| Payment failures and chargeback risk | -1.0% | Global | Medium term (2–4 years) |
| Logistics cost inflation for low-ticket boxes | -0.9% | North America, Europe | Short term (≤ 2 years) |
| Data privacy compliance costs | -0.7% | EU, North America | Medium term (2–4 years) |
Rising regulatory scrutiny of auto-renewals
From 2024 through enforcement phases expected by 2026, stricter consumer-protection rules, including the UK’s Digital Markets, Competition and Consumers Act 2024, are limiting automatic renewal practices and could reduce the achievable subscription e-commerce CAGR by around -2.5%.
The new requirements include clear disclosures on payment frequency, minimum contract value, renewal terms, and cancellation procedures. They may also require cooling-off periods of at least 14 days after initial sign-up and renewal, increasing early-stage cancellations among customers who previously renewed automatically.
Reminder notices issued every 6 months for annual plans and several days before free trials become paid subscriptions are also reducing revenue from silent renewals. Making online cancellation as simple as subscribing could raise cancellation rates by several percentage points.
Non-compliance may result in penalties of up to 10% of annual turnover, along with possible customer compensation. Companies may therefore spend a low single-digit percentage of revenue on legal reviews, software upgrades, and redesigned customer journeys. This additional compliance burden can reduce marketing investment and delay market expansion plans by around 6–18 months.
Challenges
| Challenge | (~) % CAGR | Geographic Relevance | Mitigation Horizon |
|---|---|---|---|
| Persistent churn management complexity | -2.2% | Global | Medium term (2–4 years) |
| Cross-border tax and duties handling | -1.7% | Europe, North America, cross-border APAC | Medium term (2–4 years) |
| Inventory and demand forecasting risk | -1.5% | Global | Long term (≥ 4 years) |
| Talent gaps in lifecycle marketing | -1.3% | North America, Europe | Medium term (2–4 years) |
| Fragmented data and analytics tooling | -1.1% | Global | Medium term (2–4 years) |
| Platform dependency and policy shifts | -0.9% | Global | Long term (≥ 4 years) |
Persistent churn management complexity
Even where regulatory-compliant practices are in place, subscription e-commerce businesses face structurally elevated annual churn—often in the 30–70% range for less differentiated offerings—which acts as a frictional drag of about -2.2% on the market’s maximum growth potential by forcing constant reinvestment in top-of-funnel acquisition.
In practical terms, a brand with a monthly churn of just over 5% must replace more than half its subscriber base every year to maintain flat subscriber counts, which pushes sustainable customer acquisition costs into the range of 3–5 months of gross margin contribution if it wants to preserve a lifetime value to CAC ratio above roughly 3:1.
Reducing churn by even 1–2 percentage points per month typically requires simultaneous investment in first-party data infrastructure, experimentation on pricing and commitment terms, and improved post-purchase experiences—collectively adding low- to mid-single-digit percentages to operating expense as a share of revenue for several years.
Opportunities
| Opportunity | (~) % CAGR | Geographic Relevance | Execution Window |
|---|---|---|---|
| Bundled multi-vertical subscription ecosystems | +2.3% | North America, Europe, Asia-Pacific | Medium term (2–4 years) |
| Subscription expansion in high-growth India | +2.0% | India | Long term (≥ 4 years) |
| Outcome-based and usage-linked subscriptions | +1.6% | Global (B2B2C niches) | Medium term (2–4 years) |
| AI-driven pricing and personalization engines | +1.4% | Global | Medium term (2–4 years) |
| Green and circular-economy subscription formats | +1.1% | Europe, North America | Long term (≥ 4 years) |
| SMB enablement platforms in emerging markets | +1.0% | Asia-Pacific, Latin America, Middle East | Long term (≥ 4 years) |
Bundled multi-vertical subscription ecosystems
The strongest upside beyond the baseline 11.0% CAGR lies in bundled subscription ecosystems, where consumers combine 3–6 product and service subscriptions across consumables, entertainment, and wellness under a single billing relationship. If adopted across major regions, this model could add nearly +2.3% to market CAGR.
Many households already manage several subscriptions separately, creating added transaction, service, and fulfillment costs. Curated bundles could reduce operating costs by around 10–20% while offering discounts of 5–10% compared with standalone prices. At the same time, larger basket sizes and lower churn could improve contribution margins by 2–4 percentage points.
This opportunity remains underdeveloped because it requires supplier coordination, shared payment systems, customer identity management, and advanced recommendation tools. As these capabilities improve, operators could raise margins from the mid-to-high 20% range for individual products to the low-to-mid 30% range at the ecosystem level. Customer lifetime value could also increase by 50–100% as bundled services improve retention and reduce annual churn.
Key Players Analysis
Tier-1 companies in the subscription e-commerce market include Amazon, Netflix, Spotify, Walmart, and Shopify. These firms lead recurring digital and physical commerce through large customer bases, strong technology platforms, and global delivery networks. Amazon reported net sales of USD 640.4 billion in 2025, while subscription services, including Prime, audiobooks, and digital content, generated USD 46.3 billion. Netflix recorded around USD 33.7 billion in 2025 revenue from streaming memberships.
Spotify reported EUR 13.4 billion, equal to about USD 14.5 billion, and served 241 million premium subscribers. Walmart generated more than USD 650 billion in total revenue and continued to expand Walmart+ and other subscription-linked services. Shopify’s Subscription Solutions segment reached USD 699 million in Q3 2025, representing 24.6% of quarterly revenue, supported by double-digit year-over-year growth in monthly recurring revenue.
Tier-2 players include HelloFresh, Blue Apron, Birchbox, Dollar Shave Club, Peloton, Ritual, Stitch Fix, Graze, and Cratejoy. These companies focus on meal kits, fitness, grooming, beauty, and curated lifestyle boxes. HelloFresh reported EUR 6.7 billion, or around USD 7.3 billion, in 2025 group revenue, with adjusted AEBITDA of EUR 423 million and a 26% meal-kit contribution margin. Peloton continued to generate more than USD 1 billion in annual subscription revenue.
Top Key Players in the Market
- Amazon
- Shopify
- Walmart
- Dollar Shave Club
- Birchbox
- HelloFresh
- Blue Apron
- Netflix
- Spotify
- Peloton
- Amazon Subscribe & Save
- Cratejoy
- Ritual
- Stitch Fix
- Graze
Recent Developments
- In November 2025, Shopify reported that Subscription Solutions revenue reached USD 699 million in Q3 2025, increasing by 15% from USD 610 million in Q3 2024. The segment represented approximately 24.6% of Shopify’s USD 2.8 billion quarterly revenue, highlighting growing demand for commerce infrastructure supporting recurring and subscription-based sales.
- In January 2025, Netflix increased subscription prices across the United States, Canada, Portugal, and Argentina. In the United States, the ad-free Standard plan increased by USD 2.5 from USD 15.4 to USD 17.9 per month, while the Premium plan increased by USD 2.0 from USD 22.9 to USD 24.9 per month.
- In 2025, Amazon generated USD 716.9 billion in total net sales, while its subscription services revenue increased to USD 49.6 billion from USD 44.3 billion in 2024. The company also recorded USD 128.3 billion in cash capital expenditure, mainly supporting technology infrastructure and additional fulfillment-network capacity.
Report Scope
| Report Features | Description |
|---|---|
| Market Value (2025) | USD 11.9 Billion |
| Forecast Revenue (2035) | USD 33.7 Billion |
| CAGR (2026-2035) | 11.0% |
| Base Year for Estimation | 2025 |
| Historic Period | 2020-2024 |
| Forecast Period | 2026-2035 |
| Report Coverage | Revenue Forecast, Market Dynamics, Competitive Landscape, Recent Developments |
| Segments Covered | By Business Model (Replenishment Subscription, Curation Subscription Boxes, Access-Based Subscriptions, Membership Subscriptions); By Product Category (Beauty & Personal Care, Fashion & Apparel, Food & Beverage, Health & Wellness, Pet Products, Household Essentials); By Platform Type (Direct-to-Consumer (D2C) Platforms, Marketplace Subscription Models, Retailer-Led Subscription Services); By Technology (Subscription Management Software, AI-Powered Personalization Engines, Payment & Billing Automation, Customer Retention Analytics); By Payment Model (Monthly Subscription, Annual Subscription, Pay-as-you-go Hybrid Models); By Customer Type (Individual Consumers, Enterprise Customers); By Fulfillment Model (Centralized Warehousing, Dropshipping Subscription Models, Hybrid Fulfillment Networks); By End User Segment (Urban Consumers, Millennials & Gen Z, Premium/Luxury Consumers) |
| Regional Analysis | North America – US, Canada; Europe – Germany, France, The UK, Spain, Italy, Rest of Europe; Asia Pacific – China, Japan, South Korea, India, Australia, Singapore, Rest of APAC; Latin America – Brazil, Mexico, Rest of Latin America; Middle East & Africa – GCC, South Africa, Rest of MEA |
| Competitive Landscape | Amazon, Shopify, Walmart, Dollar Shave Club, Birchbox, HelloFresh, Blue Apron, Netflix, Spotify, Peloton, Amazon Subscribe & Save, Cratejoy, Ritual, Stitch Fix, Graze |
| Customization Scope | Customization for segments and region/country levels will be provided. Moreover, customization can be tailored to the requirements. |
| Purchase Options | We have three licenses to opt for: Single User License, Multi-User License (Up to 5 Users), Corporate Use License (Unlimited Users and Printable PDF) |





























