
Global Commercial And Industrial Energy Storage Market Size, Share Analysis Report By Technology (Lithium-ion, Sodium-ion, Lead-acid, Flow Batteries, Others), By Application (Peak Shaving, Load Shifting, Backup Power/UPS, Renewable Integration, Ancillary Services (Frequency Regulation), Demand-charge Management, EV Fast-charging Support, Microgrid Stabilisation, Others), By End-user (Commercial Buildings, Industrial Facilities, Data Centres, Educational Institutions, Healthcare Facilities, Telecom BTS and Edge Sites, EV-fleet Operators and Charging Hubs, Others) , By Region and Companies - Industry Segment Outlook, Market Assessment, Competition Scenario, Trends and Forecast 2025-2034
- Published date: Jan 2026
- Report ID: 173868
- Number of Pages: 335
- Format:
-
keyboard_arrow_up
Quick Navigation
Report Overview
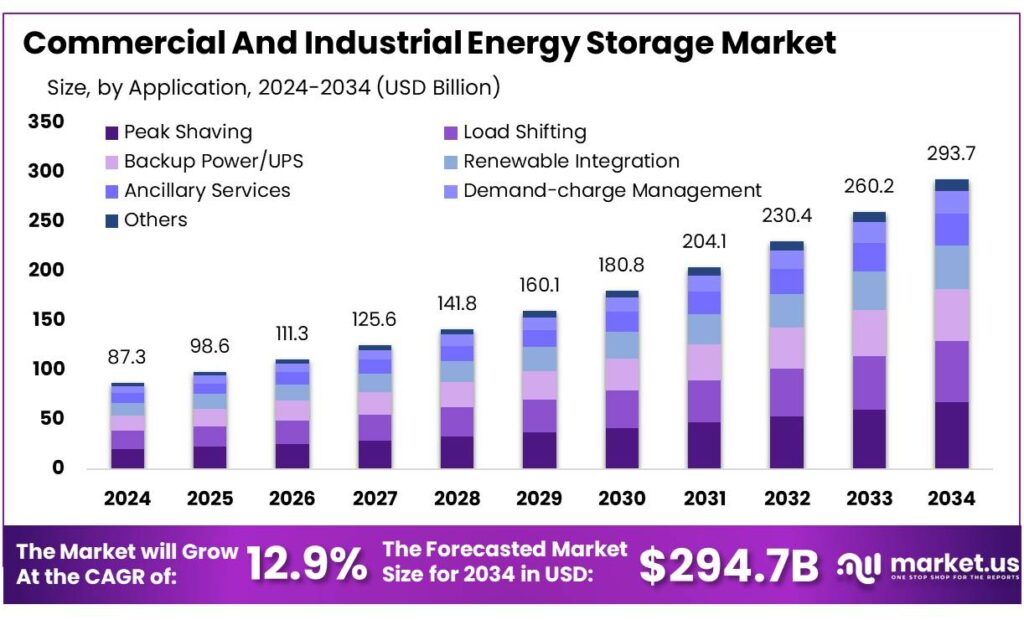
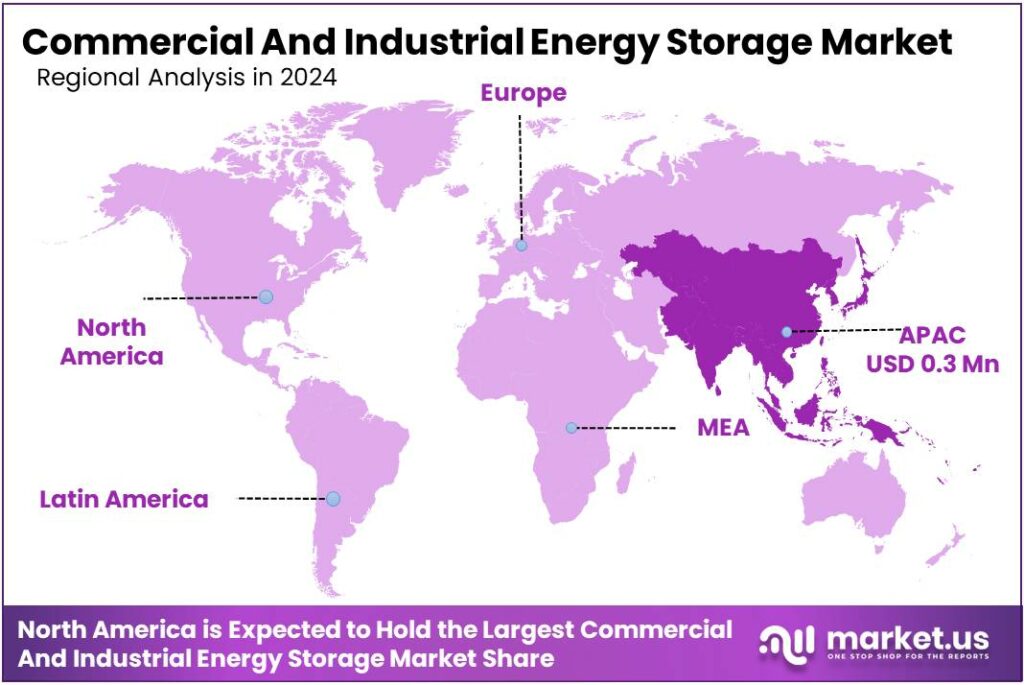
Global Commercial And Industrial Energy Storage Market size is expected to be worth around USD 293.7 Billion by 2034, from USD 87.3 Billion in 2024, growing at a CAGR of 12.9% during the forecast period from 2025 to 2034. In 2024 North America held a dominant market position, capturing more than a 38.4% share, holding USD 33.5 Million in revenue.
Commercial and industrial (C&I) energy storage sits at the intersection of power reliability, rising electricity costs, and faster renewable adoption. This shift is happening as global battery supply chains scale rapidly—global battery manufacturing capacity reached 3 TWh in 2024, supported by a sharp fall in lithium prices, which has helped ease near-term cost pressure for projects.
- Global renewable capacity additions reached 582 GW in 2024, increasing the need for flexibility to manage variable solar and wind output. In the power sector, the International Energy Agency (IEA) reported that battery storage deployment in 2023 more than doubled year-on-year, with 42 GW of battery storage capacity added globally across utility-scale and behind-the-meter applications. In the United States, utility-scale battery storage grew rapidly as well: 10.3 GW of new battery storage capacity was added in 2024, and the EIA expected 18.2 GW of utility-scale additions in 2025—a record pace.
Key driving factors are practical and measurable. Electricity systems are adding more variable renewables, and storage is the fastest “shock absorber” for short-duration balancing. Under the IEA’s Net Zero scenario, installed grid-scale battery storage capacity expands 35-fold from 2022 to nearly 970 GW by 2030, implying sustained demand for batteries, controls, and safety systems that C&I projects also rely on. At the same time, installed cost trends strengthen the business case: IRENA reports fully installed battery storage project costs declined by 93% between 2010 and 2024.
- Government initiatives are accelerating investment and lowering project risk. In India, policy support includes Viability Gap Funding (VGF) mechanics for battery energy storage: official releases note VGF levels reduced to ₹46 lakh per MWh as costs fell, with budgetary provisions cited for 1,000 MWh tranches. In Europe, the Net-Zero Industry Act aims for the EU’s net-zero technology manufacturing capacity to reach at least 40% of annual deployment need
In the U.S., the Department of Energy’s Long-Duration Storage Shot set a target to cut the cost of grid-scale long-duration storage by 90% by 2030 for systems that deliver 10+ hours—a signal that next-wave technologies may expand C&I use cases beyond short-duration peak shaving into longer backup and process continuity.
Key Takeaways
- Commercial And Industrial Energy Storage Market size is expected to be worth around USD 293.7 Billion by 2034, from USD 87.3 Billion in 2024, growing at a CAGR of 12.9%.
- Lithium-ion held a dominant market position, capturing more than a 67.2% share.
- Peak Shaving held a dominant market position, capturing more than a 23.7% share.
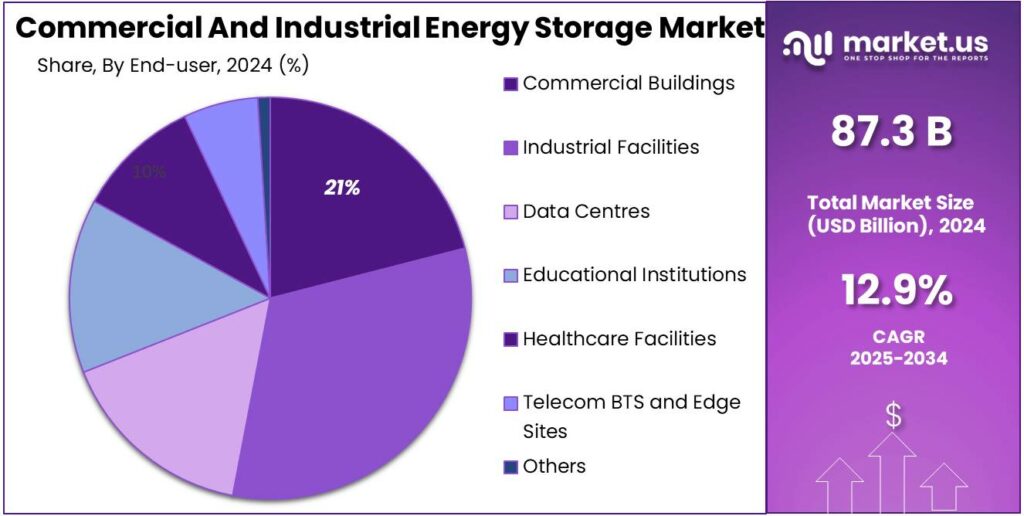
- Industrial Facilities held a dominant market position, capturing more than a 31.9% share.
- Asia Pacific region emerged as the leading market for commercial and industrial energy storage, securing a dominant 38.4% share and contributing approximately USD 33.5 million.
By Technology Analysis
Lithium-ion dominates with a 67.2% share driven by high efficiency and fast response time
In 2024, Lithium-ion held a dominant market position, capturing more than a 67.2% share. This strong lead was mainly supported by its high energy density, quick charging ability, and proven performance in both commercial and industrial energy storage systems. In 2024, lithium-ion batteries were widely adopted for peak load management, backup power, and renewable energy integration, as they offer compact design and reliable cycle life.
The technology also benefited from declining battery prices and improved safety features, making it suitable for large-scale installations. Moving into 2025, lithium-ion is expected to maintain its leading position as businesses continue to invest in energy resilience, grid stability, and efficient storage solutions to manage rising power demand and renewable energy variability.
By Application Analysis
Peak Shaving leads with a 23.7% share by helping users control high electricity costs
In 2024, Peak Shaving held a dominant market position, capturing more than a 23.7% share. This leadership was mainly driven by rising electricity tariffs and demand charges faced by commercial and industrial users. In 2024, energy storage systems were increasingly used to reduce power consumption during peak hours, helping facilities lower monthly energy bills and improve load management.
Peak shaving applications were especially common in manufacturing plants, data centers, and large commercial buildings where power demand fluctuates sharply. Looking ahead to 2025, this segment is expected to remain strong as businesses focus on cost control, grid independence, and better energy planning amid growing pressure on power infrastructure.
By End-user Analysis
Industrial Facilities dominate with a 31.9% share supported by high and continuous power demand
In 2024, Industrial Facilities held a dominant market position, capturing more than a 31.9% share. This leadership was mainly driven by the need for reliable power supply across energy-intensive operations such as manufacturing, processing, and heavy industry. In 2024, energy storage systems were increasingly deployed to manage load fluctuations, reduce downtime, and support backup power during grid disruptions. Industrial users also adopted storage to integrate on-site renewable energy and improve energy efficiency. Moving into 2025, demand from industrial facilities is expected to remain strong as companies focus on operational stability, cost control, and long-term energy resilience.
Key Market Segments
By Technology
- Lithium-ion
- Sodium-ion
- Lead-acid
- Flow Batteries
- Others
By Application
- Peak Shaving
- Load Shifting
- Backup Power/UPS
- Renewable Integration
- Ancillary Services (Frequency Regulation)
- Demand-charge Management
- EV Fast-charging Support
- Microgrid Stabilisation
- Others
By End-user
- Commercial Buildings
- Industrial Facilities
- Data Centres
- Educational Institutions
- Healthcare Facilities
- Telecom BTS and Edge Sites
- EV-fleet Operators and Charging Hubs
- Others
Emerging Trends
Microgrids with Batteries Become the New C&I Standard
One of the clearest latest trends in commercial and industrial (C&I) energy storage is the move from “single-site peak shaving” to microgrid-style systems that can keep a facility running even when the main grid is stressed. In 2024–2025, more companies started asking for storage that does three jobs at once: cut peak power costs, smooth on-site solar, and provide ride-through power during outages. This shift is being pushed by practical business needs—especially for data centers, cold-chain warehouses, airports, hospitals, and industrial plants where downtime can be more expensive than the battery itself.
This trend is also supported by rapid growth in the wider storage buildout, which makes equipment, installers, and operating know-how more available for behind-the-meter projects. In the United States, the EIA reported that cumulative utility-scale battery storage capacity exceeded 26 GW in 2024, and developers added 10.4 GW of new battery capacity in 2024 alone. Even though these are grid-scale numbers, they matter for C&I customers because they strengthen the full ecosystem—more proven inverters, better commissioning processes, and more confidence from lenders and insurers.
At the planning level, the U.S. pipeline also shows how central storage has become in modern power systems. The EIA said developers planned to add 62.8 GW of new U.S. utility-scale capacity in 2024, with battery storage accounting for 23% of planned additions. When storage becomes a mainstream capacity choice at scale, it reduces the “new technology” risk perception for commercial buyers, which is often a hidden barrier in board approvals.
Government resilience funding is reinforcing this movement. The same Reuters reporting links microgrid momentum to federal support, including $7.6 billion allocated for grid resilience. For C&I sites, resilience funding and state grant programs often make the first project easier to justify, and then the business case becomes repeatable across multiple facilities.
Drivers
Falling Battery Costs Make C&I Storage Payback Faster
One major driving factor for commercial and industrial (C&I) energy storage is simple: batteries are getting cheaper and easier to source at scale, which improves project payback for peak shaving, backup power, and solar self-consumption. In 2024, the battery industry reached a level of manufacturing depth that was hard to imagine a few years ago. The International Energy Agency (IEA) notes that global battery manufacturing capacity hit 3 TWh in 2024, after years of heavy investment across cell plants, components, and upstream processing.
Costs have also moved in a direction that changes boardroom decisions. IRENA reports that the cost of fully installed battery storage projects fell by 93% between 2010 and 2024, dropping from USD 2,571/kWh to USD 192/kWh. Even if a specific site’s final price depends on duration, safety engineering, and interconnection work, this long-term decline has made storage a “normal” line item for factories and large buildings rather than an experimental upgrade. In real operations, this shows up as more companies approving storage for predictable savings—especially where demand charges and time-of-use pricing punish high peaks.
On the deployment side, the broader market’s expansion creates real spillover benefits for C&I storage. The U.S. Energy Information Administration (EIA) reports that cumulative U.S. utility-scale battery storage capacity exceeded 26 GW in 2024, and developers added 10.4 GW in 2024 alone. Even though that statistic is about utility-scale projects, it still supports the C&I segment by expanding the installer base, improving safety practices, and pushing inverter and control-system vendors to mature their products. It also builds confidence among insurers, lenders, and facility owners because storage stops looking “rare.”
Government initiatives are reinforcing this cost-and-scale driver, particularly for next-generation systems that can serve longer runtimes. In the United States, the Department of Energy selected projects totaling $15 million to demonstrate long-duration energy storage technologies in the field. While those demonstrations are not only for C&I sites, they accelerate real-world validation—performance, degradation, safety, and operations—which ultimately improves the menu of options available to industrial buyers who need more than a couple of hours of support.
Restraints
Grid Connection Delays and Equipment Shortages Slow Projects
One major restraint for commercial and industrial (C&I) energy storage is that many sites still get stuck at the “grid connection” stage—long before the battery ever starts saving money. Even when a company has a clear use case like peak shaving or backup power, the project can be delayed by utility studies, feeder limits, and upgrade requirements. This is not a small issue in the wider power system: Lawrence Berkeley National Laboratory’s interconnection research shows that, by the end of 2023, there were nearly 12,000 projects in U.S. interconnection queues, including an estimated 1,030 GW of storage capacity seeking connection.
Time is a cost in C&I storage, because savings are usually earned month by month. When a project slips, the customer still pays high demand charges and peak tariffs while the battery sits on paper. Queue delays have also become more visible at the national level. LBNL notes that projects that do reach operation are taking longer on average, and the market is trying to fix it with process reform. In 2024, interconnection reform remained a live policy issue, and the compliance timeline itself became part of the story: FERC’s explainer on its interconnection rule updates notes a compliance deadline tied to May 16, 2024 for Order 2023-A.
A second, very practical constraint is grid equipment availability—especially transformers. Many C&I projects need a service upgrade, a new transformer, or switchgear work to safely add storage. Government and critical-infrastructure bodies have been blunt about how stretched this supply chain is. The National Infrastructure Advisory Council reported that large transformers have lead times ranging from 80 to 210 weeks. Separately, a U.S. Department of Energy report on large power transformer resilience notes that acquisition lead times are “commonly quoted” at 36 months, with maximum lead times reaching 60 months.
Opportunity
Policy Incentives and Microgrids Unlock New C&I Storage Growth
A major growth opportunity for commercial and industrial (C&I) energy storage is the rapid expansion of incentive-backed projects that pair batteries with on-site generation to create “microgrid-ready” facilities. For many factories, cold stores, hospitals, ports, and data centers, storage is no longer just a way to shave peaks—it is becoming a reliability and business-continuity tool.
In the United States, a key catalyst is that federal tax credits are explicitly designed to include energy storage technology. The IRS explains that the Clean Electricity Investment Credit applies to qualified facilities and energy storage technology placed in service after Dec. 31, 2024. The same IRS page also states a base credit of 6%, with the ability to increase based on meeting requirements such as prevailing wage and apprenticeship.
Government-backed demonstrations are also widening the range of storage options that can fit industrial needs, especially where longer backup runtimes are required. The U.S. Department of Energy announced on May 15, 2024 that it selected projects for $15 million in awards to demonstrate long-duration energy storage (LDES) technologies in real field conditions. This type of funding is an opportunity for C&I users because it accelerates commercial readiness—better warranties, clearer performance data, and more confidence from insurers and lenders.
At the state level, California is building an especially strong pipeline for non-lithium options that could fit C&I campuses and industrial parks. The California Energy Commission’s Long Duration Energy Storage program notes it has been allocated over $270 million to invest in demonstration and deployment of non-lithium-ion long-duration storage technologies across the state.
Outside the U.S., policy targets are also creating demand for flexibility that often shows up first at industrial load centers. The European Commission states that the revised Renewable Energy Directive raises the EU’s binding 2030 renewable energy target to 42.5%, with an aspiration to reach 45%.
Regional Insights
Asia Pacific leads with a 38.4% share and USD 33.5 Mn driven by rapid adoption and strong policy support
In 2024, the Asia Pacific region emerged as the leading market for commercial and industrial energy storage, securing a dominant 38.4% share and contributing approximately USD 33.5 million in revenue. This leadership was supported by rapid industrial growth, rising electricity demand, and aggressive deployment of energy storage systems combined with renewable energy assets in countries such as China, Japan, South Korea, and Australia.
The increasing focus on grid stability and demand charge management in large manufacturing hubs also accelerated adoption of battery energy storage technologies. In 2024, Asia Pacific’s supportive government policies and incentives encouraged businesses to invest in storage solutions that offer cost savings and energy resilience, especially where grid infrastructure is under strain. This environment prompted growth in both urban commercial complexes and industrial facilities, where storage systems were deployed for peak demand management, backup power, and renewable integration.
The region is expected to maintain its leading position as investment continues in distributed energy resources and smart grid modernization, while industry players expand storage offerings tailored to local regulatory frameworks. The combination of increasing renewable capacity, falling battery costs, and strong domestic manufacturing further enhances Asia Pacific’s role as the largest and one of the most dynamic markets for commercial and industrial energy storage.
Key Regions and Countries Insights
- North America
- US
- Canada
- Europe
- Germany
- France
- The UK
- Spain
- Italy
- Rest of Europe
- Asia Pacific
- China
- Japan
- South Korea
- India
- Australia
- Rest of APAC
- Latin America
- Brazil
- Mexico
- Rest of Latin America
- Middle East & Africa
- GCC
- South Africa
- Rest of MEA
Key Players Analysis
Tesla Inc. remains a leading force in commercial and industrial energy storage through its Megapack and Powerpack systems. In 2024, Tesla deployed over 14 GWh of energy storage globally. The company reported energy generation and storage revenue of approximately USD 6.0 billion in 2024, reflecting strong adoption among industrial facilities and utilities.
LG Energy Solution plays a critical role in the C&I energy storage market as a major lithium-ion battery supplier. In 2024, the company achieved battery shipment volumes above 120 GWh and recorded revenues of approximately USD 23 billion. Its cells are widely used in commercial buildings, factories, and distributed energy storage projects.
CATL leads the global battery market and is a major supplier to commercial and industrial energy storage projects. In 2024, CATL shipped over 390 GWh of battery capacity worldwide. The company generated revenues of approximately USD 55 billion, supported by strong demand for stationary storage and renewable energy integration.
Top Key Players Outlook
- Tesla Inc.
- Fluence Energy
- LG Energy Solution
- BYD Co. Ltd.
- CATL
- Panasonic Holdings Corp.
- Saft (TotalEnergies)
- Samsung SDI
- Sungrow Power Supply
- Powin Energy
Recent Industry Developments
In 2024 Fluence had surpassed 20 GWh of deployed and contracted battery-based energy storage systems globally, marking a major milestone in its scaling efforts and reflecting growing demand for industrial storage solutions.
In 2025, LG posted KRW 5.7 trillion in revenue and KRW 601.3 billion in operating profit, supported by a 120 GWh backlog of ESS and other battery orders, demonstrating continued demand for industrial storage solutions.
Report Scope
Report Features Description Market Value (2024) USD 87.3 Bn Forecast Revenue (2034) USD 293.7 Bn CAGR (2025-2034) 12.9% Base Year for Estimation 2024 Historic Period 2020-2023 Forecast Period 2025-2034 Report Coverage Revenue Forecast, Market Dynamics, Competitive Landscape, Recent Developments Segments Covered By Technology (Lithium-ion, Sodium-ion, Lead-acid, Flow Batteries, Others), By Application (Peak Shaving, Load Shifting, Backup Power/UPS, Renewable Integration, Ancillary Services (Frequency Regulation), Demand-charge Management, EV Fast-charging Support, Microgrid Stabilisation, Others), By End-user (Commercial Buildings, Industrial Facilities, Data Centres, Educational Institutions, Healthcare Facilities, Telecom BTS and Edge Sites, EV-fleet Operators and Charging Hubs, Others) Regional Analysis North America – US, Canada; Europe – Germany, France, The UK, Spain, Italy, Rest of Europe; Asia Pacific – China, Japan, South Korea, India, Australia, Singapore, Rest of APAC; Latin America – Brazil, Mexico, Rest of Latin America; Middle East & Africa – GCC, South Africa, Rest of MEA Competitive Landscape Tesla Inc., Fluence Energy, LG Energy Solution, BYD Co. Ltd., CATL, Panasonic Holdings Corp., Saft (TotalEnergies), Samsung SDI, Sungrow Power Supply, Powin Energy Customization Scope Customization for segments, region/country-level will be provided. Moreover, additional customization can be done based on the requirements. Purchase Options We have three licenses to opt for: Single User License, Multi-User License (Up to 5 Users), Corporate Use License (Unlimited User and Printable PDF)  Commercial And Industrial Energy Storage MarketPublished date: Jan 2026add_shopping_cartBuy Now get_appDownload Sample
 -
-
- Tesla Inc.
- Fluence Energy
- LG Energy Solution
- BYD Co. Ltd.
- CATL
- Panasonic Holdings Corp.
- Saft (TotalEnergies)
- Samsung SDI
- Sungrow Power Supply
- Powin Energy
Our Clients
- 173868
- Jan 2026


