


Report Overview
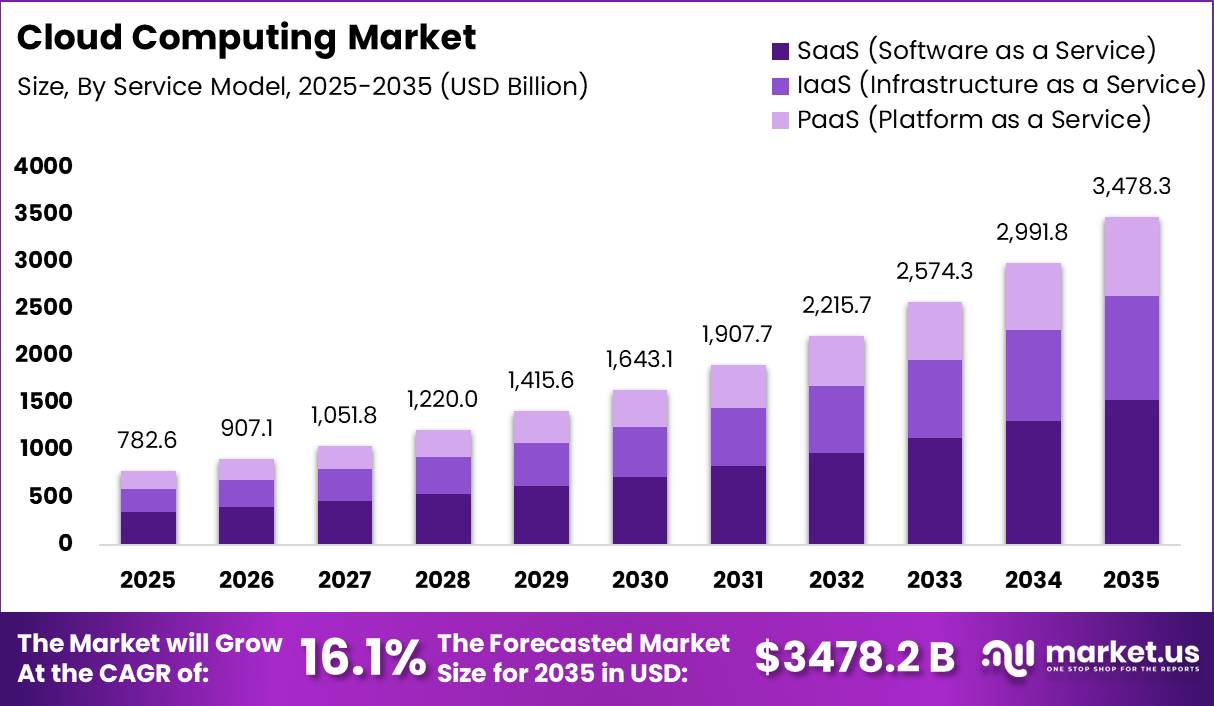
In 2025, the Global Cloud Computing Market was valued at USD 782.5 billion. The market is projected to grow at a CAGR of 16.1% during 2026–2035, reaching approximately USD 3478.2 billion by 2035. North America dominated the global market in 2025, accounting for more than 42.0% of the total market share and generating approximately USD 328.7 billion in revenue.
The International Telecommunication Union estimated that nearly 6 billion people, representing 74% of the global population, were using the internet, compared with 5.8 billion users in 2024. Global internet traffic reached several zettabytes per year, increasing demand for cloud storage, computing capacity and content delivery services. As data volumes rise, companies in banking, retail, healthcare and manufacturing are shifting workloads from on-premise systems to cloud platforms to improve scalability, cost efficiency, reliability and cybersecurity.
North America benefits from the strong presence of hyperscale cloud providers and technology exporters. According to the World Bank, the United States accounts for an estimated 87% of global cloud computing exports, with exports growing at around 23% annually. Rising internet use, higher data generation, government digitalization programs, and continued infrastructure investment are expected to support the market’s expansion from hundreds of billions of dollars in 2025 to more than USD 3 trillion by 2035.
Key Takeaway
- The Global Cloud Computing Market was valued at USD 782.5 billion in 2025 and is projected to reach USD 3478.29 billion by 2035, at a CAGR of 16.1%.
- Software as a Service (SaaS) led the service model segment with approximately 44.0% of total market revenue, while Platform as a Service (PaaS) is the fastest-growing segment.
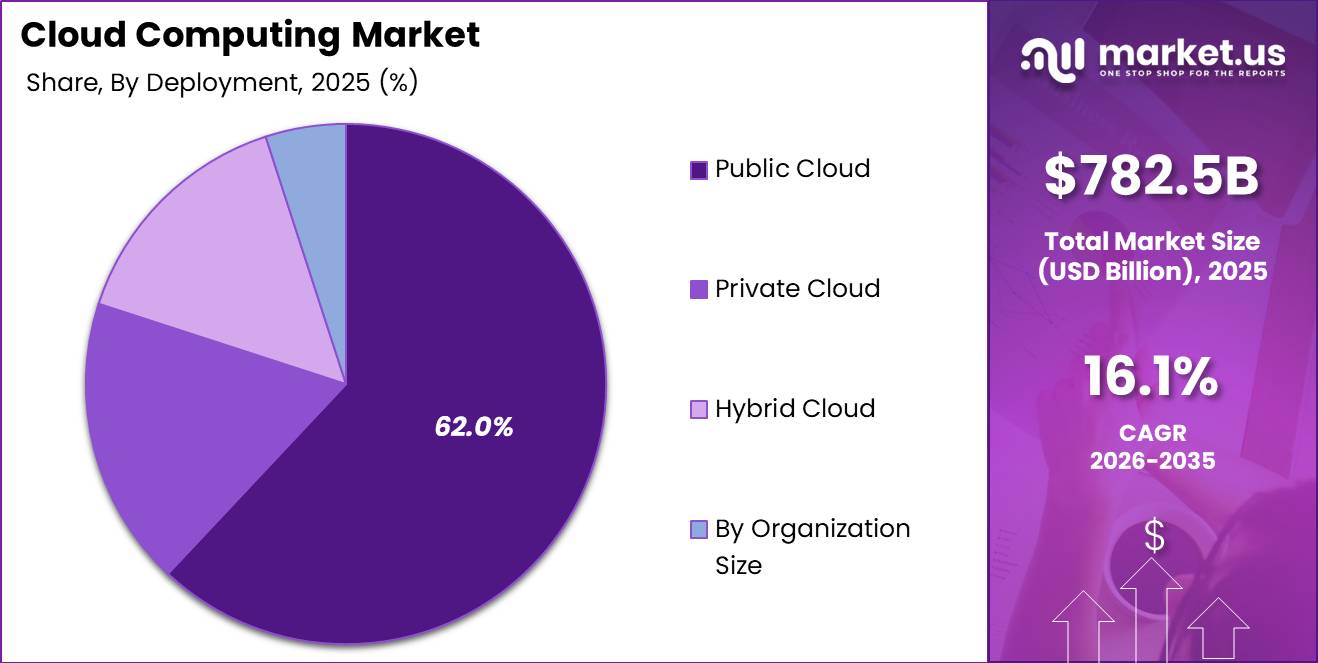
- Public cloud accounted for approximately 62% of total deployment revenue, while hybrid cloud is expected to record the fastest growth.
- Large enterprises represented around 60.0% of cloud computing spend, while SMEs are the fastest-growing organization-size segment.
- IT and telecommunications held the largest end-user share at approximately 22.0%, while healthcare is expected to be the fastest-growing end-user segment.
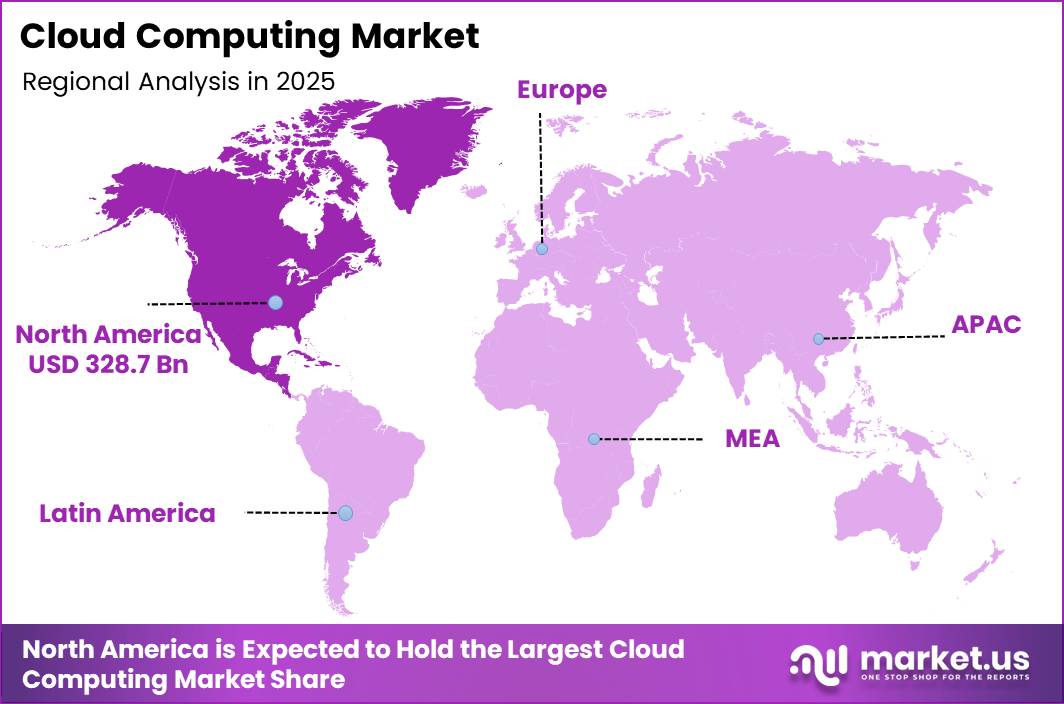
- North America led the global market in 2025 with more than 42.0% share, generating approximately USD 328.7 billion in revenue.
By Service Model
Software as a Service (SaaS) held the leading position in the cloud service model segment, accounting for approximately 44.0% of total market revenue. SaaS leads because it allows organizations to access software through recurring subscriptions instead of purchasing and maintaining applications on local systems. Common SaaS products include office software, customer relationship management, video conferencing, finance applications, and project management tools.
According to Eurostat, 45.2% of EU enterprises purchased cloud computing services in 2023. Among these cloud users, 66.3% purchased office software, 51.6% used finance or accounting applications, and 25.0% adopted customer relationship management tools. The subscription model reduces upfront technology spending for customers while providing vendors with stable, recurring revenue from each user, application, or service module.
Platform as a Service is expected to be the fastest-growing cloud service model, supported by the shift toward cloud-native application development. The Cloud Native Computing Foundation’s 2024 survey showed wider use of containers, Kubernetes and managed cloud platforms for software development and deployment. PaaS provides ready-to-use databases, container orchestration, serverless computing and application development tools, reducing the need to manage operating systems, middleware and runtime environments.
By Deployment
Public cloud remained the largest deployment model in the cloud computing market, accounting for approximately 62% of total revenue. Its leadership is supported by rapid scalability, pay-as-you-go pricing and broad geographic availability, which are difficult for most organizations to achieve through on-premise infrastructure.
This shift requires flexible, secure, and continuously available computing infrastructure, strengthening demand for public cloud platforms. Governments and public agencies are also increasingly using commercial cloud services to replace legacy systems, improve service delivery, and strengthen operational resilience without investing heavily in new data centers.
By Organization Size
Large enterprises account for around 60.0% of cloud computing spend because they run complex, global operations that demand high-performance infrastructure, advanced security, and continuous availability. Eurostat reports that in 2023, 45.2% of all EU enterprises purchased cloud services, but usage rates are much higher among larger firms, with cloud adoption often exceeding 70% in digitally advanced economies such as Finland and Sweden.
SMEs, however, represent the fastest-growing cloud segment as they move from basic email and storage to more advanced platforms. As digital commerce, online payments, and remote work tools spread across tens of millions of SMEs worldwide, each additional SaaS subscription or hosted application rides on underlying cloud infrastructure, driving rapid percentage growth in SME-driven cloud demand from a still-underpenetrated base.
By End User
IT and telecommunications companies held the largest share of cloud computing spending, accounting for approximately 22.0% of the total market. Their leading position is supported by their dual role as major providers and users of digital infrastructure. Telecom operators are expanding 5G networks, which are expected to support more than 5.3 billion mobile broadband subscriptions worldwide by 2028.
This expansion is increasing data traffic and encouraging operators to adopt cloud-based network cores, virtualized network functions and edge data centers instead of relying only on dedicated hardware. The continued growth of video streaming, online gaming and enterprise collaboration also creates strong demand for flexible computing, storage, content delivery, network analytics and customer management systems.
Key Market Segments
By Service Model
- IaaS (Infrastructure as a Service)
- Compute Services
- Storage Services
- Networking Services
- PaaS (Platform as a Service)
- Application Development Platforms
- Data & Analytics Platforms
- Integration Platforms
- SaaS (Software as a Service)
- CRM / ERP SaaS
- Collaboration SaaS
- Security SaaS
By Deployment
- Public Cloud
- Private Cloud
- Hybrid Cloud
- Hybrid IaaS
- Hybrid SaaS
By Organization Size
- Large Enterprises
- SMEs
- Small Business
- Medium Business
By End User
- IT & Telecom
- BFSI
- Retail & E-commerce
- Healthcare
- Telehealth Platforms
- Electronic Health Records
- Manufacturing
- Government
- Education
- Others
Geopolitical Impact Analysis
Geopolitical disruptions are increasing the cost and slowing the development of cloud infrastructure because data centers depend on global supply chains for semiconductors, servers, power equipment, and energy. In 2024, WTO monitoring showed that import restrictions covered goods trade worth USD 2,272 billion, equal to 9.7% of global imports.
This indicates a wider use of tariffs and non-tariff barriers that can affect information and communication technology hardware. Applied most-favoured-nation tariffs on several information technology and electrical machinery products remain between 3–8% in major markets.
Any additional tariff on server chips, networking equipment or electrical systems can raise the delivered cost of cloud infrastructure by several percentage points. Shipping disruptions have also forced some Asia–Europe container vessels to travel around the Cape of Good Hope, adding approximately 10–15 sailing days on selected routes and increasing freight costs for racks, batteries and construction materials.
Energy price volatility creates further pressure on cloud providers. The International Energy Agency recorded wholesale electricity price increases of 50–200% in parts of Europe during recent gas supply disruptions, while electricity prices in several countries remained above 2019 levels. This is important because power can represent around 30–50% of data center operating expenditure.
Regional Analysis
North America held the leading position in the global cloud computing market, accounting for 42.0% of total revenue, equivalent to approximately USD 328.7 billion. The region’s dominance is supported by the early adoption of cloud technologies, advanced digital infrastructure, and the strong presence of hyperscale cloud providers.
Large enterprises in the United States and Canada have already shifted many core business workloads to cloud platforms. These companies are now increasing investments in artificial intelligence, big data analytics and edge computing, strengthening North America’s role as a major center for cloud demand, innovation and infrastructure development.
Asia Pacific is expected to become the fastest-growing regional market due to rapid digital transformation, expanding broadband networks and wider 5G coverage. The region has a large base of small and medium-sized enterprises and digital-native companies that are increasingly adopting cloud-first operating models.
China, India, Japan, South Korea and ASEAN countries are investing in data centers, local cloud regions and smart city infrastructure, supporting double-digit annual growth in cloud spending from a comparatively smaller base. The expansion of e-commerce, financial technology and government-supported digital infrastructure is increasing demand for infrastructure-as-a-service, platform-as-a-service and software-as-a-service solutions.
Key Regions and Countries
North America
- US
- Canada
Europe
- Germany
- France
- The UK
- Spain
- Italy
- Rest of Europe
Asia Pacific
- China
- Japan
- South Korea
- India
- Australia
- Rest of APAC
Latin America
- Brazil
- Mexico
- Rest of Latin America
Middle East & Africa
- GCC
- South Africa
- Rest of MEA
Market Dynamics
Drivers
| Driver | (~) % CAGR | Geographic Relevance | Impact Timeline |
|---|---|---|---|
| AI & Generative AI Workload Integration | +3.8% | Global, led by North America & East Asia | Short term (≤ 2 years) |
| Enterprise Digital Transformation Mandates | +2.6% | Global, concentrated in North America, Western Europe & India | Short term (≤ 2 years) |
| Hyperscaler CapEx Surge in Data Center Build-Out | +2.2% | North America, Western Europe, Southeast Asia | Medium term (2–4 years) |
| SaaS & PaaS Consumption Model Shift | +1.9% | Global, strongest in OECD economies | Short term (≤ 2 years) |
| Government & Public Sector Cloud Adoption | +1.4% | India, Middle East, Southeast Asia, EU | Medium term (2–4 years) |
| SME Cloud-First Infrastructure Adoption | +1.1% | Asia-Pacific, Latin America, Sub-Saharan Africa | Medium term (2–4 years) |
AI & Generative AI Workload Integration
The convergence of generative AI model training and inference with hyperscale cloud infrastructure is the single most potent demand accelerant active in the market today. By the close of 2024, the combined capital expenditure of the four largest hyperscalers Amazon, Microsoft, Alphabet, and Meta reached roughly $130 billion in a single quarter (Q1 2026), with full-year 2026 hyperscaler CapEx projected to exceed $750 billion, representing a near 70% year-on-year increase from 2025.
This re-architecture of cloud infrastructure around GPU-dense, high-memory compute clusters is compressing the product cycle from traditional IaaS toward AI-as-a-Service layers, where per-token and per-inference consumption billing models command gross margins structurally 15–25 percentage points above legacy compute rentals. Data center capacity demand is projected to nearly triple by 2030, with approximately 70% of that demand attributable to AI workloads, requiring an estimated $5.2 trillion in AI-specific data center CapEx over the same horizon.
Restraints
| Restraint | (~) % CAGR | Geographic Relevance | Impact Timeline |
|---|---|---|---|
| Data Sovereignty & Cross-Border Regulation | -2.4% | EU, UK, India, China, Southeast Asia | Short term (≤ 2 years) |
| Energy & Power Infrastructure Bottleneck | -1.8% | North America, Western Europe, India | Medium term (2–4 years) |
| Elevated Interest Rates & IT CapEx Compression | -1.2% | Global, most acute in emerging markets | Short term (≤ 2 years) |
| Geopolitical Fragmentation & Cloud Decoupling | -1.0% | China, Russia, select Middle East & Southeast Asia | Medium term (2–4 years) |
| Structural Cloud Budget Overrun & Waste | -0.9% | Global, concentrated in mid-market enterprises | Short term (≤ 2 years) |
Data Sovereignty & Cross-Border Regulation
Overlapping data sovereignty regulations are creating a major barrier to global cloud adoption. The European Union’s GDPR, DORA, which became applicable in January 2025, the EU Data Act, applicable from September 2025, and NIS2 impose strict requirements related to data residency, security, auditability, and portability.
The U.S. CLOUD Act adds further complexity because it may allow U.S. authorities to request data controlled by U.S.-headquartered providers, regardless of its physical storage location. These additional requirements can increase cloud architecture costs by an estimated 18–30% compared with a single-provider global deployment.
Challenges
| Challenge | (~) % CAGR | Geographic Relevance | Mitigation Horizon |
|---|---|---|---|
| Cloud Skills & Talent Deficit | -2.1% | Global, most acute in Asia-Pacific & Latin America | Long term (≥ 4 years) |
| Cybersecurity Threat Surface Expansion | -1.6% | Global | Long term (≥ 4 years) |
| Vendor Lock-In & Portability Friction | -1.3% | Global, concentrated in mid-to-large enterprises | Medium term (2–4 years) |
| Multi-Cloud Complexity & Governance Overhead | -1.0% | Global, most acute in regulated industries | Medium term (2–4 years) |
| Legacy Workload Migration Friction | -0.8% | Global, concentrated in EMEA & North America | Long term (≥ 4 years) |
| Cloud Cost Unpredictability & FinOps Immaturity | -0.7% | Global, concentrated in mid-market & SME segments | Medium term (2–4 years) |
Cloud Skills & Talent Deficit
The shortage of skilled cloud professionals remains a major constraint on market growth. More than 90% of global organizations are expected to face measurable IT skills shortages by 2026, with the combined impact on productivity and project delivery estimated at USD 5.5 trillion. The cybersecurity workforce gap is also projected to reach nearly 4.8 million unfilled roles by 2026, particularly across cloud security, AI-based defense and incident response.
The most limited skills include multi-cloud architecture, hybrid cloud design, infrastructure-as-code, Kubernetes, cloud compliance and FinOps. A shortage of experienced architects is estimated to extend enterprise cloud transformation schedules by 30–50% and increase service costs by 20–35%, as organizations rely on external managed-service providers.
Cloud vendors also face pressure to include consulting, training credits and implementation support in enterprise contracts, which can reduce profit margins. The World Economic Forum estimates that around 60% of the global workforce will require retraining by the middle of the decade, highlighting the scale of investment needed to close the cloud and digital skills gap.
Opportunities
| Opportunity | (~) % CAGR | Geographic Relevance | Execution Window |
|---|---|---|---|
| Edge-Cloud Convergence for IoT & Real-Time AI | +2.9% | Global, led by North America, EU, East Asia | Medium term (2–4 years) |
| Sovereign & Regulated-Industry Cloud Build-Out | +2.3% | EU, India, Middle East, Southeast Asia | Medium term (2–4 years) |
| Quantum-Cloud Hybrid Services Commercialization | +1.5% | North America, EU, China | Long term (≥ 4 years) |
| Cloud-Native AI Monetization for SMEs | +1.8% | Asia-Pacific, Latin America, India | Short term (≤ 2 years) |
| Green Cloud & Sustainability-Linked Services | +1.2% | EU, North America, Australia | Medium term (2–4 years) |
| Cloud Marketplace & SaaS Ecosystem Monetization | +1.0% | Global, led by North America & Western Europe | Short term (≤ 2 years) |
Edge-Cloud Convergence for IoT & Real-Time AI
Edge-cloud convergence represents a distinct growth opportunity beyond the current market CAGR because its revenue model, infrastructure ownership and customer base differ from centralized hyperscale cloud services. AI workloads at the edge accounted for only 13% of total data center demand in 2025, but this share is projected to rise to 28% by 2027. However, managed edge-cloud services for autonomous vehicles, smart manufacturing, connected healthcare and smart cities remain largely underdeveloped as recurring revenue sources.
The opportunity lies in deploying purpose-built edge nodes near 5G infrastructure and industrial Internet of Things clusters. This model shifts billing from centralized computing hours toward outcome-based contracts linked to latency, inference throughput and uptime. Edge-based AI inference services can command an estimated 35–55% premium per inference compared with centralized cloud processing because they support critical, real-time applications.
Global data center capacity is projected to expand at a 23% CAGR through 2030, while edge infrastructure remains below the level required by many industries. Manufacturing, energy and logistics companies often need response times below 10 milliseconds, which centralized cloud systems may not consistently provide.
Key Players Analysis
Tier-1 cloud providers are led by Amazon Web Services, Microsoft Azure and Google Cloud Platform, which together account for an estimated 60–65% of global cloud infrastructure and platform revenue. AWS generated USD 90 billion in revenue in 2023 and USD 107.6 billion in 2024, with operating income of approximately USD 23–24 billion.
Microsoft’s Intelligent Cloud segment recorded USD 36.8 billion in revenue during a single quarter of FY2024 and achieved 20% year-on-year growth for the full fiscal year. Azure and other cloud services expanded by 30%, indicating an annualized cloud revenue run rate above USD 100 billion. Google Cloud has been growing at a mid-30% annual rate, with quarterly revenue in the low-to-mid teens of USD billions. These companies also invest tens of billions of dollars each year in data centers, artificial intelligence chips and undersea cables, creating strong entry barriers.
Tier-2 providers compete through regional strength, specialized software and industry-focused services. Alibaba Cloud reported quarterly revenue of approximately USD 6 billion, or 43.3 billion yuan, representing 36% year-on-year growth. Its artificial intelligence products achieved triple-digit growth for nine consecutive quarters, while the parent company targets USD 100 billion in annual artificial intelligence and cloud revenue within five years.
Oracle and Salesforce each generate several tens of billions of dollars annually, mainly from database, CRM and SaaS products. IBM, SAP, Tencent Cloud, Huawei Cloud, VMware and Rackspace focus on sovereign cloud, hybrid infrastructure and managed services. Together, Tier-2 companies are estimated to hold 25–30% of global cloud revenue.
Top Key Players in the Market
- Amazon Web Services
- Microsoft Azure
- Google Cloud Platform
- Alibaba Cloud
- IBM Cloud
- Salesforce
- Oracle Cloud
- SAP Cloud
- Tencent Cloud
- Huawei Cloud
- Rackspace Technology
- VMware (Broadcom)
Recent Developments
- In June 2026, Cloud Capital, Realty Income, and a global institutional investor formed a joint venture backed by more than USD 6 billion in hyperscale data center assets. The venture initially included three facilities in Northern Virginia with over 330 MW of contracted IT capacity across 4.2 million sq. ft. Realty Income plans to invest up to USD 1.4 billion for a 45% stake. Around USD 700 million is expected to be funded during Q2–Q3 2026.
- In September 2025, Microsoft announced an additional USD 4 billion investment in a second AI-focused data center campus in Wisconsin. Together with its earlier USD 3.3 billion commitment, the company’s total planned investment in the state exceeded USD 7 billion. The project is designed to expand Azure cloud and artificial intelligence capacity. It is also expected to increase permanent employment from nearly 500 to around 800 positions.
- In July 2025, KKR and Energy Capital Partners announced a USD 4 billion hyperscale data center development in Bosque County, Texas. The project will be developed with CyrusOne and is planned to provide approximately 190 MW of power capacity. It represents the first major investment under the partners’ broader USD 50 billion infrastructure program. Commercial operations are expected to begin in Q4 2026.
Report Scope
| Report Features | Description |
|---|---|
| Market Value (2025) | USD 782.5 Billion |
| Forecast Revenue (2035) | USD 3478.2 Billion |
| CAGR (2026–2035) | 16.1% |
| Base Year for Estimation | 2025 |
| Historic Period | 2020-2024 |
| Forecast Period | 2026-2035 |
| Report Coverage | Revenue Forecast, Market Dynamics, Competitive Landscape, Recent Developments |
| Segments Covered | By Service Model (IaaS, PaaS, SaaS); By Deployment (Public Cloud, Private Cloud, Hybrid Cloud); By Organization Size (Large Enterprises, SMEs); By End User (IT & Telecom, BFSI, Retail & E-commerce, Healthcare, Manufacturing, Government, Education, Others) |
| Regional Analysis | North America – US, Canada; Europe – Germany, France, The UK, Spain, Italy, Rest of Europe; Asia Pacific – China, Japan, South Korea, India, Australia, Singapore, Rest of APAC; Latin America – Brazil, Mexico, Rest of Latin America; Middle East & Africa – GCC, South Africa, Rest of MEA |
| Competitive Landscape | Amazon Web Services, Microsoft Azure, Google Cloud Platform, Alibaba Cloud, IBM Cloud, Salesforce, Oracle Cloud, SAP Cloud, Tencent Cloud, Huawei Cloud, Rackspace Technology, VMware (Broadcom) |
| Customization Scope | Customization for segments and region/country-level will be provided. Moreover, additional customization can be done based on the requirements. |
| Purchase Options | We have three licenses to opt for: Single User License, Multi-User License (Up to 5 Users), Corporate Use License (Unlimited Users and Printable PDF) |





























