
Quick Navigation
Report Overview
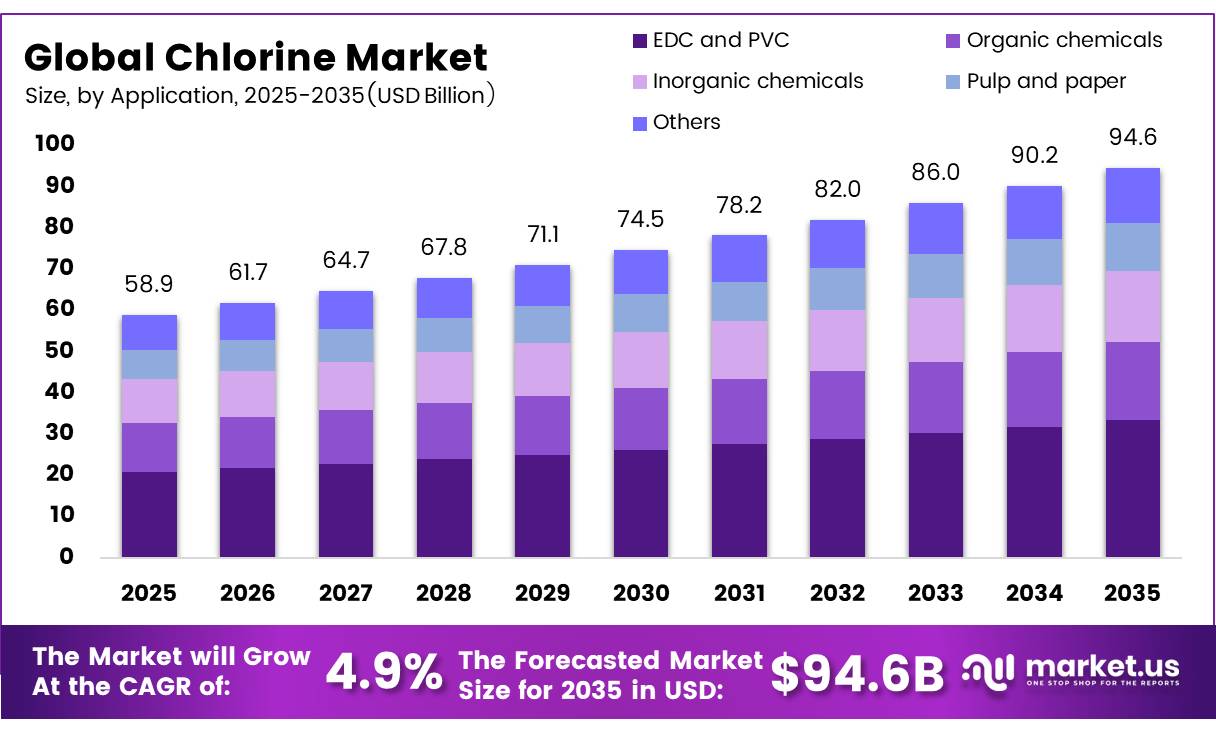
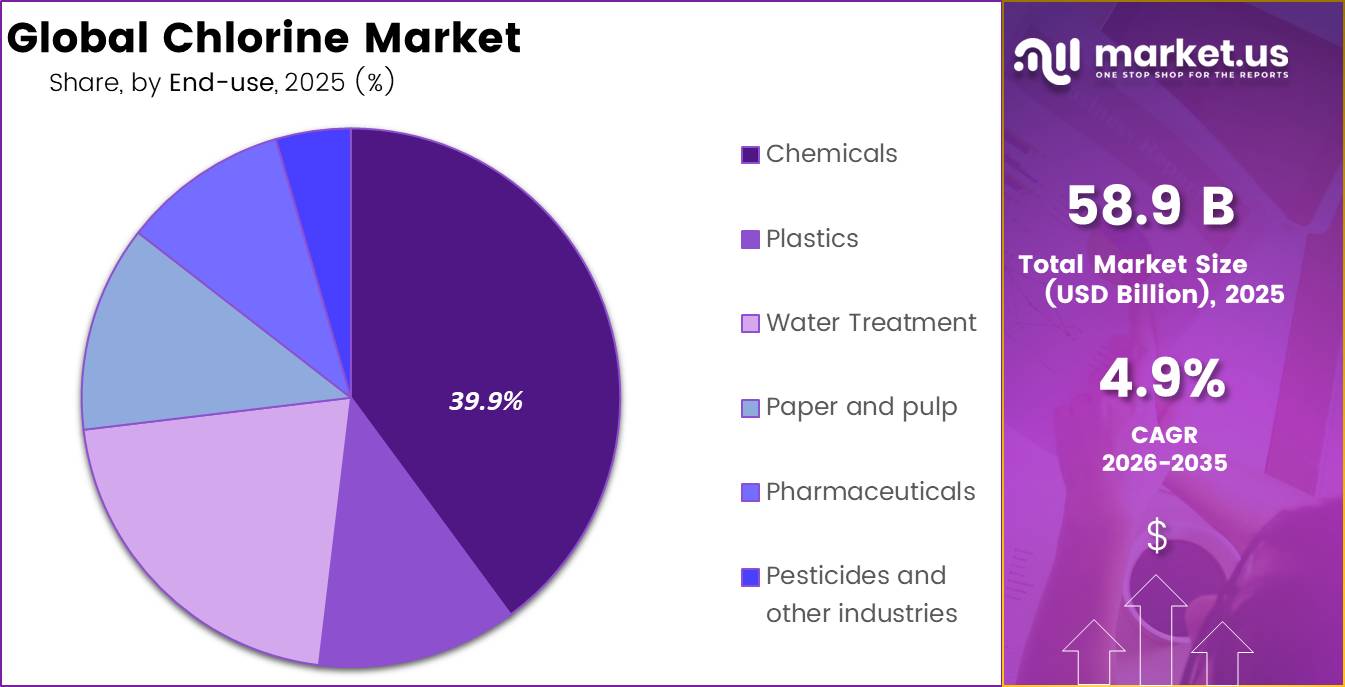
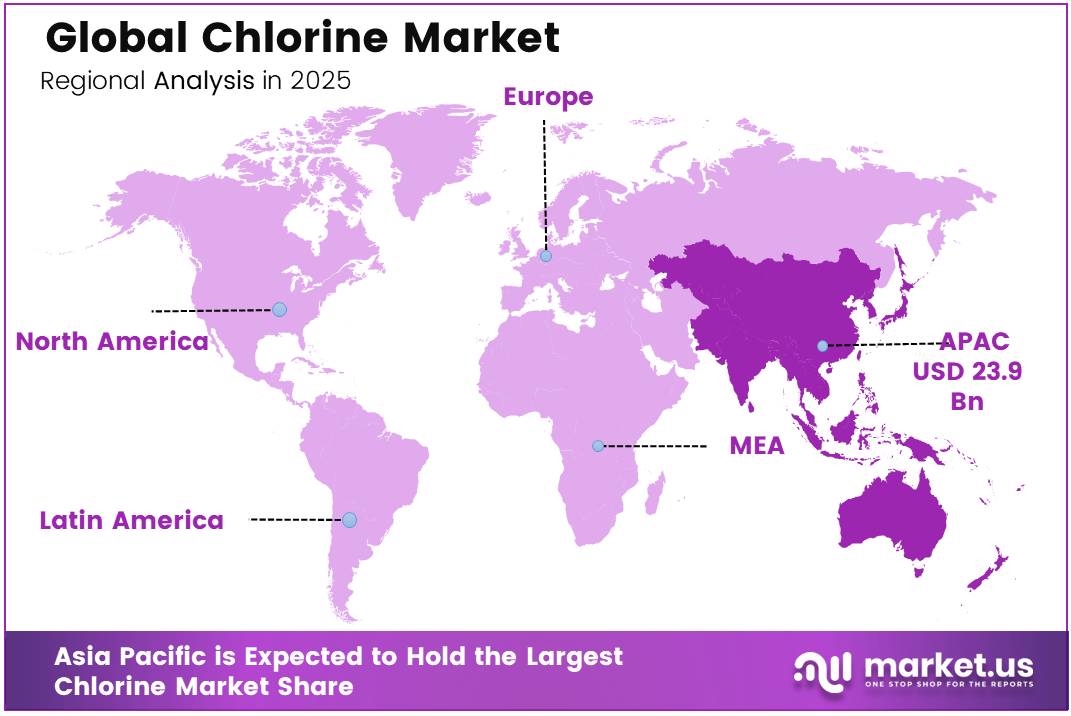
The global chlorine market was valued at USD 58.9 billion in 2025 and is expected to grow to USD 94.6 Billion in 2035. Between 2025 and 2035, this market is estimated to register a CAGR of 4.9%. In 2025, Asia Pacific led the market, achieving over 40.7% share with a revenue of US$ 23.9 Billion.
Key Takeaways
• The Global chlorine market was valued at US$58.9 billion in 2025.
• The global chlorine market is projected to grow at a CAGR of 4.9% and is estimated to reach US$94.6 billion by 2035.
• Based on form, liquid chlorine dominated the market, accounting for 65.1% of the total market share.
• Based on application, EDC and PVC represented the leading segment, constituting 35.2% of the chlorine market.
• Among the end-users, the chemicals industry held the largest market share of 39.9%.
• In 2025, Asia Pacific was the dominant region in the global chlorine market, accounting for 40.7% of the total market share.
The chlorine industry is a core part of the chlor-alkali value chain, supplying inputs for polyvinyl chloride, organic and inorganic chemicals, pulp and paper processing, pharmaceuticals, and water disinfection.
- Chlorine is mainly produced by electrolysing purified salt brine, alongside caustic soda and hydrogen. Euro Chlor reports that its members operate 60 manufacturing locations across 19 European countries, with 11 million tonnes of chlorine capacity.
Current operating conditions remain mixed. European chlorine output reached 629,642 tonnes in April 2026, while elevated electricity prices, weaker chemical demand, regulatory costs, and global overcapacity continued to pressure regional plants.Feedstock availability remains strong: the U.S. Geological Survey estimated American salt production at 40 million tonnes in 2025. The chemical industry represented about 42% of domestic salt sales, and brine supplied nearly 90% of salt used as chemical feedstock, with chlorine and caustic soda producers identified as the principal chemical consumers.
Demand is supported by PVC production, sanitation investment, industrial cleaning, bleaching, and chemical synthesis. WHO and UNICEF reported that 2.1 billion people still lacked safely managed drinking water in 2024, indicating substantial long-term requirements for treatment and disinfection infrastructure. In the United States, more than one in five people receive water treated with chloramines, which are commonly produced by combining ammonia with chlorine.
Future growth opportunities are expected to emerge from expanding PVC and caustic soda requirements, particularly across Asia, alongside municipal water upgrades and industrial wastewater treatment. USGS expects global chlor-alkali brine demand to rise in 2026 as PVC and caustic soda consumption increases.Producers are also likely to prioritise efficient membrane electrolysis, renewable electricity procurement, hydrogen utilisation, plant automation, and safer onsite supply systems to reduce energy exposure, emissions, and transportation risks while improving operating reliability.
Chlorine Market Segmentation
By Form Analysis
Liquid Chlorine Leads with 65.1% Due to Its Broad Industrial Use
In 2025, Liquid chlorine held a dominant market position, capturing more than a 65.1% share. Its leading position was supported by wide use in water treatment, chemical production, pulp and paper processing, and disinfectant manufacturing. Liquid chlorine is easier to store and transport in pressurised containers than gaseous chlorine, making it suitable for large municipal and industrial facilities. By June 2026, demand remained steady as manufacturers continued to rely on liquid chlorine for controlled dosing, dependable supply, and integration with existing processing systems. Its strong role in producing PVC, solvents, and other chlorinated chemicals further supported segment leadership.
Gaseous chlorine is emerging as a growing segment because it provides rapid disinfection and strong oxidation performance. It is mainly used at facilities equipped with dedicated handling, monitoring, and safety systems, particularly in large-scale water treatment and chemical processing operations.
Application Analysis
EDC and PVC Dominate with 35.20% Due to Strong Construction and Manufacturing Demand
In 2025, EDC and PVC held a dominant market position, capturing more than a 35.20% share. Their leadership was supported by the extensive use of chlorine in producing ethylene dichloride, the main feedstock for vinyl chloride and PVC. Strong demand from pipes, flooring, cables, window profiles, medical products, and packaging kept chlorine consumption steady across this application. By June 2026, infrastructure development, urban construction, and the replacement of ageing water networks continued to support PVC production. Manufacturers also preferred PVC because of its durability, chemical resistance, and suitability for different industrial and consumer products.
Organic chemicals are emerging as a growing application segment. Chlorine is widely used as a processing agent and intermediate in solvents, refrigerants, pharmaceuticals, agrochemicals, and speciality chemicals, supporting consistent demand from diversified manufacturing industries.
End User Analysis
Chemicals Leads with 39.9% as Broad Industrial Use Supports Strong Chlorine Demand
In 2025, Chemicals held a dominant market position, capturing more than a 39.9% share. The segment remained ahead because chlorine is widely used in producing solvents, intermediates, disinfectants, bleaching agents, and other essential chemical products. Large chemical facilities depend on a steady chlorine supply for continuous processing, making integrated chlor-alkali plants important to overall demand. By June 2026, consumption remained supported by water treatment, pharmaceuticals, agrochemicals, pulp processing, and specialised manufacturing. Producers also benefited from established distribution networks, long-term supply contracts, and close links with downstream chemical plants.
Plastics is emerging as a growing end-user segment as chlorine remains essential in PVC production. Demand is supported by pipes, cables, flooring, packaging, medical products, and durable construction materials.
Key Market Segments
By Form
- Liquid chlorine
- Gaseous chlorine
By Application
- EDC and PVC
- Organic chemicals
- Inorganic chemicals
- Pulp and paper
- Others
By End-user
- Chemicals
- Plastics
- Water Treatment
- Paper and pulp
- Pharmaceuticals
- Pesticides and other industries
Drivers
Restraint
Opportunity
Challenge
Geopolitical Impact Analysis
Trade Policies, Energy Security, and Industrial Strategies Are Reshaping the Global Chlorine Market
Geopolitical tensions are affecting the global chlorine market through rising energy costs, trade restrictions, and supply-chain disruptions. Chlorine production requires large amounts of electricity, making operating costs highly sensitive to regional power prices and energy-security policies. This is particularly important in Europe, where industrial electricity prices remain higher than in the United States and China, reducing the competitiveness of chlor-alkali producers.
Shipping disruptions also influence the movement of salt, plant equipment, PVC resin, ethylene dichloride, and other chlorine-based products. In early 2024, trade through the Suez Canal declined by 50%, while Panama Canal trade fell by 32%. Longer shipping routes increased freight costs and delayed chemical deliveries across major industrial markets.
Trade policies are further changing downstream chlorine demand. In January 2025, the European Commission imposed anti-dumping duties ranging from 74.2% to 100.1% on PVC imports from Egypt and 58% to 77% on PVC imports from the United States. Since PVC is a major chlorine-consuming product, these duties can redirect trade flows and support regional production.
As a result, chlorine manufacturers are focusing on local sourcing, integrated PVC production, stable electricity contracts, and regional capacity expansion to reduce geopolitical and supply-chain risks.
Regional Analysis
Asia Pacific Leads Through Strong Chemical and PVC Production
In 2025, Asia Pacific held market leadership, accounting for 40.7% and USD 23.97 billion. The region benefited from large chlor-alkali production bases, expanding chemical manufacturing, municipal water treatment, and demand for PVC across construction, packaging, cables, and consumer goods. China remained the main production centre. In February 2026, its National Bureau of Statistics reported that caustic soda output reached 46.54 million tonnes in 2025, rising 5.0% from the previous year.
As caustic soda and chlorine are produced together through chlor-alkali electrolysis, this scale reflects substantial chlorine availability. Capacity expansion also strengthened supply. In September 2025, Bohai Chemical’s Nangang complex reached 900,000 tonnes of caustic soda capacity and 1.2 million tonnes of PVC capacity. Continued industrial investment and infrastructure demand are expected to support regional leadership.
Key Regions and Countries Covered
- North America
- US
- Canada
- Europe
- Germany
- France
- The UK
- Spain
- Italy
- Rest of Europe
- Asia Pacific
- China
- Japan
- South Korea
- India
- Australia
- Rest of APAC
- Latin America
- Brazil
- Mexico
- Rest of Latin America
- Middle East & Africa
- South Africa
- Saudi Arabia
- UAE
- Rest of MEA
Key Players Analysis
Chlorine manufacturers compete through production scale, energy efficiency, downstream integration, and reliable supply. This structure allows them to use chlorine close to production sites, reduce transport risks, and balance output with caustic soda demand.
Market participants continue investing in membrane-cell technology, plant automation, renewable electricity, and capacity upgrades to lower energy consumption and improve operating safety. Large producers also secure long-term agreements with water-treatment, chemical, pulp and paper, and plastics manufacturers.
Regional expansion remains important, particularly in Asia Pacific, where new chemical and PVC facilities support chlorine consumption. Access to affordable electricity, salt feedstock, established distribution networks, and downstream manufacturing capacity strongly influences competitive positioning. Strategic partnerships and plant integration help key players strengthen customer relationships and protect market share.
Market Key Players
- Olin Corporation
- Occidental Petroleum Corporation OxyChem
- Westlake Corporation
- INEOS Group Holdings SA
- Dow Inc
- Solvay SA
- Hanwha Solutions Corporation
- Tata Chemicals Ltd
- Formosa Plastics Corporation
- Aditya Birla Chemicals India Ltd
- Nouryon
- Ercros SA
- BASF SE
- ERCO Worldwide
- Chemtrade Logistics
- Other companies
Key Development
- In March 2025, major chemical companies expanded chlor-alkali production capacities and invested in energy-efficient technologies, strengthening competition in the global chlorine market and improving overall production efficiency.
- In July 2025, industry players increasingly adopted low-carbon and sustainable chlorine manufacturing technologies in response to stricter environmental regulations, driving a shift toward greener production processes and reduced CO₂ emissions across the sector.
Report Scope
| Report Features | Description |
|---|---|
| Market Value (2025) | US$58.9 Bn |
| Forecast Revenue (2035) | US$ 94.6 Bn |
| CAGR (2026-2035) | 4.9% |
| Base Year for Estimation | 2025 |
| Historic Period | 2020-2024 |
| Forecast Period | 2026-2035 |
| Report Coverage | Revenue Forecast, Market Dynamics, Competitive Landscape, Recent Developments |
| Segments Covered | By Form (Liquid Chlorine, Gaseous Chlorine) By Application (EDC/PVC, Inorganic Chemicals, Organic Chemicals, Paper and Pulp, Others), By End User (Chemicals, Plastics, Water Treatment, Paper and pulp, Pharmaceuticals, Pesticides and other industries) |
| Regional Analysis | North America – The US & Canada; Europe – Germany, France, The UK, Spain, Italy, Russia & CIS, Rest of Europe; APAC– China, Japan, South Korea, India, ASEAN & Rest of APAC; Latin America– Brazil, Mexico & Rest of Latin America; Middle East & Africa– GCC, South Africa, & Rest of MEA |
| Competitive Landscape | BASF SE Profiled, Olin Corporation, The Dow Chemical Company, Occidental Petroleum Corporation, Ercros, PPG Industries, De Nora, Inovyn, Hanwha Chemical Corporation, Formosa Plastics Corporation, Ineos Group Ltd, Tata Chemicals Limited, Xinjiang Zhongtai Chemicals Co. Ltd, Tosoh Corporation |
| Customization Scope | Customization for segments, region/country-level will be provided. Moreover, additional customization can be done based on the requirements. |
| Purchase Options | We have three licenses to opt for: Single User License, Multi-User License (Up to 5 Users), Corporate Use License (Unlimited Users and Printable PDF) |


